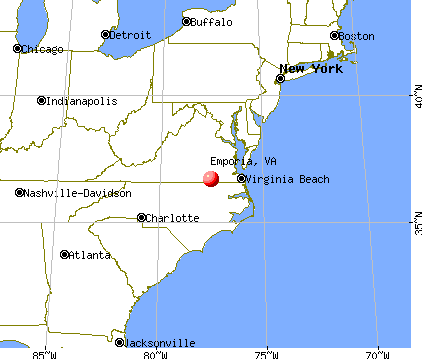
Emporia, Virginia
Submit your own pictures of this city and show them to the world
- OSM Map
- General Map
- Google Map
- MSN Map
Population change since 2000: -3.2%
 |
| Males: 2,443 | |
| Females: 3,038 |
| Median resident age: | 40.2 years |
| Virginia median age: | 39.0 years |
Zip codes: 23847.
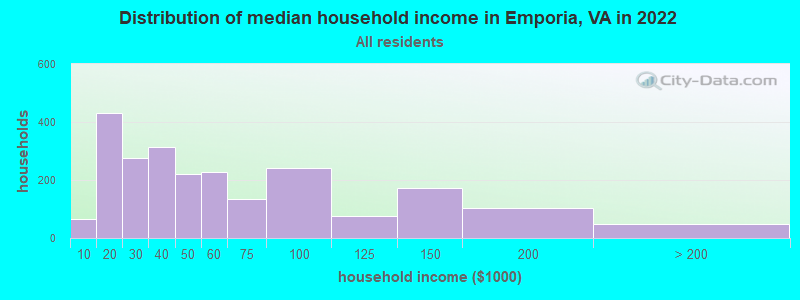
| Emporia: | $40,788 |
| VA: | $85,873 |
Estimated per capita income in 2022: $24,909 (it was $15,377 in 2000)
Emporia city income, earnings, and wages data
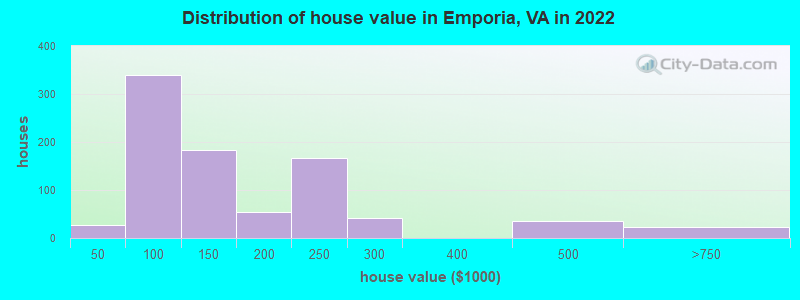
Estimated median house or condo value in 2022: $139,263 (it was $67,300 in 2000)
| Emporia: | $139,263 |
| VA: | $365,700 |
Mean prices in 2022: all housing units: $223,003; detached houses: $218,360; townhouses or other attached units: $275,006; mobile homes: $154,489
Median gross rent in 2022: $960.
(5.2% for White Non-Hispanic residents, 22.0% for Black residents, 16.2% for two or more races residents)
Detailed information about poverty and poor residents in Emporia, VA

Compare current foreclosures in Emporia, VA:
| Photo | Address | Area | Beds / Baths | Price | Details |
|---|---|---|---|---|---|

|
#1
Douglas Run Rd
Emporia, VA 23847
|
1,842 sq. feet
|
2 baths 3 beds |
show details | |

|
#2
Caney Branch Rd
Emporia, VA 23847
|
1,008 sq. feet
|
1 baths 2 beds |
show details | |

|
#3
Scotland Dr
Emporia, VA 23847
|
1,350 sq. feet
|
2 baths 3 beds |
show details | |

|
#4
Hicksford Rd
Emporia, VA 23847
|
1,008 sq. feet
|
2 baths 3 beds |
show details | |

|
#5
Camp Ground Rd
Emporia, VA 23847
|
1,352 sq. feet
|
1 baths 3 beds |
show details | |

|
#6
Macedonia Rd
Emporia, VA 23847
|
1,755 sq. feet
|
2 baths 3 beds |
show details | |

|
#7
Sussex Dr
Emporia, VA 23847
|
1,253 sq. feet
|
1 baths 3 beds |
show details | |

|
#8
Peachtree St
Emporia, VA 23847
|
- sq. feet
|
2 baths 5 beds |
show details | |

|
#9
Astrio St
Emporia, VA 23847
|
- sq. feet
|
- baths - beds |
show details | |

|
#10
Church St
Emporia, VA 23847
|
- sq. feet
|
- baths - beds |
show details |
| Photo | Address | Area | Beds / Baths | Price | Details |
|---|---|---|---|---|---|

|
#11
Gillus Rd
Emporia, VA 23847
|
- sq. feet
|
- baths - beds |
show details | |

|
#12
Rolling Acres Rd
Emporia, VA 23847
|
- sq. feet
|
- baths - beds |
show details | |

|
#13
Pleasant Shade Dr
Emporia, VA 23847
|
- sq. feet
|
- baths - beds |
show details | |

|
#14
S And J Dr
Emporia, VA 23847
|
- sq. feet
|
- baths - beds |
show details | |

|
#15
Crescent Rd
Emporia, VA 23847
|
- sq. feet
|
- baths - beds |
show details | |

|
#16
Brunswick Ave
Emporia, VA 23847
|
- sq. feet
|
- baths - beds |
show details | |

|
#17
Hicksford Rd
Emporia, VA 23847
|
- sq. feet
|
- baths - beds |
show details | |

|
#18
Stuart St
Emporia, VA 23847
|
- sq. feet
|
- baths - beds |
show details | |

|
#19
Meherrin St
Emporia, VA 23847
|
- sq. feet
|
- baths - beds |
show details | |

|
#20
W End Blvd
Emporia, VA 23847
|
- sq. feet
|
- baths - beds |
show details |
| Photo | Address | Area | Beds / Baths | Price | Details |
|---|---|---|---|---|---|

|
#21
Walnut Dr
Emporia, VA 23847
|
- sq. feet
|
- baths - beds |
show details | |

|
#22
Sunnyside Rd
Emporia, VA 23847
|
- sq. feet
|
- baths - beds |
show details | |

|
#23
Green Plains Rd
Emporia, VA 23847
|
- sq. feet
|
- baths - beds |
show details | |

|
#24
Church St
Emporia, VA 23847
|
- sq. feet
|
- baths - beds |
show details | |

|
#25
Evans St
Emporia, VA 23847
|
- sq. feet
|
- baths - beds |
show details | |

|
#26
Turner Ln
Emporia, VA 23847
|
- sq. feet
|
- baths - beds |
show details | |

|
#27
West Ave
Emporia, VA 23847
|
- sq. feet
|
- baths - beds |
show details | |

|
#28
W York Dr
Emporia, VA 23847
|
- sq. feet
|
- baths - beds |
show details | |

|
#29
Caney Branch Rd
Emporia, VA 23847
|
- sq. feet
|
- baths - beds |
show details | |

|
#30
Adams St
Emporia, VA 23847
|
- sq. feet
|
- baths - beds |
show details |
| Photo | Address | Area | Beds / Baths | Price | Details |
|---|---|---|---|---|---|

|
#31
Liberty Rd, Trlr 17
Emporia, VA 23847
|
- sq. feet
|
- baths - beds |
show details | |

|
#32
Lundy St
Emporia, VA 23847
|
- sq. feet
|
- baths - beds |
show details | |

|
#33
Zion Blvd
Emporia, VA 23847
|
- sq. feet
|
- baths - beds |
show details | |

|
#34
Russell Ln
Emporia, VA 23847
|
- sq. feet
|
- baths - beds |
show details | |

|
#35
Halifax St
Emporia, VA 23847
|
- sq. feet
|
- baths - beds |
show details | |

|
#36
Laurelwood St
Emporia, VA 23847
|
- sq. feet
|
- baths - beds |
show details | |

|
#37
Hudson Ln
Emporia, VA 23847
|
- sq. feet
|
- baths - beds |
show details | |

|
#38
Harding St
Emporia, VA 23847
|
- sq. feet
|
- baths - beds |
show details | |

|
#39
Skippers Rd # 7
Emporia, VA 23847
|
- sq. feet
|
- baths - beds |
show details | |

|
#40
Little Low Ground Rd
Emporia, VA 23847
|
- sq. feet
|
- baths - beds |
show details |
| Photo | Address | Area | Beds / Baths | Price | Details |
|---|---|---|---|---|---|

|
#41
Saint Johns St
Emporia, VA 23847
|
- sq. feet
|
- baths - beds |
show details | |

|
#42
Taylors Mill Rd
Emporia, VA 23847
|
- sq. feet
|
- baths - beds |
show details | |

|
#43
Harrji St
Emporia, VA 23847
|
- sq. feet
|
- baths - beds |
show details | |

|
#44
Cifers Ln
Emporia, VA 23847
|
- sq. feet
|
- baths - beds |
show details | |

|
#45
Deal St
Emporia, VA 23847
|
- sq. feet
|
- baths - beds |
show details | |

|
#46
Kistler St
Emporia, VA 23847
|
- sq. feet
|
- baths - beds |
show details | |

|
#47
Cartwright Ct Apt A
Emporia, VA 23847
|
- sq. feet
|
- baths - beds |
show details | |

|
#48
Crescent Rd
Emporia, VA 23847
|
- sq. feet
|
- baths - beds |
show details | |

|
#49
Turner Ln
Emporia, VA 23847
|
- sq. feet
|
- baths - beds |
show details | |

|
Check over 1 million property listings on Foreclosure.com!
|
browse all offers | |||


- 3,41159.7%Black alone
- 1,31723.0%White alone
- 72212.6%Two or more races
- 2784.9%Hispanic
- 450.8%Asian alone
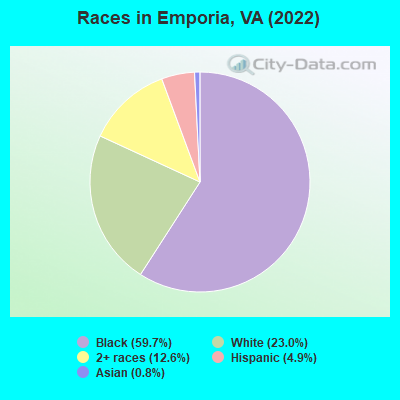
Races in Emporia detailed stats: ancestries, foreign born residents, place of birth
According to our research of Virginia and other state lists, there were 64 registered sex offenders living in Emporia, Virginia as of April 19, 2024.
The ratio of all residents to sex offenders in Emporia is 88 to 1.
Type |
2009 |
2010 |
2011 |
2012 |
2013 |
2014 |
2015 |
2016 |
2017 |
2018 |
2019 |
2020 |
2021 |
2022 |
|---|---|---|---|---|---|---|---|---|---|---|---|---|---|---|
| Murders (per 100,000) | 0 (0.0) | 1 (16.9) | 1 (16.7) | 0 (0.0) | 1 (17.6) | 2 (36.3) | 1 (18.7) | 0 (0.0) | 2 (38.5) | 0 (0.0) | 1 (20.0) | 2 (37.9) | 1 (19.3) | 3 (53.2) |
| Rapes (per 100,000) | 5 (88.3) | 2 (33.7) | 5 (83.4) | 3 (50.5) | 2 (35.1) | 3 (54.4) | 3 (56.2) | 5 (92.9) | 2 (38.5) | 2 (38.6) | 3 (60.0) | 2 (37.9) | 4 (77.1) | 2 (35.5) |
| Robberies (per 100,000) | 11 (194.3) | 8 (135.0) | 14 (233.4) | 5 (84.2) | 6 (105.4) | 5 (90.7) | 4 (74.9) | 10 (185.8) | 9 (173.0) | 8 (154.3) | 5 (100.0) | 4 (75.7) | 1 (19.3) | 10 (177.4) |
| Assaults (per 100,000) | 28 (494.5) | 21 (354.3) | 20 (333.4) | 24 (404.3) | 16 (281.0) | 19 (344.8) | 22 (412.1) | 19 (353.0) | 10 (192.3) | 16 (308.6) | 3 (60.0) | 12 (227.2) | 16 (308.3) | 10 (177.4) |
| Burglaries (per 100,000) | 62 (1,095) | 65 (1,097) | 116 (1,934) | 71 (1,196) | 44 (772.9) | 30 (544.4) | 30 (561.9) | 30 (557.4) | 29 (557.6) | 14 (270.1) | 19 (380.0) | 31 (586.9) | 15 (289.1) | 24 (425.8) |
| Thefts (per 100,000) | 260 (4,592) | 254 (4,285) | 253 (4,218) | 213 (3,588) | 187 (3,285) | 242 (4,391) | 234 (4,383) | 225 (4,181) | 189 (3,634) | 176 (3,395) | 168 (3,360) | 138 (2,613) | 119 (2,293) | 162 (2,874) |
| Auto thefts (per 100,000) | 15 (264.9) | 13 (219.3) | 21 (350.1) | 15 (252.7) | 4 (70.3) | 5 (90.7) | 3 (56.2) | 5 (92.9) | 5 (96.1) | 2 (38.6) | 9 (180.0) | 11 (208.3) | 10 (192.7) | 13 (230.6) |
| Arson (per 100,000) | 2 (35.3) | 2 (33.7) | 1 (16.7) | 2 (33.7) | 2 (35.1) | 2 (36.3) | 4 (74.9) | 0 (0.0) | 0 (0.0) | 0 (0.0) | 1 (20.0) | 3 (56.8) | 2 (38.5) | 0 (0.0) |
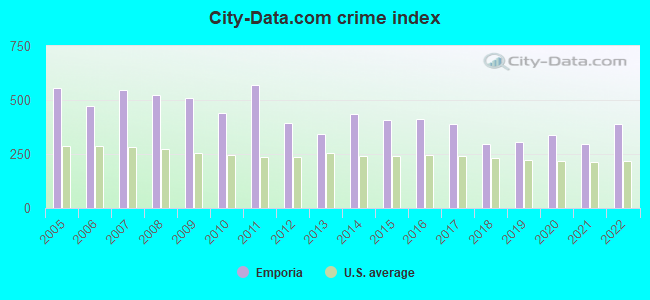
| City-Data.com crime index | 509.4 | 437.8 | 568.9 | 394.0 | 342.2 | 433.3 | 406.4 | 414.3 | 390.1 | 296.7 | 305.4 | 336.4 | 295.0 | 386.7 |
The City-Data.com crime index weighs serious crimes and violent crimes more heavily. Higher means more crime, U.S. average is 246.1. It adjusts for the number of visitors and daily workers commuting into cities.
Crime rate in Emporia detailed stats: murders, rapes, robberies, assaults, burglaries, thefts, arson
Full-time law enforcement employees in 2021, including police officers: 37 (26 officers - 20 male; 6 female).
| Officers per 1,000 residents here: | 5.01 |
| Virginia average: | 2.24 |
 Recent articles from our blog. Our writers, many of them Ph.D. graduates or candidates, create easy-to-read articles on a wide variety of topics.

 | Relocating for VA homestead/farmstead (56 replies) |
| Most Conservative Areas (118 replies) |
| 10 Places in Virginia You Should Never Move To (40 replies) |
| Speeding ticket in Brunswick CO (5 replies) |
| Does Richmond have a stronger connection with Southside or northern Virginia? (36 replies) |
| Fair Warning Relocation (117 replies) |
Latest news from Emporia, VA collected exclusively by city-data.com from local newspapers, TV, and radio stations
Ancestries: African (37.2%), English (10.2%), American (8.4%), Kenyan (1.9%).
Current Local Time: EST time zone
Incorporated in 1887
Elevation: 119 feet
Land area: 6.89 square miles.
Population density: 795 people per square mile (low).
185 residents are foreign born (1.1% Latin America, 1.0% Africa, 0.8% Asia).
| This city: | 3.2% |
| Virginia: | 12.6% |
Median real estate property taxes paid for housing units with mortgages in 2022: $1,543 (0.7%)
Median real estate property taxes paid for housing units with no mortgage in 2022: $817 (0.8%)
Nearest city with pop. 50,000+: Suffolk, VA  (51.6 miles , pop. 63,677).
Nearest city with pop. 200,000+: Norfolk, VA (72.0 miles , pop. 234,403).
Nearest city with pop. 1,000,000+: Philadelphia, PA (262.9 miles , pop. 1,517,550).
Nearest cities:
), ), ), Latitude: 36.69 N, Longitude: 77.54 W
Daytime population change due to commuting: +1,539 (+26.9%)
Workers who live and work in this city: 989 (44.8%)
Area code: 434
Emporia, Virginia accommodation & food services, waste management - Economy and Business Data
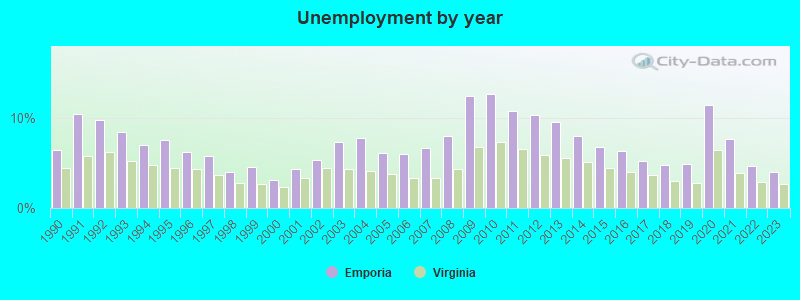
| Here: | 4.0% |
| Virginia: | 2.7% |
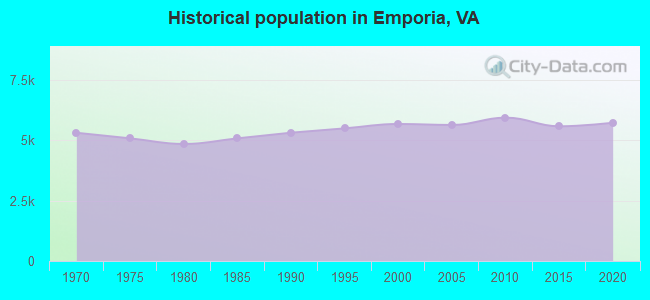
Population change in the 1990s: +108 (+1.9%).
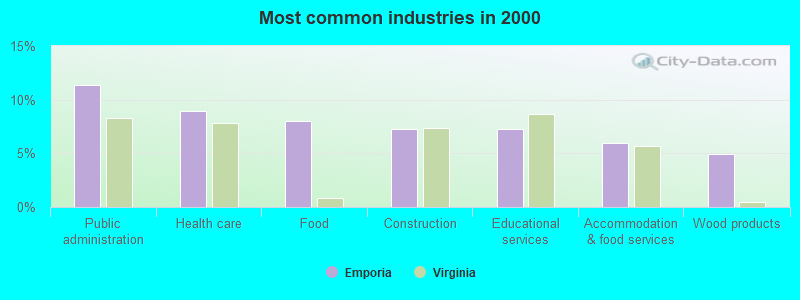
- Public administration (11.4%)
- Health care (8.9%)
- Food (8.0%)
- Construction (7.3%)
- Educational services (7.3%)
- Accommodation & food services (6.0%)
- Wood products (4.9%)
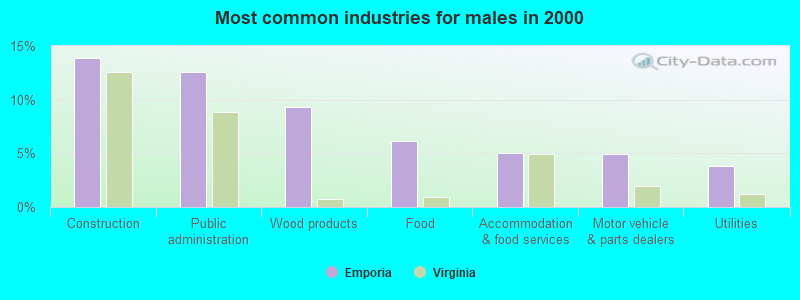
- Construction (13.9%)
- Public administration (12.6%)
- Wood products (9.3%)
- Food (6.2%)
- Accommodation & food services (5.0%)
- Motor vehicle & parts dealers (4.9%)
- Utilities (3.8%)
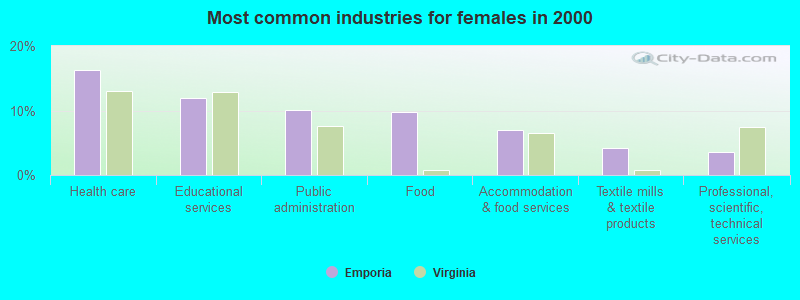
- Health care (16.2%)
- Educational services (12.0%)
- Public administration (10.1%)
- Food (9.8%)
- Accommodation & food services (6.9%)
- Textile mills & textile products (4.2%)
- Professional, scientific, technical services (3.6%)
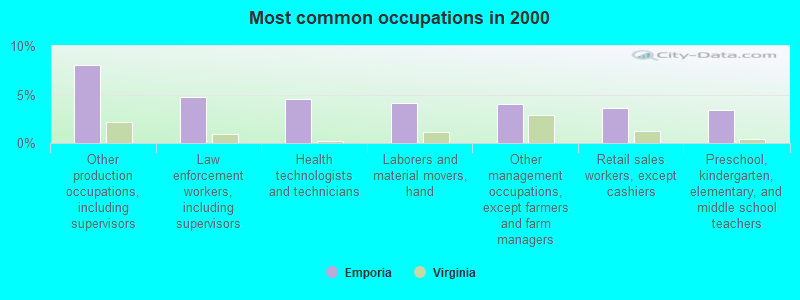
- Other production occupations, including supervisors (8.1%)
- Law enforcement workers, including supervisors (4.8%)
- Health technologists and technicians (4.5%)
- Laborers and material movers, hand (4.1%)
- Other management occupations, except farmers and farm managers (4.0%)
- Retail sales workers, except cashiers (3.7%)
- Preschool, kindergarten, elementary, and middle school teachers (3.4%)
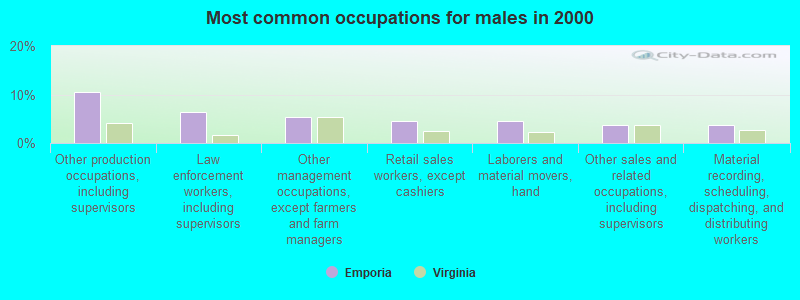
- Other production occupations, including supervisors (10.5%)
- Law enforcement workers, including supervisors (6.3%)
- Other management occupations, except farmers and farm managers (5.5%)
- Retail sales workers, except cashiers (4.6%)
- Laborers and material movers, hand (4.5%)
- Other sales and related occupations, including supervisors (3.8%)
- Material recording, scheduling, dispatching, and distributing workers (3.8%)
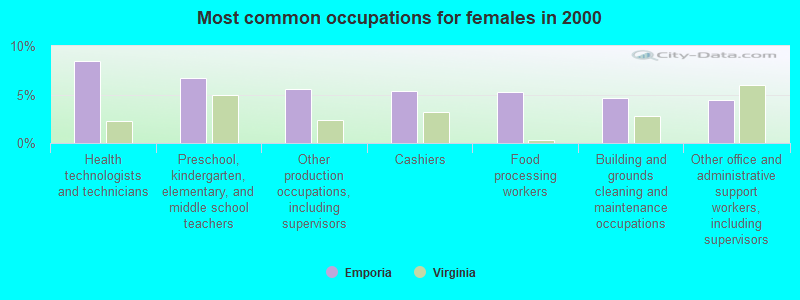
- Health technologists and technicians (8.5%)
- Preschool, kindergarten, elementary, and middle school teachers (6.7%)
- Other production occupations, including supervisors (5.6%)
- Cashiers (5.4%)
- Food processing workers (5.2%)
- Building and grounds cleaning and maintenance occupations (4.7%)
- Other office and administrative support workers, including supervisors (4.4%)
Average climate in Emporia, Virginia
Based on data reported by over 4,000 weather stations


|
|

(lower is better)
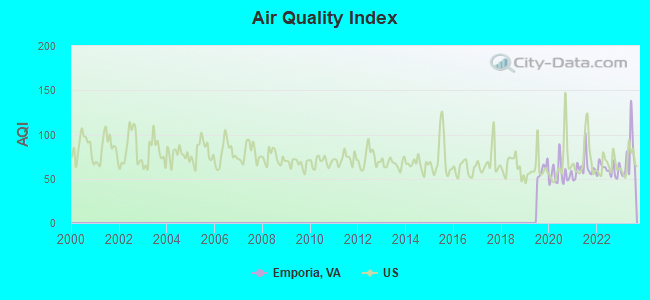
Air Quality Index (AQI) level in 2023 was 73.3. This is about average.
| City: | 73.3 |
| U.S.: | 72.6 |
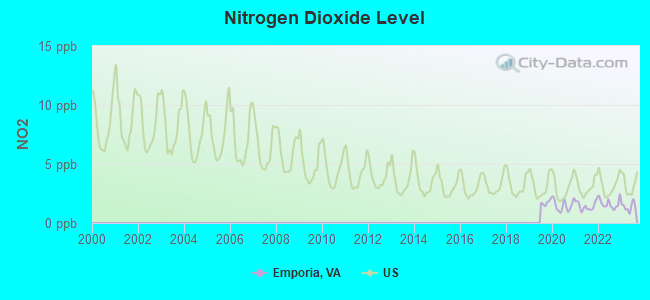
Nitrogen Dioxide (NO2) [ppb] level in 2023 was 1.38. This is significantly better than average. Closest monitor was 14.1 miles away from the city center.
| City: | 1.38 |
| U.S.: | 5.11 |
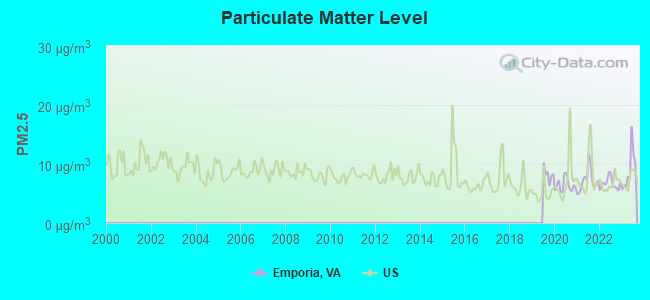
Particulate Matter (PM2.5) [µg/m3] level in 2023 was 8.95. This is about average. Closest monitor was 14.1 miles away from the city center.
| City: | 8.95 |
| U.S.: | 8.11 |
Tornado activity:
Emporia-area historical tornado activity is slightly above Virginia state average. It is 7% smaller than the overall U.S. average.
On 11/28/1988, a category F4 (max. wind speeds 207-260 mph) tornado 18.0 miles away from the Emporia city center killed 4 people and injured 154 people and caused between $50,000,000 and $500,000,000 in damages.
On 4/19/1978, a category F3 (max. wind speeds 158-206 mph) tornado 13.1 miles away from the city center injured 3 people and caused between $50,000 and $500,000 in damages.
Earthquake activity:
Emporia-area historical earthquake activity is significantly above Virginia state average. It is 55% smaller than the overall U.S. average.On 8/23/2011 at 17:51:04, a magnitude 5.8 (5.8 MW, Depth: 3.7 mi, Class: Moderate, Intensity: VI - VII) earthquake occurred 87.0 miles away from the city center
On 12/9/2003 at 20:59:14, a magnitude 4.5 (4.5 MB, 4.5 LG, Class: Light, Intensity: IV - V) earthquake occurred 65.0 miles away from the city center
On 8/9/2020 at 12:07:37, a magnitude 5.1 (5.1 MW, Depth: 4.7 mi) earthquake occurred 198.0 miles away from Emporia center
On 12/9/2003 at 20:59:18, a magnitude 4.5 (4.5 ML, Depth: 6.2 mi) earthquake occurred 80.9 miles away from the city center
On 8/25/2011 at 05:07:52, a magnitude 4.5 (4.5 ML, Depth: 4.2 mi) earthquake occurred 89.9 miles away from Emporia center
On 8/24/2011 at 00:04:36, a magnitude 4.2 (4.2 ML) earthquake occurred 87.5 miles away from the city center
Magnitude types: regional Lg-wave magnitude (LG), body-wave magnitude (MB), local magnitude (ML), moment magnitude (MW)
Natural disasters:
The number of natural disasters in Greensville County (13) is near the US average (15).Major Disasters (Presidential) Declared: 9
Emergencies Declared: 4
Causes of natural disasters: Hurricanes: 6, Storms: 2, Winter Storms: 2, Blizzard: 1, Drought: 1, Flood: 1, Tornado: 1, Tropical Depression: 1, Other: 1 (Note: some incidents may be assigned to more than one category).
Hospitals and medical centers in Emporia:
- SOUTHERN VIRGINIA REGIONAL MEDICAL CENTER (Proprietary, provides emergency services, 727 NORTH MAIN STREET)
- AVIS B ADAMS CHRISTIAN CONV CENTER (200 WEAVER AVENUE)
- EMPORIA MANOR LLC (200 WEAVER AVENUE)
- GREENSVILLE MANOR LLC (214 WEAVER AVE)
- MEHERRIN DIALYSIS CENTER (201 A WEAVER AVE)
- SOUTHERN VIRGINIA REGIONAL HOME HEALTH AGENCY (201 HICKSFORD AVENUE)
Airports and heliports located in Emporia:
- Emporia-Greensville Regional Airport (EMV) (Runways: 1, Air Taxi Ops: 50, Itinerant Ops: 820, Local Ops: 350, Military Ops: 50)
- Southern Virginia Regional Medical Center Heliport (73VA)
Colleges/universities with over 2000 students nearest to Emporia:
- Southside Virginia Community College (about 24 miles; Alberta, VA; Full-time enrollment: 3,716)
- Virginia State University (about 39 miles; Petersburg, VA; FT enrollment: 5,815)
- John Tyler Community College (about 46 miles; Chester, VA; FT enrollment: 5,864)
- Nash Community College (about 54 miles; Rocky Mount, NC; FT enrollment: 2,520)
- Edgecombe Community College (about 57 miles; Tarboro, NC; FT enrollment: 2,058)
- Vance-Granville Community College (about 59 miles; Henderson, NC; FT enrollment: 3,232)
- Virginia Commonwealth University (about 60 miles; Richmond, VA; FT enrollment: 26,647)
Public high school in Emporia:
- GREENSVILLE COUNTY HIGH (Students: 781, Location: 403 HARDING ST, Grades: 9-12)
Private high school in Emporia:
Public elementary/middle schools in Emporia:
- GREENSVILLE ELEM (Students: 1,114, Location: 1101 SUSSEX DR, Grades: PK-5)
- EDWARD W WYATT MIDDLE (Students: 387, Location: 206 SLAGLES LAKE RD, Grades: 5-8)
- BELFIELD ELEM (Students: 360, Location: 515 BELFIELD RD, Grades: 5)
User-submitted facts and corrections:
- New name of hospital, changed from Greensville Memorial Hospital to Southern Virginia Regional Medical Center. Closed old facility, and dedicated new facility Dec. 5, 2003. Need to correct town close to Emporia, VA as just Weldon, NC, not South Weldon, NC.
added by V. Martha Dodd
- New name of hospital, changed from Greensville Memorial Hospital to Southern Virginia Regional Medical Center. Closed old facility, and dedicated new facility Dec. 5, 2003. Need to correct town close to Emporia, VA as just Weldon, NC, not South Weldon, NC.
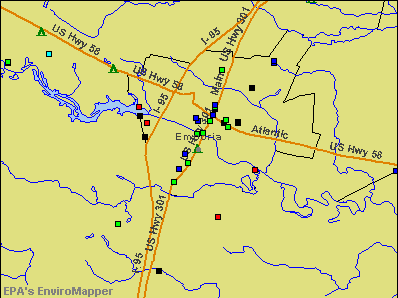
Points of interest:
Notable locations in Emporia: Emporia Industrial Park (A), Emporia Waste Water Treatment Plant (B), Emporia Waterworks (C), Emporia Executive Center (D), Greensville Volunteer Rescue Squad (E), Greensville County Sheriff's Office (F), Emporia County Sheriff's Office (G), Emporia Volunteer Fire Department (H), Lifestar Ambulance Service Emporia (I), Village View (J), Richardson Memorial Library (K), Greensville County Jail (L), Greensville County-Emporia Historical Museum (M), Greensville County Courthouse (N), Emporia Municipal Building (O), Emporia Police Department (P). Display/hide their locations on the map
Shopping Centers: Belfield Marketplace Shopping Center (1), Emporia Shopping Center (2), Southside Square Shopping Center (3). Display/hide their locations on the map
Churches in Emporia include: Saint Johns Church (A), Saint Pauls Church (B), Baltimore Baptist Church (C), Church of the Holy City (D), Faith Baptist Church (E), Living Waters Rock Church (F), Apostolic Faith Church (G), Bible Baptist Independent Missionary Church (H), Calvary Baptist Church (I). Display/hide their locations on the map
Cemeteries: Cottage Cemetery (1), Emporia Cemetery (2). Display/hide their locations on the map
Reservoirs: Emporia Lake (A), Meherrin River Reservoir (B). Display/hide their locations on the map
Streams, rivers, and creeks: Metcalf Branch (A). Display/hide its location on the map
Parks in Emporia include: Meherrin River Park (1), Veterans Memorial Park (2). Display/hide their locations on the map
Tourist attraction: Kool Kidz (Arcades & Amusements; 700 West Atlantic St).
Hotels: Hampton Inn (I 95 & Highway 58 West), Emporia-Days Inn (921 W Atlantic St), Hampton Inn Emporia- VA (1207 West Atlantic Street), Holiday Inn Express Hotel & Suites (1350 West Atlantic Street), Fairfield Inn Suites (104 Cloverleaf Drive), Comfort Inn Emporia (1411 Skippers Road), Emporia Knights Inn (3173 Sussex Dr), Best Western Emporia (1100 West Atlantic Street), Fairfield Inn & Suites Emporia (104 Cloverleaf Drive).
Birthplace of: Benjamin S. Griffin - Army general, Frank E. Grizzard, Jr. - Historian, Hermie Sadler - Nextel Cup series NASCAR driver (born: Apr 24, 1969), Maurice Hicks - 2005 NFL player (San Francisco 49ers, born: Jul 22, 1978), Bryant Stith - Basketball player, Elliott Sadler - Busch series NASCAR driver (born: Apr 30, 1975), John N. Dalton - Politician, Raynor Scheine - Film actor, Theresa Merritt - Actress, Henry Jordan - Football player.
Drinking water stations with addresses in Emporia and their reported violations in the past:
GCWSA - JARRATT (Population served: 7,190, Surface water):Past health violations:EMPORIA, CITY OF (Population served: 5,600, Surface water):
- MCL, Monthly (TCR) - In SEP-2012, Contaminant: Coliform. Follow-up actions: St Public Notif requested (OCT-16-2012), St Formal NOV issued (OCT-16-2012), St Compliance achieved (OCT-22-2012), St Public Notif received (NOV-16-2012)
- MCL, Monthly (TCR) - In AUG-2005, Contaminant: Coliform. Follow-up actions: St Formal NOV issued (OCT-03-2005), St Public Notif requested (OCT-03-2005), St Public Notif received (NOV-04-2005)
- MCL, Monthly (TCR) - In JUL-2005, Contaminant: Coliform. Follow-up actions: St Formal NOV issued (AUG-03-2005), St Public Notif requested (AUG-03-2005), St Public Notif received (SEP-02-2005)
Past health violations:Past monitoring violations:
- MCL, Average - Between JUL-2010 and SEP-2010, Contaminant: Total Haloacetic Acids (HAA5). Follow-up actions: St Public Notif requested (SEP-16-2010), St Formal NOV issued (SEP-16-2010), St Public Notif received (OCT-12-2010), St Compliance achieved (SEP-30-2011)
- MCL, Average - Between APR-2005 and JUN-2005, Contaminant: TTHM. Follow-up actions: St BCA signed (DEC-02-2004), St Formal NOV issued (JUL-29-2005), St Public Notif requested (JUL-29-2005), St Compliance achieved (AUG-05-2005), St Public Notif received (AUG-25-2005)
- One minor monitoring violation
Drinking water stations with addresses in Emporia that have no violations reported:
- VA REST AREA I-95 (Population served: 1,108, Primary Water Source Type: Purch surface water)
| This city: | 2.5 people |
| Virginia: | 2.5 people |
| This city: | 62.2% |
| Whole state: | 67.0% |
| This city: | 8.7% |
| Whole state: | 5.7% |
Likely homosexual households (counted as self-reported same-sex unmarried-partner households)
- Lesbian couples: 0.3% of all households
- Gay men: 0.3% of all households
People in group quarters in Emporia in 2010:
- 226 people in nursing facilities/skilled-nursing facilities
- 15 people in emergency and transitional shelters (with sleeping facilities) for people experiencing homelessness
- 5 people in group homes intended for adults
People in group quarters in Emporia in 2000:
- 181 people in nursing homes
- 73 people in other noninstitutional group quarters
- 4 people in homes or halfway houses for drug/alcohol abuse
Banks with branches in Emporia (2011 data):
- Bank of Hampton Roads: Dominion Drive Branch at 100 Dominion Drive, branch established on 2008/02/07; Emporia Branch at 520 S Main Street, branch established on 2004/10/18. Info updated 2009/05/20: Bank assets: $1,899.1 mil, Deposits: $1,581.4 mil, headquarters in Norfolk, VA, negative income in the last year, Commercial Lending Specialization, 47 total offices, Holding Company: Capgen Capital Group Vi Lp
- First Community Bank: South Main Street Branch at 431 South Main Street, branch established on 2001/12/07; Emporia-Halifax at 401 Halifax Street, branch established on 2001/12/07. Info updated 2011/07/12: Bank assets: $2,144.1 mil, Deposits: $1,561.3 mil, headquarters in Bluefield, VA, positive income, Commercial Lending Specialization, 58 total offices, Holding Company: First Community Bancshares, Inc.
- Branch Banking and Trust Company: Emporia Main Branch at 301 West Atlantic Street, branch established on 1979/04/19. Info updated 2010/03/29: Bank assets: $168,867.6 mil, Deposits: $127,549.5 mil, headquarters in Winston Salem, NC, positive income, Commercial Lending Specialization, 1793 total offices, Holding Company: Bb&T Corporation
- Carter Bank & Trust: Emporia Branch at 701 North Main Street, branch established on 2004/04/02. Info updated 2007/02/23: Bank assets: $3,970.4 mil, Deposits: $3,610.0 mil, headquarters in Martinsville, VA, positive income, Commercial Lending Specialization, 123 total offices
- First-Citizens Bank & Trust Company: Emporia Branch at 214 West Atlantic Street, branch established on 1993/09/07. Info updated 2011/10/11: Bank assets: $20,566.4 mil, Deposits: $17,596.8 mil, headquarters in Raleigh, NC, positive income, Commercial Lending Specialization, 433 total offices, Holding Company: First Citizens Bancshares, Inc.
- The Bank of Southside Virginia: Greensville-Emporia Branch at 1400 West Atlantic Street, branch established on 1979/12/17. Info updated 2006/11/03: Bank assets: $530.3 mil, Deposits: $452.9 mil, headquarters in Carson, VA, positive income, 15 total offices, Holding Company: Bank Of Southside Virginia Corporation, The
For population 15 years and over in Emporia:
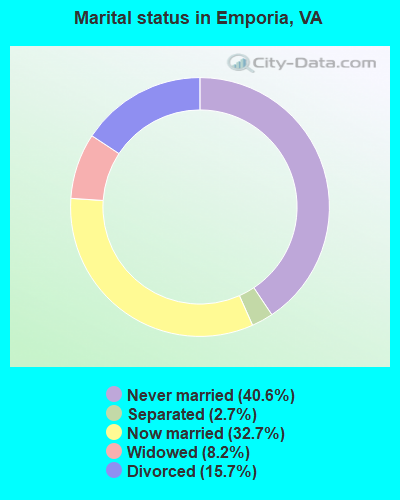
- Never married: 40.6%
- Now married: 32.7%
- Separated: 2.7%
- Widowed: 8.2%
- Divorced: 15.7%
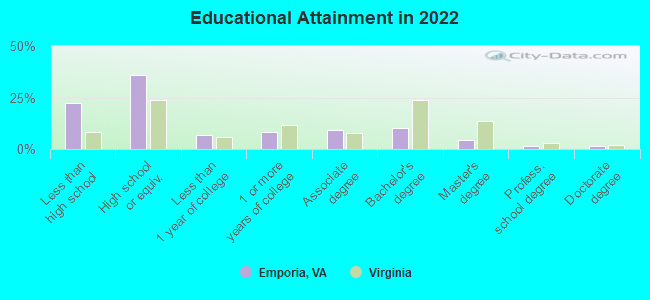
For population 25 years and over in Emporia:
- High school or higher: 76.9%
- Bachelor's degree or higher: 16.5%
- Graduate or professional degree: 6.9%
- Unemployed: 6.8%
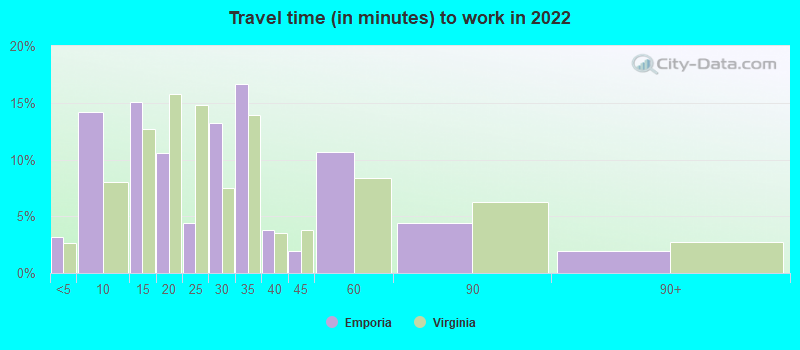
- Mean travel time to work (commute): 20.0 minutes
| Here: | 15.2 |
| Virginia average: | 12.1 |
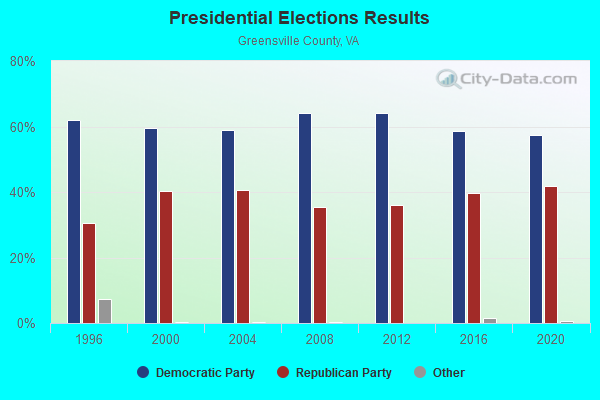
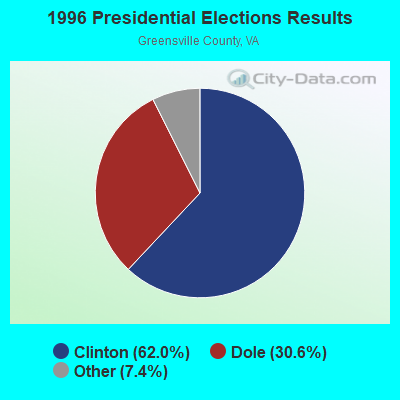
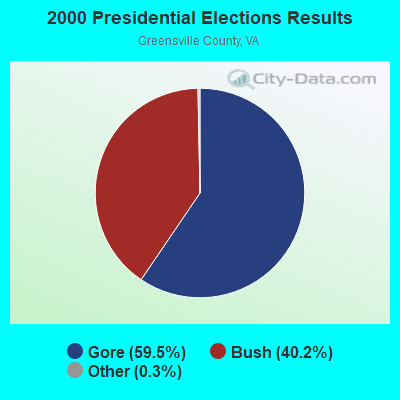
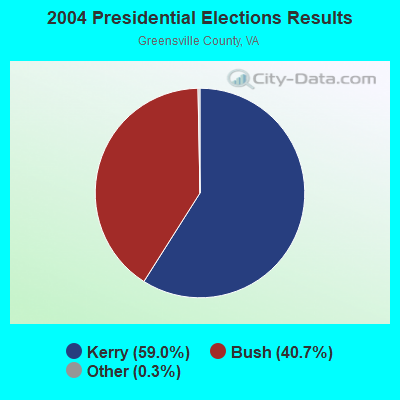
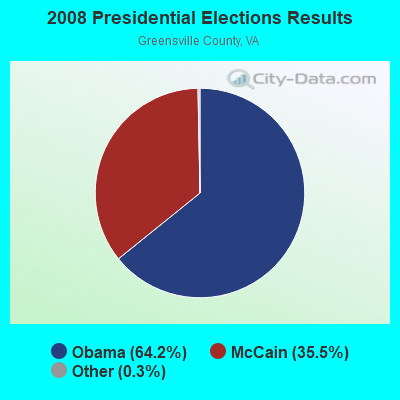
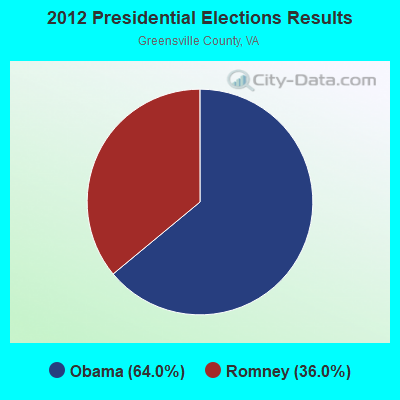
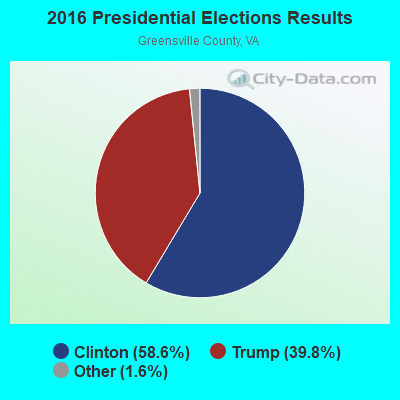
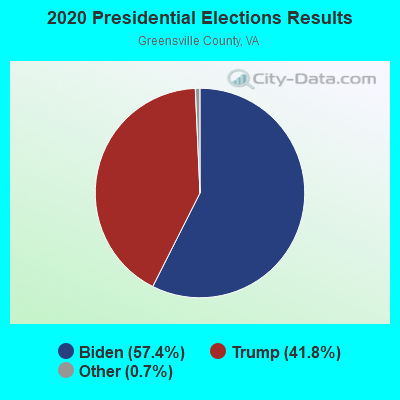
Graphs represent county-level data. Detailed 2008 Election Results
Religion statistics for Emporia, VA (based on Greensville County data)
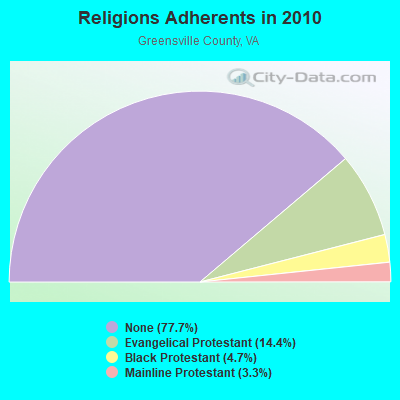
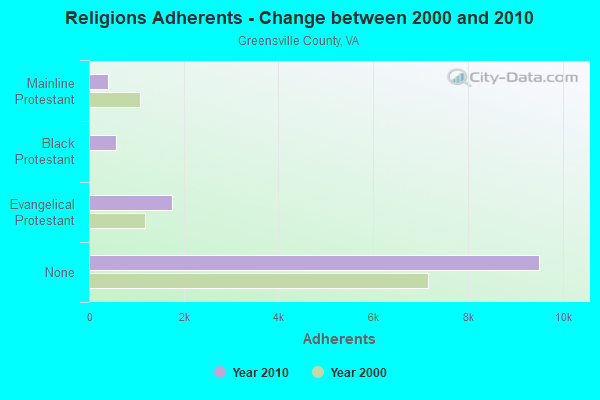
| Religion | Adherents | Congregations |
|---|---|---|
| Evangelical Protestant | 1,757 | 12 |
| Black Protestant | 570 | 5 |
| Mainline Protestant | 404 | 7 |
| Other | - | 2 |
| None | 9,512 | - |
Food Environment Statistics:
| This county: | 2.52 / 10,000 pop. |
| State: | 2.03 / 10,000 pop. |
| Greensville County: | 0.84 / 10,000 pop. |
| Virginia: | 1.43 / 10,000 pop. |
| This county: | 10.07 / 10,000 pop. |
| Virginia: | 4.03 / 10,000 pop. |
| Greensville County: | 1.68 / 10,000 pop. |
| Virginia: | 7.65 / 10,000 pop. |
| Here: | 11.3% |
| Virginia: | 9.3% |
| Greensville County: | 31.1% |
| Virginia: | 26.7% |
Health and Nutrition:
| This city: | 49.0% |
| Virginia: | 50.6% |
| Emporia: | 45.3% |
| State: | 48.6% |
| Here: | 29.5 |
| Virginia: | 28.6 |
| Here: | 19.4% |
| Virginia: | 20.2% |
| Emporia: | 13.0% |
| Virginia: | 10.5% |
| This city: | 6.8 |
| Virginia: | 6.8 |
| Emporia: | 35.7% |
| State: | 33.5% |
| Here: | 53.2% |
| Virginia: | 57.4% |
| This city: | 79.3% |
| State: | 80.5% |
More about Health and Nutrition of Emporia, VA Residents
Emporia government finances - Expenditure in 2021 (per resident):
- Construction - Water Utilities: $1,022,000 ($186.46)
Regular Highways: $35,000 ($6.39)
- Current Operations - Police Protection: $3,627,000 ($661.74)
Sewerage: $1,450,000 ($264.55)
Regular Highways: $1,415,000 ($258.16)
Financial Administration: $1,333,000 ($243.20)
Water Utilities: $1,201,000 ($219.12)
Central Staff Services: $1,152,000 ($210.18)
Solid Waste Management: $817,000 ($149.06)
Public Welfare - Other: $394,000 ($71.88)
Local Fire Protection: $376,000 ($68.60)
General Public Buildings: $376,000 ($68.60)
Housing and Community Development: $324,000 ($59.11)
Health - Other: $280,000 ($51.09)
Libraries: $111,000 ($20.25)
Air Transportation: $111,000 ($20.25)
Parks and Recreation: $88,000 ($16.06)
Judicial and Legal Services: $44,000 ($8.03)
- Intergovernmental to Local - Other - Elementary and Secondary Education: $4,346,000 ($792.92)
Other - Judicial and Legal Services: $483,000 ($88.12)
Other - Police Protection: $435,000 ($79.37)
Other - Solid Waste Management: $186,000 ($33.94)
Other - Central Staff Services: $50,000 ($9.12)
- Other Capital Outlay - Solid Waste Management: $93,000 ($16.97)
Local Fire Protection: $68,000 ($12.41)
Police Protection: $50,000 ($9.12)
Regular Highways: $13,000 ($2.37)
- Total Salaries and Wages: $5,395,000 ($984.31)
Emporia government finances - Revenue in 2021 (per resident):
- Charges - Sewerage: $1,479,000 ($269.84)
Solid Waste Management: $933,000 ($170.22)
Other: $55,000 ($10.03)
- Local Intergovernmental - General Local Government Support: $246,000 ($44.88)
Other: $160,000 ($29.19)
- Miscellaneous - Fines and Forfeits: $2,155,000 ($393.18)
General Revenue - Other: $11,000 ($2.01)
Donations From Private Sources: $2,000 ($0.36)
- Revenue - Water Utilities: $1,716,000 ($313.08)
- State Intergovernmental - Highways: $1,824,000 ($332.79)
Other: $1,751,000 ($319.47)
Education: $1,257,000 ($229.34)
General Local Government Support: $801,000 ($146.14)
Housing and Community Development: $293,000 ($53.46)
- Tax - Property: $6,607,000 ($1205.44)
Other Selective Sales: $3,686,000 ($672.51)
General Sales and Gross Receipts: $1,804,000 ($329.14)
Occupation and Business License - Other: $947,000 ($172.78)
Public Utilities Sales: $868,000 ($158.37)
Motor Vehicle License: $144,000 ($26.27)
Documentary and Stock Transfer: $32,000 ($5.84)
Death and Gift: $31,000 ($5.66)
Other License: $25,000 ($4.56)
| Businesses in Emporia, VA | ||||
| Name | Count | Name | Count | |
|---|---|---|---|---|
| 7-Eleven | 1 | Lowe's | 1 | |
| Advance Auto Parts | 1 | Marriott | 1 | |
| Applebee's | 1 | McDonald's | 1 | |
| Arby's | 1 | Nike | 3 | |
| Best Western | 1 | Pizza Hut | 1 | |
| Burger King | 1 | Quality | 1 | |
| CVS | 1 | Quiznos | 1 | |
| Chevrolet | 1 | RadioShack | 1 | |
| Cracker Barrel | 1 | Rite Aid | 1 | |
| Days Inn | 1 | Rodeway Inn | 1 | |
| Domino's Pizza | 1 | Sleep Inn | 1 | |
| FedEx | 2 | Subway | 1 | |
| H&R Block | 1 | T-Mobile | 2 | |
| Hardee's | 1 | Taco Bell | 1 | |
| Hilton | 1 | U-Haul | 1 | |
| Holiday Inn | 1 | UPS | 2 | |
| KFC | 1 | Walmart | 1 | |
| La-Z-Boy | 1 | Wendy's | 1 | |
| Lane Furniture | 2 | YMCA | 1 | |
| Long John Silver's | 1 | |||
Strongest AM radio stations in Emporia:
- WEVA (860 AM; daytime; 1 kW; EMPORIA, VA; Owner: COLONIAL MEDIA CORPORATION)
- WTAR (850 AM; 50 kW; NORFOLK, VA; Owner: SINCLAIR COMMUNICATIONS)
- WRVA (1140 AM; 50 kW; RICHMOND, VA; Owner: CLEAR CHANNEL BROADCASTING LICENSES, INC.)
- WCKO (1110 AM; daytime; 50 kW; NORFOLK, VA; Owner: WORD BROADCASTING NETWORK, INC.)
- WDZY (1290 AM; 25 kW; COLONIAL HEIGHTS, VA; Owner: ABC, INC.)
- WRJR (670 AM; 20 kW; CLAREMONT, VA; Owner: CHESAPEAKE-PORTSMOUTH BROADCASTING CORPORATION)
- WFTK (1030 AM; daytime; 50 kW; WAKE FOREST, NC; Owner: POSITIVE RADIO GROUP, INC.)
- WPTF (680 AM; 50 kW; RALEIGH, NC; Owner: FIRST STATE COMMUNICATIONS)
- WGGM (820 AM; 10 kW; CHESTER, VA; Owner: HOFFMAN COMMUNICATIONS, INC.)
- WGH (1310 AM; 20 kW; NEWPORT NEWS, VA; Owner: CHESAPEAKE BAY BROADCASTING, LLC)
- WKGM (940 AM; 10 kW; SMITHFIELD, VA; Owner: WKGM, INC.)
- WKLV (1440 AM; 5 kW; BLACKSTONE, VA; Owner: DENBAR COMMUNICATIONS, INC.)
- WWGB (1030 AM; daytime; 50 kW; INDIAN HEAD, MD; Owner: GOOD BODY MEDIA, LLC)
Strongest FM radio stations in Emporia:
- WJYA (89.3 FM; EMPORIA, VA; Owner: CSN INTERNATIONAL)
- WYTT (97.9 FM; GASTON, NC; Owner: MAINQUAD, INC.)
- WZRU (88.5 FM; ROANOKE RAPIDS, NC; Owner: ROANOKE VALLEY COMMUNICATIONS, INC.)
- WRTP-FM (90.1 FM; ROANOKE RAPIDS, NC; Owner: RADIO TRAINING NETWORK, INC.)
- WKJS (104.7 FM; CREWE, VA; Owner: RADIO ONE LICENSES, LLC)
- WAFX (106.9 FM; SUFFOLK, VA; Owner: TIDEWATER COMMUNICATIONS, LLC)
- WSMY-FM (103.1 FM; ALBERTA, VA; Owner: MAINQUAD BROADCASTING, INC.)
- WTRG (100.7 FM; ROCKY MOUNT, NC; Owner: CAPSTAR TX LIMITED PARTNERSHIP)
- WPTM (102.3 FM; ROANOKE RAPIDS, NC; Owner: MAINQUAD COMMUNICATIONS, INC)
- WLQM-FM (101.7 FM; FRANKLIN, VA; Owner: FRANKLIN BROADCASTING CORPORATION)
TV broadcast stations around Emporia:
- WWAY (Channel 3; WILMINGTON, NC; Owner: LIBCO, INC.)
- WNVN-LP (Channel 20; ROANOKE RAPIDS, NC; Owner: MAINQUAD COMMUNICATIONS, INC.)
- WUNP-TV (Channel 36; ROANOKE RAPIDS, NC; Owner: UNIVERSITY OF NORTH CAROLINA)
- WRPX (Channel 47; ROCKY MOUNT, NC; Owner: PAXSON RALEIGH LICENSE, INC.)
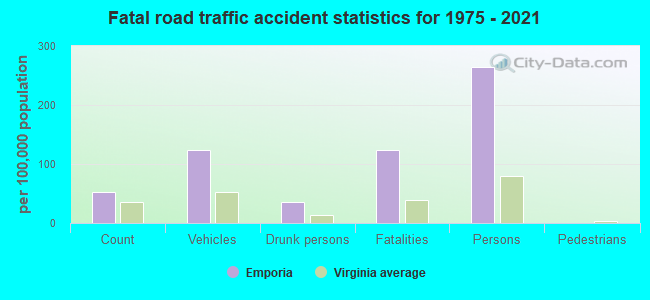
Emporia fatal accident list:
Jun 8, 2007 03:30 PM, Us-58, Market Dr, Lat: 36.699444, Lon: -77.544186, Vehicles: 3, Persons: 6, Fatalities: 4, Drunk persons involved: 1
Jan 14, 1997 02:25 PM, I95, Vehicles: 2, Persons: 3, Fatalities: 2
- National Bridge Inventory (NBI) Statistics
- 62Number of bridges
- 719ft / 219mTotal length
- $11,815,000Total costs
- 561,619Total average daily traffic
- 55,422Total average daily truck traffic
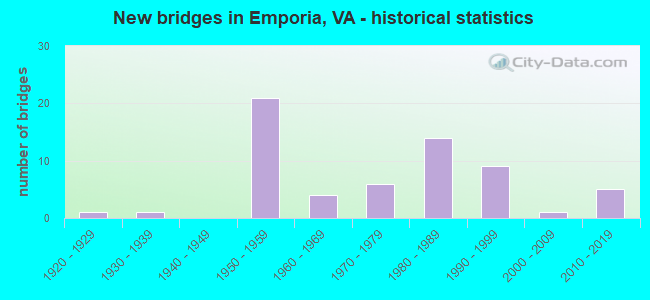
- New bridges - historical statistics
- 11920-1929
- 11930-1939
- 211950-1959
- 41960-1969
- 61970-1979
- 141980-1989
- 91990-1999
- 12000-2009
- 52010-2019
FCC Registered Cell Phone Towers:
3 (See the full list of FCC Registered Cell Phone Towers in Emporia)FCC Registered Antenna Towers:
155 (See the full list of FCC Registered Antenna Towers)FCC Registered Private Land Mobile Towers:
2 (See the full list of FCC Registered Private Land Mobile Towers in Emporia, VA)FCC Registered Broadcast Land Mobile Towers:
40 (See the full list of FCC Registered Broadcast Land Mobile Towers)FCC Registered Microwave Towers:
165 (See the full list of FCC Registered Microwave Towers in this town)FCC Registered Paging Towers:
5 (See the full list of FCC Registered Paging Towers)FCC Registered Maritime Coast & Aviation Ground Towers:
7 (See the full list of FCC Registered Maritime Coast & Aviation Ground Towers)FCC Registered Amateur Radio Licenses:
14 (See the full list of FCC Registered Amateur Radio Licenses in Emporia)FAA Registered Aircraft:
6- Aircraft: LUSCOMBE 8A (Category: Land, Seats: 2, Weight: Up to 12,499 Pounds, Speed: 86 mph), Engine: CONT MOTOR A&C65 SERIES (65 HP) (Reciprocating)
N-Number: 28574, N28574, N-28574, Serial Number: 1403, Year manufactured: 1940, Airworthiness Date: 07/20/1955, Certificate Issue Date: 03/23/1995
Registrant (Partnership): David M Edmonds, Po Box 1014, Emporia, VA 23847, Other Owners: Sharri L Presley - Aircraft: PIPER PA-32-260 (Category: Land, Seats: 6, Weight: Up to 12,499 Pounds, Speed: 126 mph), Engine: LYCOMING 0-540 SERIES (250 HP) (Reciprocating)
N-Number: 3353W, N3353W, N-3353W, Serial Number: 32-196, Year manufactured: 1965, Airworthiness Date: 11/09/1965, Certificate Issue Date: 03/31/2000
Registrant (Co-Owned): Charles I Jr Trustee Grigg, Po Box 1081, Emporia, VA 23847, Other Owners: Susan K Trustee Grigg - Aircraft: PIPER PA-28-140 (Category: Land, Seats: 4, Weight: Up to 12,499 Pounds, Speed: 107 mph), Engine: LYCOMING 0-320 SERIES (180 HP) (Reciprocating)
N-Number: 4547R, N4547R, N-4547R, Serial Number: 28-21253, Year manufactured: 1965, Airworthiness Date: 11/11/1965, Certificate Issue Date: 04/04/1994
Registrant (Individual): Michael K Yeattes, 1201 Wiggins Rd, Emporia, VA 23847 - Aircraft: SMITH AEROSTAR 601 (Category: Land, Engines: 2, Seats: 6, Weight: Up to 12,499 Pounds, Speed: 186 mph), Engine: LYCOMING IO-540-S1A5 (300 HP) (Reciprocating)
N-Number: 567LT, N567LT, N-567LT, Serial Number: 61-0053-102, Year manufactured: 1970, Airworthiness Date: 12/04/2007, Certificate Issue Date: 08/08/2007
Registrant (Individual): H Lee Iii Townsend, 802 Brunswick Ave, Emporia, VA 23847 - Aircraft: CESSNA 650 (Category: Land, Engines: 2, Seats: 12, Weight: 12,500 - 19,999 Pounds), Engine: GARRETT TFE731 SERIES (3500 Pounds of Thrust) (Turbo-fan)
N-Number: 119ES, N119ES, N-119ES, Serial Number: 650-0206, Year manufactured: 1990, Airworthiness Date: 03/14/1994, Certificate Issue Date: 02/12/2007
Registrant (Corporation): Elliott Sadler Enterprises Inc, Po Box 32, Emporia, VA 23847 - Aircraft: PIPER PA-22-150 (Category: Land, Seats: 4, Weight: Up to 12,499 Pounds, Speed: 94 mph), Engine: LYCOMING 0-320 SERIES (180 HP) (Reciprocating)
N-Number: 6811B, N6811B, N-6811B, Serial Number: 22-4106, Certificate Issue Date: 05/06/1966
Registrant (Individual): Frank Indv Stuck, Arpt, Emporia, VA 00000
Deregistered: Cancel Date: 08/28/2018
2002 - 2018 National Fire Incident Reporting System (NFIRS) incidents
- Fire incident types reported to NFIRS in Emporia, VA
- 37239.4%Structure Fires
- 35437.5%Outside Fires
- 20121.3%Mobile Property/Vehicle Fires
- 171.8%Other
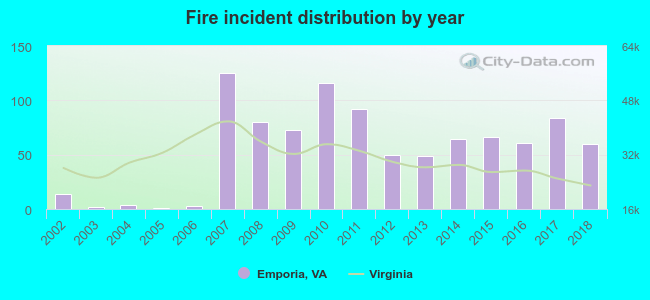 Based on the data from the years 2002 - 2018 the average number of fire incidents per year is 56. The highest number of fire incidents - 125 took place in 2007, and the least - 1 in 2005. The data has an increasing trend.
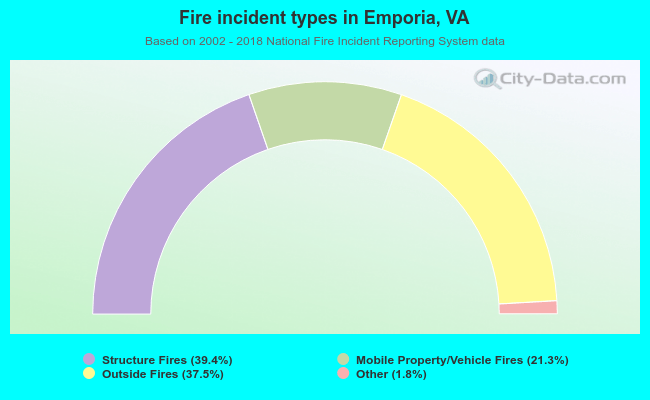 When looking into fire subcategories, the most incidents belonged to: Structure Fires (39.4%), and Outside Fires (37.5%).
Fire-safe hotels and motels in Emporia, Virginia:
- RedRoof Inn, 1207 W Atlantic St, Emporia, Virginia 23847 , Phone: (434) 348-8888, Fax: (434) 336-0007
- Hampton Inn, 898 Wiggins Rd, Emporia, Virginia 23847 , Phone: (434) 634-9200, Fax: (434) 348-0071
- Days Inn Emporia, 921 W Atlantic St, Emporia, Virginia 23847 , Phone: (434) 634-9481, Fax: (434) 348-0746
- Sleep Inn Hotel Emporia, 899 Wiggins Rd, Emporia, Virginia 23847 , Phone: (434) 348-3900, Fax: (434) 348-3911
- Country Inn & Suites By Carlson Emporia, Va, 107 Sadler Ln, Emporia, Virginia 23847 , Phone: (434) 336-0001, Fax: (434) 336-1330
- Emporia Inn, 311 Florida Ave, Emporia, Virginia 23847 , Phone: (434) 634-4191, Fax: (434) 634-2444
- Best Western Emporia, 1100 W Atlantic St, Emporia, Virginia 23847 , Phone: (434) 634-3200, Fax: (434) 634-5459
- Super 8, 1411 Skippers Rd, Emporia, Virginia 23847 , Phone: (434) 348-3282, Fax: (434) 348-3282
| Most common first names in Emporia, VA among deceased individuals | ||
| Name | Count | Lived (average) |
|---|---|---|
| James | 176 | 70.6 years |
| Mary | 174 | 79.6 years |
| William | 154 | 73.6 years |
| Robert | 118 | 70.3 years |
| John | 113 | 73.2 years |
| Willie | 88 | 73.3 years |
| George | 79 | 72.4 years |
| Virginia | 72 | 76.4 years |
| Joseph | 66 | 72.8 years |
| Thomas | 60 | 72.5 years |
| Most common last names in Emporia, VA among deceased individuals | ||
| Last name | Count | Lived (average) |
|---|---|---|
| Williams | 121 | 74.5 years |
| Jones | 116 | 72.5 years |
| Allen | 86 | 75.2 years |
| Moore | 74 | 72.8 years |
| Taylor | 65 | 75.2 years |
| Robinson | 63 | 75.1 years |
| Powell | 63 | 71.3 years |
| Smith | 59 | 74.4 years |
| Easter | 58 | 72.5 years |
| Turner | 51 | 73.0 years |
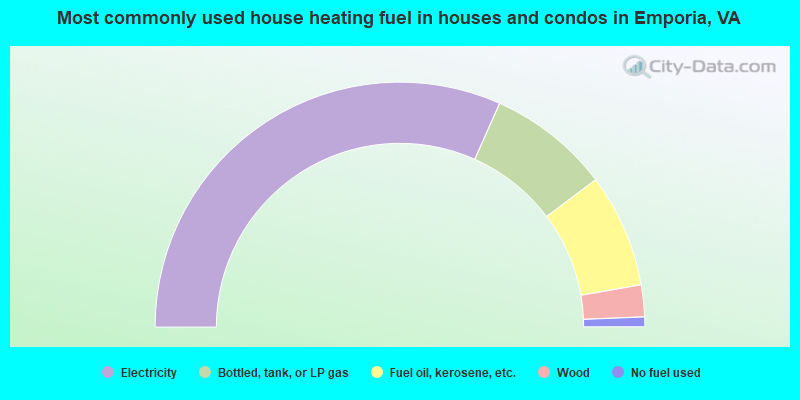
- 63.3%Electricity
- 16.1%Bottled, tank, or LP gas
- 15.0%Fuel oil, kerosene, etc.
- 4.2%Wood
- 1.3%No fuel used
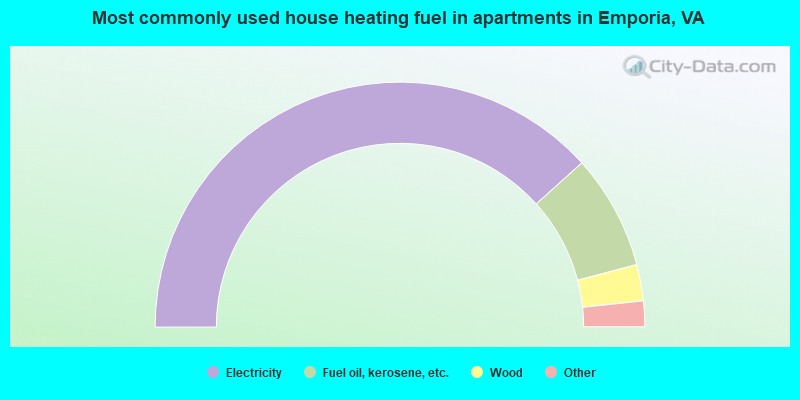
- 76.7%Electricity
- 15.2%Fuel oil, kerosene, etc.
- 4.8%Wood
- 2.2%Bottled, tank, or LP gas
- 1.1%Utility gas
Emporia compared to Virginia state average:
- Median household income below state average.
- Median house value significantly below state average.
- Unemployed percentage below state average.
- Black race population percentage significantly above state average.
- Hispanic race population percentage below state average.
- Foreign-born population percentage significantly below state average.
- Renting percentage above state average.
- Length of stay since moving in significantly above state average.
- House age above state average.
- Institutionalized population percentage above state average.
- Number of college students significantly below state average.
- Percentage of population with a bachelor's degree or higher below state average.
Emporia on our top lists:
- #23 on the list of "Top 101 cities with the most full-time financial administration workers per 1000 residents (population 5,000+)"
- #56 on the list of "Top 101 cities with the highest number of police officers per 1000 residents (population 5,000+)"
- #57 on the list of "Top 101 cities with largest percentage of females in occupations: health technologists and technicians (population 5,000+)"
- #77 on the list of "Top 101 cities with largest percentage of females in occupations: law enforcement workers including supervisors (population 5,000+)"
- #85 on the list of "Top 101 cities with largest percentage of males in occupations: law enforcement workers including supervisors (population 5,000+)"
- #90 on the list of "Top 101 cities with the lowest cost per building permit(population 5,000+)"
- #93 on the list of "Top 101 cities with largest percentage of males in industries: other services, except public administration (population 5,000+)"