East Los Angeles, California Submit your own pictures of this place and show them to the world
OSM Map
General Map
Google Map
MSN Map
OSM Map
General Map
Google Map
MSN Map
OSM Map
General Map
Google Map
MSN Map
OSM Map
General Map
Google Map
MSN Map
Please wait while loading the map...
Population in 2022: 112,965 (100% urban, 0% rural). Population change since 2000: -9.1%Males: 58,415 Females: 54,550
March 2022 cost of living index in East Los Angeles: 142.2 (very high, U.S. average is 100) Percentage of residents living in poverty in 2022: 19.3%for White Non-Hispanic residents , 9.0% for Black residents , 19.2% for Hispanic or Latino residents , 18.8% for American Indian residents , 16.9% for Native Hawaiian and other Pacific Islander residents , 21.7% for other race residents , 10.9% for two or more races residents )Business Search - 14 Million verified businesses
Data:
Median household income ($)
Median household income (% change since 2000)
Household income diversity
Ratio of average income to average house value (%)
Ratio of average income to average rent
Median household income ($) - White
Median household income ($) - Black or African American
Median household income ($) - Asian
Median household income ($) - Hispanic or Latino
Median household income ($) - American Indian and Alaska Native
Median household income ($) - Multirace
Median household income ($) - Other Race
Median household income for houses/condos with a mortgage ($)
Median household income for apartments without a mortgage ($)
Races - White alone (%)
Races - White alone (% change since 2000)
Races - Black alone (%)
Races - Black alone (% change since 2000)
Races - American Indian alone (%)
Races - American Indian alone (% change since 2000)
Races - Asian alone (%)
Races - Asian alone (% change since 2000)
Races - Hispanic (%)
Races - Hispanic (% change since 2000)
Races - Native Hawaiian and Other Pacific Islander alone (%)
Races - Native Hawaiian and Other Pacific Islander alone (% change since 2000)
Races - Two or more races (%)
Races - Two or more races (% change since 2000)
Races - Other race alone (%)
Races - Other race alone (% change since 2000)
Racial diversity
Unemployment (%)
Unemployment (% change since 2000)
Unemployment (%) - White
Unemployment (%) - Black or African American
Unemployment (%) - Asian
Unemployment (%) - Hispanic or Latino
Unemployment (%) - American Indian and Alaska Native
Unemployment (%) - Multirace
Unemployment (%) - Other Race
Population density (people per square mile)
Population - Males (%)
Population - Females (%)
Population - Males (%) - White
Population - Males (%) - Black or African American
Population - Males (%) - Asian
Population - Males (%) - Hispanic or Latino
Population - Males (%) - American Indian and Alaska Native
Population - Males (%) - Multirace
Population - Males (%) - Other Race
Population - Females (%) - White
Population - Females (%) - Black or African American
Population - Females (%) - Asian
Population - Females (%) - Hispanic or Latino
Population - Females (%) - American Indian and Alaska Native
Population - Females (%) - Multirace
Population - Females (%) - Other Race
Coronavirus confirmed cases (Apr 19, 2024)
Deaths caused by coronavirus (Apr 19, 2024)
Coronavirus confirmed cases (per 100k population) (Apr 19, 2024)
Deaths caused by coronavirus (per 100k population) (Apr 19, 2024)
Daily increase in number of cases (Apr 19, 2024)
Weekly increase in number of cases (Apr 19, 2024)
Cases doubled (in days) (Apr 19, 2024)
Hospitalized patients (Apr 18, 2022)
Negative test results (Apr 18, 2022)
Total test results (Apr 18, 2022)
COVID Vaccine doses distributed (per 100k population) (Sep 19, 2023)
COVID Vaccine doses administered (per 100k population) (Sep 19, 2023)
COVID Vaccine doses distributed (Sep 19, 2023)
COVID Vaccine doses administered (Sep 19, 2023)
Likely homosexual households (%)
Likely homosexual households (% change since 2000)
Likely homosexual households - Lesbian couples (%)
Likely homosexual households - Lesbian couples (% change since 2000)
Likely homosexual households - Gay men (%)
Likely homosexual households - Gay men (% change since 2000)
Cost of living index
Median gross rent ($)
Median contract rent ($)
Median monthly housing costs ($)
Median house or condo value ($)
Median house or condo value ($ change since 2000)
Mean house or condo value by units in structure - 1, detached ($)
Mean house or condo value by units in structure - 1, attached ($)
Mean house or condo value by units in structure - 2 ($)
Mean house or condo value by units in structure by units in structure - 3 or 4 ($)
Mean house or condo value by units in structure - 5 or more ($)
Mean house or condo value by units in structure - Boat, RV, van, etc. ($)
Mean house or condo value by units in structure - Mobile home ($)
Median house or condo value ($) - White
Median house or condo value ($) - Black or African American
Median house or condo value ($) - Asian
Median house or condo value ($) - Hispanic or Latino
Median house or condo value ($) - American Indian and Alaska Native
Median house or condo value ($) - Multirace
Median house or condo value ($) - Other Race
Median resident age
Resident age diversity
Median resident age - Males
Median resident age - Females
Median resident age - White
Median resident age - Black or African American
Median resident age - Asian
Median resident age - Hispanic or Latino
Median resident age - American Indian and Alaska Native
Median resident age - Multirace
Median resident age - Other Race
Median resident age - Males - White
Median resident age - Males - Black or African American
Median resident age - Males - Asian
Median resident age - Males - Hispanic or Latino
Median resident age - Males - American Indian and Alaska Native
Median resident age - Males - Multirace
Median resident age - Males - Other Race
Median resident age - Females - White
Median resident age - Females - Black or African American
Median resident age - Females - Asian
Median resident age - Females - Hispanic or Latino
Median resident age - Females - American Indian and Alaska Native
Median resident age - Females - Multirace
Median resident age - Females - Other Race
Commute - mean travel time to work (minutes)
Travel time to work - Less than 5 minutes (%)
Travel time to work - Less than 5 minutes (% change since 2000)
Travel time to work - 5 to 9 minutes (%)
Travel time to work - 5 to 9 minutes (% change since 2000)
Travel time to work - 10 to 19 minutes (%)
Travel time to work - 10 to 19 minutes (% change since 2000)
Travel time to work - 20 to 29 minutes (%)
Travel time to work - 20 to 29 minutes (% change since 2000)
Travel time to work - 30 to 39 minutes (%)
Travel time to work - 30 to 39 minutes (% change since 2000)
Travel time to work - 40 to 59 minutes (%)
Travel time to work - 40 to 59 minutes (% change since 2000)
Travel time to work - 60 to 89 minutes (%)
Travel time to work - 60 to 89 minutes (% change since 2000)
Travel time to work - 90 or more minutes (%)
Travel time to work - 90 or more minutes (% change since 2000)
Marital status - Never married (%)
Marital status - Now married (%)
Marital status - Separated (%)
Marital status - Widowed (%)
Marital status - Divorced (%)
Median family income ($)
Median family income (% change since 2000)
Median non-family income ($)
Median non-family income (% change since 2000)
Median per capita income ($)
Median per capita income (% change since 2000)
Median family income ($) - White
Median family income ($) - Black or African American
Median family income ($) - Asian
Median family income ($) - Hispanic or Latino
Median family income ($) - American Indian and Alaska Native
Median family income ($) - Multirace
Median family income ($) - Other Race
Median year house/condo built
Median year apartment built
Year house built - Built 2005 or later (%)
Year house built - Built 2000 to 2004 (%)
Year house built - Built 1990 to 1999 (%)
Year house built - Built 1980 to 1989 (%)
Year house built - Built 1970 to 1979 (%)
Year house built - Built 1960 to 1969 (%)
Year house built - Built 1950 to 1959 (%)
Year house built - Built 1940 to 1949 (%)
Year house built - Built 1939 or earlier (%)
Average household size
Household density (households per square mile)
Average household size - White
Average household size - Black or African American
Average household size - Asian
Average household size - Hispanic or Latino
Average household size - American Indian and Alaska Native
Average household size - Multirace
Average household size - Other Race
Occupied housing units (%)
Vacant housing units (%)
Owner occupied housing units (%)
Renter occupied housing units (%)
Vacancy status - For rent (%)
Vacancy status - For sale only (%)
Vacancy status - Rented or sold, not occupied (%)
Vacancy status - For seasonal, recreational, or occasional use (%)
Vacancy status - For migrant workers (%)
Vacancy status - Other vacant (%)
Residents with income below the poverty level (%)
Residents with income below 50% of the poverty level (%)
Children below poverty level (%)
Poor families by family type - Married-couple family (%)
Poor families by family type - Male, no wife present (%)
Poor families by family type - Female, no husband present (%)
Poverty status for native-born residents (%)
Poverty status for foreign-born residents (%)
Poverty among high school graduates not in families (%)
Poverty among people who did not graduate high school not in families (%)
Residents with income below the poverty level (%) - White
Residents with income below the poverty level (%) - Black or African American
Residents with income below the poverty level (%) - Asian
Residents with income below the poverty level (%) - Hispanic or Latino
Residents with income below the poverty level (%) - American Indian and Alaska Native
Residents with income below the poverty level (%) - Multirace
Residents with income below the poverty level (%) - Other Race
Air pollution - Air Quality Index (AQI)
Air pollution - CO
Air pollution - NO2
Air pollution - SO2
Air pollution - Ozone
Air pollution - PM10
Air pollution - PM25
Air pollution - Pb
Crime - Murders per 100,000 population
Crime - Rapes per 100,000 population
Crime - Robberies per 100,000 population
Crime - Assaults per 100,000 population
Crime - Burglaries per 100,000 population
Crime - Thefts per 100,000 population
Crime - Auto thefts per 100,000 population
Crime - Arson per 100,000 population
Crime - City-data.com crime index
Crime - Violent crime index
Crime - Property crime index
Crime - Murders per 100,000 population (5 year average)
Crime - Rapes per 100,000 population (5 year average)
Crime - Robberies per 100,000 population (5 year average)
Crime - Assaults per 100,000 population (5 year average)
Crime - Burglaries per 100,000 population (5 year average)
Crime - Thefts per 100,000 population (5 year average)
Crime - Auto thefts per 100,000 population (5 year average)
Crime - Arson per 100,000 population (5 year average)
Crime - City-data.com crime index (5 year average)
Crime - Violent crime index (5 year average)
Crime - Property crime index (5 year average)
1996 Presidential Elections Results (%) - Democratic Party (Clinton)
1996 Presidential Elections Results (%) - Republican Party (Dole)
1996 Presidential Elections Results (%) - Other
2000 Presidential Elections Results (%) - Democratic Party (Gore)
2000 Presidential Elections Results (%) - Republican Party (Bush)
2000 Presidential Elections Results (%) - Other
2004 Presidential Elections Results (%) - Democratic Party (Kerry)
2004 Presidential Elections Results (%) - Republican Party (Bush)
2004 Presidential Elections Results (%) - Other
2008 Presidential Elections Results (%) - Democratic Party (Obama)
2008 Presidential Elections Results (%) - Republican Party (McCain)
2008 Presidential Elections Results (%) - Other
2012 Presidential Elections Results (%) - Democratic Party (Obama)
2012 Presidential Elections Results (%) - Republican Party (Romney)
2012 Presidential Elections Results (%) - Other
2016 Presidential Elections Results (%) - Democratic Party (Clinton)
2016 Presidential Elections Results (%) - Republican Party (Trump)
2016 Presidential Elections Results (%) - Other
2020 Presidential Elections Results (%) - Democratic Party (Biden)
2020 Presidential Elections Results (%) - Republican Party (Trump)
2020 Presidential Elections Results (%) - Other
Ancestries Reported - Arab (%)
Ancestries Reported - Czech (%)
Ancestries Reported - Danish (%)
Ancestries Reported - Dutch (%)
Ancestries Reported - English (%)
Ancestries Reported - French (%)
Ancestries Reported - French Canadian (%)
Ancestries Reported - German (%)
Ancestries Reported - Greek (%)
Ancestries Reported - Hungarian (%)
Ancestries Reported - Irish (%)
Ancestries Reported - Italian (%)
Ancestries Reported - Lithuanian (%)
Ancestries Reported - Norwegian (%)
Ancestries Reported - Polish (%)
Ancestries Reported - Portuguese (%)
Ancestries Reported - Russian (%)
Ancestries Reported - Scotch-Irish (%)
Ancestries Reported - Scottish (%)
Ancestries Reported - Slovak (%)
Ancestries Reported - Subsaharan African (%)
Ancestries Reported - Swedish (%)
Ancestries Reported - Swiss (%)
Ancestries Reported - Ukrainian (%)
Ancestries Reported - United States (%)
Ancestries Reported - Welsh (%)
Ancestries Reported - West Indian (%)
Ancestries Reported - Other (%)
Educational Attainment - No schooling completed (%)
Educational Attainment - Less than high school (%)
Educational Attainment - High school or equivalent (%)
Educational Attainment - Less than 1 year of college (%)
Educational Attainment - 1 or more years of college (%)
Educational Attainment - Associate degree (%)
Educational Attainment - Bachelor's degree (%)
Educational Attainment - Master's degree (%)
Educational Attainment - Professional school degree (%)
Educational Attainment - Doctorate degree (%)
School Enrollment - Nursery, preschool (%)
School Enrollment - Kindergarten (%)
School Enrollment - Grade 1 to 4 (%)
School Enrollment - Grade 5 to 8 (%)
School Enrollment - Grade 9 to 12 (%)
School Enrollment - College undergrad (%)
School Enrollment - Graduate or professional (%)
School Enrollment - Not enrolled in school (%)
School enrollment - Public schools (%)
School enrollment - Private schools (%)
School enrollment - Not enrolled (%)
Median number of rooms in houses and condos
Median number of rooms in apartments
Housing units lacking complete plumbing facilities (%)
Housing units lacking complete kitchen facilities (%)
Density of houses
Urban houses (%)
Rural houses (%)
Households with people 60 years and over (%)
Households with people 65 years and over (%)
Households with people 75 years and over (%)
Households with one or more nonrelatives (%)
Households with no nonrelatives (%)
Population in households (%)
Family households (%)
Nonfamily households (%)
Population in families (%)
Family households with own children (%)
Median number of bedrooms in owner occupied houses
Mean number of bedrooms in owner occupied houses
Median number of bedrooms in renter occupied houses
Mean number of bedrooms in renter occupied houses
Median number of vehichles in owner occupied houses
Mean number of vehichles in owner occupied houses
Median number of vehichles in renter occupied houses
Mean number of vehichles in renter occupied houses
Mortgage status - with mortgage (%)
Mortgage status - with second mortgage (%)
Mortgage status - with home equity loan (%)
Mortgage status - with both second mortgage and home equity loan (%)
Mortgage status - without a mortgage (%)
Average family size
Average family size - White
Average family size - Black or African American
Average family size - Asian
Average family size - Hispanic or Latino
Average family size - American Indian and Alaska Native
Average family size - Multirace
Average family size - Other Race
Geographical mobility - Same house 1 year ago (%)
Geographical mobility - Moved within same county (%)
Geographical mobility - Moved from different county within same state (%)
Geographical mobility - Moved from different state (%)
Geographical mobility - Moved from abroad (%)
Place of birth - Born in state of residence (%)
Place of birth - Born in other state (%)
Place of birth - Native, outside of US (%)
Place of birth - Foreign born (%)
Housing units in structures - 1, detached (%)
Housing units in structures - 1, attached (%)
Housing units in structures - 2 (%)
Housing units in structures - 3 or 4 (%)
Housing units in structures - 5 to 9 (%)
Housing units in structures - 10 to 19 (%)
Housing units in structures - 20 to 49 (%)
Housing units in structures - 50 or more (%)
Housing units in structures - Mobile home (%)
Housing units in structures - Boat, RV, van, etc. (%)
House/condo owner moved in on average (years ago)
Renter moved in on average (years ago)
Year householder moved into unit - Moved in 1999 to March 2000 (%)
Year householder moved into unit - Moved in 1995 to 1998 (%)
Year householder moved into unit - Moved in 1990 to 1994 (%)
Year householder moved into unit - Moved in 1980 to 1989 (%)
Year householder moved into unit - Moved in 1970 to 1979 (%)
Year householder moved into unit - Moved in 1969 or earlier (%)
Means of transportation to work - Drove car alone (%)
Means of transportation to work - Carpooled (%)
Means of transportation to work - Public transportation (%)
Means of transportation to work - Bus or trolley bus (%)
Means of transportation to work - Streetcar or trolley car (%)
Means of transportation to work - Subway or elevated (%)
Means of transportation to work - Railroad (%)
Means of transportation to work - Ferryboat (%)
Means of transportation to work - Taxicab (%)
Means of transportation to work - Motorcycle (%)
Means of transportation to work - Bicycle (%)
Means of transportation to work - Walked (%)
Means of transportation to work - Other means (%)
Working at home (%)
Industry diversity
Most Common Industries - Agriculture, forestry, fishing and hunting, and mining (%)
Most Common Industries - Agriculture, forestry, fishing and hunting (%)
Most Common Industries - Mining, quarrying, and oil and gas extraction (%)
Most Common Industries - Construction (%)
Most Common Industries - Manufacturing (%)
Most Common Industries - Wholesale trade (%)
Most Common Industries - Retail trade (%)
Most Common Industries - Transportation and warehousing, and utilities (%)
Most Common Industries - Transportation and warehousing (%)
Most Common Industries - Utilities (%)
Most Common Industries - Information (%)
Most Common Industries - Finance and insurance, and real estate and rental and leasing (%)
Most Common Industries - Finance and insurance (%)
Most Common Industries - Real estate and rental and leasing (%)
Most Common Industries - Professional, scientific, and management, and administrative and waste management services (%)
Most Common Industries - Professional, scientific, and technical services (%)
Most Common Industries - Management of companies and enterprises (%)
Most Common Industries - Administrative and support and waste management services (%)
Most Common Industries - Educational services, and health care and social assistance (%)
Most Common Industries - Educational services (%)
Most Common Industries - Health care and social assistance (%)
Most Common Industries - Arts, entertainment, and recreation, and accommodation and food services (%)
Most Common Industries - Arts, entertainment, and recreation (%)
Most Common Industries - Accommodation and food services (%)
Most Common Industries - Other services, except public administration (%)
Most Common Industries - Public administration (%)
Occupation diversity
Most Common Occupations - Management, business, science, and arts occupations (%)
Most Common Occupations - Management, business, and financial occupations (%)
Most Common Occupations - Management occupations (%)
Most Common Occupations - Business and financial operations occupations (%)
Most Common Occupations - Computer, engineering, and science occupations (%)
Most Common Occupations - Computer and mathematical occupations (%)
Most Common Occupations - Architecture and engineering occupations (%)
Most Common Occupations - Life, physical, and social science occupations (%)
Most Common Occupations - Education, legal, community service, arts, and media occupations (%)
Most Common Occupations - Community and social service occupations (%)
Most Common Occupations - Legal occupations (%)
Most Common Occupations - Education, training, and library occupations (%)
Most Common Occupations - Arts, design, entertainment, sports, and media occupations (%)
Most Common Occupations - Healthcare practitioners and technical occupations (%)
Most Common Occupations - Health diagnosing and treating practitioners and other technical occupations (%)
Most Common Occupations - Health technologists and technicians (%)
Most Common Occupations - Service occupations (%)
Most Common Occupations - Healthcare support occupations (%)
Most Common Occupations - Protective service occupations (%)
Most Common Occupations - Fire fighting and prevention, and other protective service workers including supervisors (%)
Most Common Occupations - Law enforcement workers including supervisors (%)
Most Common Occupations - Food preparation and serving related occupations (%)
Most Common Occupations - Building and grounds cleaning and maintenance occupations (%)
Most Common Occupations - Personal care and service occupations (%)
Most Common Occupations - Sales and office occupations (%)
Most Common Occupations - Sales and related occupations (%)
Most Common Occupations - Office and administrative support occupations (%)
Most Common Occupations - Natural resources, construction, and maintenance occupations (%)
Most Common Occupations - Farming, fishing, and forestry occupations (%)
Most Common Occupations - Construction and extraction occupations (%)
Most Common Occupations - Installation, maintenance, and repair occupations (%)
Most Common Occupations - Production, transportation, and material moving occupations (%)
Most Common Occupations - Production occupations (%)
Most Common Occupations - Transportation occupations (%)
Most Common Occupations - Material moving occupations (%)
People in Group quarters - Institutionalized population (%)
People in Group quarters - Correctional institutions (%)
People in Group quarters - Federal prisons and detention centers (%)
People in Group quarters - Halfway houses (%)
People in Group quarters - Local jails and other confinement facilities (including police lockups) (%)
People in Group quarters - Military disciplinary barracks (%)
People in Group quarters - State prisons (%)
People in Group quarters - Other types of correctional institutions (%)
People in Group quarters - Nursing homes (%)
People in Group quarters - Hospitals/wards, hospices, and schools for the handicapped (%)
People in Group quarters - Hospitals/wards and hospices for chronically ill (%)
People in Group quarters - Hospices or homes for chronically ill (%)
People in Group quarters - Military hospitals or wards for chronically ill (%)
People in Group quarters - Other hospitals or wards for chronically ill (%)
People in Group quarters - Hospitals or wards for drug/alcohol abuse (%)
People in Group quarters - Mental (Psychiatric) hospitals or wards (%)
People in Group quarters - Schools, hospitals, or wards for the mentally retarded (%)
People in Group quarters - Schools, hospitals, or wards for the physically handicapped (%)
People in Group quarters - Institutions for the deaf (%)
People in Group quarters - Institutions for the blind (%)
People in Group quarters - Orthopedic wards and institutions for the physically handicapped (%)
People in Group quarters - Wards in general hospitals for patients who have no usual home elsewhere (%)
People in Group quarters - Wards in military hospitals for patients who have no usual home elsewhere (%)
People in Group quarters - Juvenile institutions (%)
People in Group quarters - Long-term care (%)
People in Group quarters - Homes for abused, dependent, and neglected children (%)
People in Group quarters - Residential treatment centers for emotionally disturbed children (%)
People in Group quarters - Training schools for juvenile delinquents (%)
People in Group quarters - Short-term care, detention or diagnostic centers for delinquent children (%)
People in Group quarters - Type of juvenile institution unknown (%)
People in Group quarters - Noninstitutionalized population (%)
People in Group quarters - College dormitories (includes college quarters off campus) (%)
People in Group quarters - Military quarters (%)
People in Group quarters - On base (%)
People in Group quarters - Barracks, unaccompanied personnel housing (UPH), (Enlisted/Officer), ;and similar group living quarters for military personnel (%)
People in Group quarters - Transient quarters for temporary residents (%)
People in Group quarters - Military ships (%)
People in Group quarters - Group homes (%)
People in Group quarters - Homes or halfway houses for drug/alcohol abuse (%)
People in Group quarters - Homes for the mentally ill (%)
People in Group quarters - Homes for the mentally retarded (%)
People in Group quarters - Homes for the physically handicapped (%)
People in Group quarters - Other group homes (%)
People in Group quarters - Religious group quarters (%)
People in Group quarters - Dormitories (%)
People in Group quarters - Agriculture workers' dormitories on farms (%)
People in Group quarters - Job Corps and vocational training facilities (%)
People in Group quarters - Other workers' dormitories (%)
People in Group quarters - Crews of maritime vessels (%)
People in Group quarters - Other nonhousehold living situations (%)
People in Group quarters - Other noninstitutional group quarters (%)
Residents speaking English at home (%)
Residents speaking English at home - Born in the United States (%)
Residents speaking English at home - Native, born elsewhere (%)
Residents speaking English at home - Foreign born (%)
Residents speaking Spanish at home (%)
Residents speaking Spanish at home - Born in the United States (%)
Residents speaking Spanish at home - Native, born elsewhere (%)
Residents speaking Spanish at home - Foreign born (%)
Residents speaking other language at home (%)
Residents speaking other language at home - Born in the United States (%)
Residents speaking other language at home - Native, born elsewhere (%)
Residents speaking other language at home - Foreign born (%)
Class of Workers - Employee of private company (%)
Class of Workers - Self-employed in own incorporated business (%)
Class of Workers - Private not-for-profit wage and salary workers (%)
Class of Workers - Local government workers (%)
Class of Workers - State government workers (%)
Class of Workers - Federal government workers (%)
Class of Workers - Self-employed workers in own not incorporated business and Unpaid family workers (%)
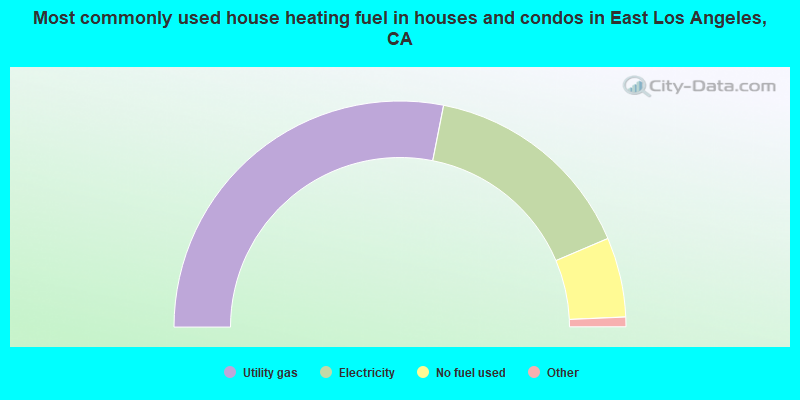
House heating fuel used in houses and condos - Utility gas (%)
House heating fuel used in houses and condos - Bottled, tank, or LP gas (%)
House heating fuel used in houses and condos - Electricity (%)
House heating fuel used in houses and condos - Fuel oil, kerosene, etc. (%)
House heating fuel used in houses and condos - Coal or coke (%)
House heating fuel used in houses and condos - Wood (%)
House heating fuel used in houses and condos - Solar energy (%)
House heating fuel used in houses and condos - Other fuel (%)
House heating fuel used in houses and condos - No fuel used (%)
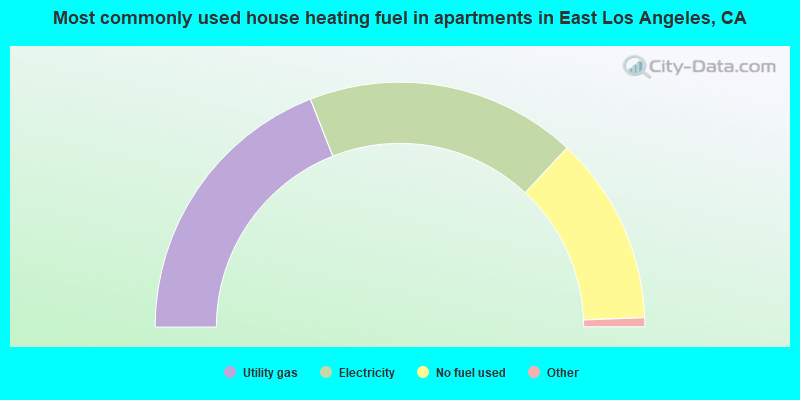
House heating fuel used in apartments - Utility gas (%)
House heating fuel used in apartments - Bottled, tank, or LP gas (%)
House heating fuel used in apartments - Electricity (%)
House heating fuel used in apartments - Fuel oil, kerosene, etc. (%)
House heating fuel used in apartments - Coal or coke (%)
House heating fuel used in apartments - Wood (%)
House heating fuel used in apartments - Solar energy (%)
House heating fuel used in apartments - Other fuel (%)
House heating fuel used in apartments - No fuel used (%)
Armed forces status - In Armed Forces (%)
Armed forces status - Civilian (%)
Armed forces status - Civilian - Veteran (%)
Armed forces status - Civilian - Nonveteran (%)
Fatal accidents locations in years 2005-2021
Fatal accidents locations in 2005
Fatal accidents locations in 2006
Fatal accidents locations in 2007
Fatal accidents locations in 2008
Fatal accidents locations in 2009
Fatal accidents locations in 2010
Fatal accidents locations in 2011
Fatal accidents locations in 2012
Fatal accidents locations in 2013
Fatal accidents locations in 2014
Fatal accidents locations in 2015
Fatal accidents locations in 2016
Fatal accidents locations in 2017
Fatal accidents locations in 2018
Fatal accidents locations in 2019
Fatal accidents locations in 2020
Fatal accidents locations in 2021
Alcohol use - People drinking some alcohol every month (%)
Alcohol use - People not drinking at all (%)
Alcohol use - Average days/month drinking alcohol
Alcohol use - Average drinks/week
Alcohol use - Average days/year people drink much
Audiometry - Average condition of hearing (%)
Audiometry - People that can hear a whisper from across a quiet room (%)
Audiometry - People that can hear normal voice from across a quiet room (%)
Audiometry - Ears ringing, roaring, buzzing (%)
Audiometry - Had a job exposure to loud noise (%)
Audiometry - Had off-work exposure to loud noise (%)
Blood Pressure & Cholesterol - Has high blood pressure (%)
Blood Pressure & Cholesterol - Checking blood pressure at home (%)
Blood Pressure & Cholesterol - Frequently checking blood cholesterol (%)
Blood Pressure & Cholesterol - Has high cholesterol level (%)
Consumer Behavior - Money monthly spent on food at supermarket/grocery store
Consumer Behavior - Money monthly spent on food at other stores
Consumer Behavior - Money monthly spent on eating out
Consumer Behavior - Money monthly spent on carryout/delivered foods
Consumer Behavior - Income spent on food at supermarket/grocery store (%)
Consumer Behavior - Income spent on food at other stores (%)
Consumer Behavior - Income spent on eating out (%)
Consumer Behavior - Income spent on carryout/delivered foods (%)
Current Health Status - General health condition (%)
Current Health Status - Blood donors (%)
Current Health Status - Has blood ever tested for HIV virus (%)
Current Health Status - Left-handed people (%)
Dermatology - People using sunscreen (%)
Diabetes - Diabetics (%)
Diabetes - Had a blood test for high blood sugar (%)
Diabetes - People taking insulin (%)
Diet Behavior & Nutrition - Diet health (%)
Diet Behavior & Nutrition - Milk product consumption (# of products/month)
Diet Behavior & Nutrition - Meals not home prepared (#/week)
Diet Behavior & Nutrition - Meals from fast food or pizza place (#/week)
Diet Behavior & Nutrition - Ready-to-eat foods (#/month)
Diet Behavior & Nutrition - Frozen meals/pizza (#/month)
Drug Use - People that ever used marijuana or hashish (%)
Drug Use - Ever used hard drugs (%)
Drug Use - Ever used any form of cocaine (%)
Drug Use - Ever used heroin (%)
Drug Use - Ever used methamphetamine (%)
Health Insurance - People covered by health insurance (%)
Kidney Conditions-Urology - Avg. # of times urinating at night
Medical Conditions - People with asthma (%)
Medical Conditions - People with anemia (%)
Medical Conditions - People with psoriasis (%)
Medical Conditions - People with overweight (%)
Medical Conditions - Elderly people having difficulties in thinking or remembering (%)
Medical Conditions - People who ever received blood transfusion (%)
Medical Conditions - People having trouble seeing even with glass/contacts (%)
Medical Conditions - People with arthritis (%)
Medical Conditions - People with gout (%)
Medical Conditions - People with congestive heart failure (%)
Medical Conditions - People with coronary heart disease (%)
Medical Conditions - People with angina pectoris (%)
Medical Conditions - People who ever had heart attack (%)
Medical Conditions - People who ever had stroke (%)
Medical Conditions - People with emphysema (%)
Medical Conditions - People with thyroid problem (%)
Medical Conditions - People with chronic bronchitis (%)
Medical Conditions - People with any liver condition (%)
Medical Conditions - People who ever had cancer or malignancy (%)
Mental Health - People who have little interest in doing things (%)
Mental Health - People feeling down, depressed, or hopeless (%)
Mental Health - People who have trouble sleeping or sleeping too much (%)
Mental Health - People feeling tired or having little energy (%)
Mental Health - People with poor appetite or overeating (%)
Mental Health - People feeling bad about themself (%)
Mental Health - People who have trouble concentrating on things (%)
Mental Health - People moving or speaking slowly or too fast (%)
Mental Health - People having thoughts they would be better off dead (%)
Oral Health - Average years since last visit a dentist
Oral Health - People embarrassed because of mouth (%)
Oral Health - People with gum disease (%)
Oral Health - General health of teeth and gums (%)
Oral Health - Average days a week using dental floss/device
Oral Health - Average days a week using mouthwash for dental problem
Oral Health - Average number of teeth
Pesticide Use - Households using pesticides to control insects (%)
Pesticide Use - Households using pesticides to kill weeds (%)
Physical Activity - People doing vigorous-intensity work activities (%)
Physical Activity - People doing moderate-intensity work activities (%)
Physical Activity - People walking or bicycling (%)
Physical Activity - People doing vigorous-intensity recreational activities (%)
Physical Activity - People doing moderate-intensity recreational activities (%)
Physical Activity - Average hours a day doing sedentary activities
Physical Activity - Average hours a day watching TV or videos
Physical Activity - Average hours a day using computer
Physical Functioning - People having limitations keeping them from working (%)
Physical Functioning - People limited in amount of work they can do (%)
Physical Functioning - People that need special equipment to walk (%)
Physical Functioning - People experiencing confusion/memory problems (%)
Physical Functioning - People requiring special healthcare equipment (%)
Prescription Medications - Average number of prescription medicines taking
Preventive Aspirin Use - Adults 40+ taking low-dose aspirin (%)
Reproductive Health - Vaginal deliveries (%)
Reproductive Health - Cesarean deliveries (%)
Reproductive Health - Deliveries resulted in a live birth (%)
Reproductive Health - Pregnancies resulted in a delivery (%)
Reproductive Health - Women breastfeeding newborns (%)
Reproductive Health - Women that had a hysterectomy (%)
Reproductive Health - Women that had both ovaries removed (%)
Reproductive Health - Women that have ever taken birth control pills (%)
Reproductive Health - Women taking birth control pills (%)
Reproductive Health - Women that have ever used Depo-Provera or injectables (%)
Reproductive Health - Women that have ever used female hormones (%)
Sexual Behavior - People 18+ that ever had sex (vaginal, anal, or oral) (%)
Sexual Behavior - Males 18+ that ever had vaginal sex with a woman (%)
Sexual Behavior - Males 18+ that ever performed oral sex on a woman (%)
Sexual Behavior - Males 18+ that ever had anal sex with a woman (%)
Sexual Behavior - Males 18+ that ever had any sex with a man (%)
Sexual Behavior - Females 18+ that ever had vaginal sex with a man (%)
Sexual Behavior - Females 18+ that ever performed oral sex on a man (%)
Sexual Behavior - Females 18+ that ever had anal sex with a man (%)
Sexual Behavior - Females 18+ that ever had any kind of sex with a woman (%)
Sexual Behavior - Average age people first had sex
Sexual Behavior - Average number of female sex partners in lifetime (males 18+)
Sexual Behavior - Average number of female vaginal sex partners in lifetime (males 18+)
Sexual Behavior - Average age people first performed oral sex on a woman (18+)
Sexual Behavior - Average number of woman performed oral sex on in lifetime (18+)
Sexual Behavior - Average number of male sex partners in lifetime (males 18+)
Sexual Behavior - Average number of male anal sex partners in lifetime (males 18+)
Sexual Behavior - Average age people first performed oral sex on a man (18+)
Sexual Behavior - Average number of male oral sex partners in lifetime (18+)
Sexual Behavior - People using protection when performing oral sex (%)
Sexual Behavior - Average number of times people have vaginal or anal sex a year
Sexual Behavior - People having sex without condom (%)
Sexual Behavior - Average number of male sex partners in lifetime (females 18+)
Sexual Behavior - Average number of male vaginal sex partners in lifetime (females 18+)
Sexual Behavior - Average number of female sex partners in lifetime (females 18+)
Sexual Behavior - Circumcised males 18+ (%)
Sleep Disorders - Average hours sleeping at night
Sleep Disorders - People that has trouble sleeping (%)
Smoking-Cigarette Use - People smoking cigarettes (%)
Taste & Smell - People 40+ having problems with smell (%)
Taste & Smell - People 40+ having problems with taste (%)
Taste & Smell - People 40+ that ever had wisdom teeth removed (%)
Taste & Smell - People 40+ that ever had tonsils teeth removed (%)
Taste & Smell - People 40+ that ever had a loss of consciousness because of a head injury (%)
Taste & Smell - People 40+ that ever had a broken nose or other serious injury to face or skull (%)
Taste & Smell - People 40+ that ever had two or more sinus infections (%)
Weight - Average height (inches)
Weight - Average weight (pounds)
Weight - Average BMI
Weight - People that are obese (%)
Weight - People that ever were obese (%)
Weight - People trying to lose weight (%)
106,817 94.6% Hispanic 2,504 2.2% White alone 1,608 1.4% Asian alone 772 0.7% Other race alone 555 0.5% American Indian alone 325 0.3% Black alone 223 0.2% Two or more races 161 0.1% Native Hawaiian and Other
Latest news from East Los Angeles, CA collected exclusively by city-data.com from local newspapers, TV, and radio stations
Current Local Time:
Land area: 7.44 square miles.
Population density: 15,177 people per square mile (very high).
44,330 residents are foreign born (37.7% Latin America ).
This place:
38.7%California:
26.5%
Median real estate property taxes paid for housing units with mortgages in 2022: $4,068 (0.6%)Median real estate property taxes paid for housing units with no mortgage in 2022: $3,225 (0.5%)
Nearest city with pop. 200,000+: Southwest San Gabriel Valley, CA (3.8 miles
Nearest city with pop. 1,000,000+: Los Angeles, CA
Nearest cities:
Vernon, CA (1.8 miles),
Latitude: 34.03 N, Longitude: 118.17 W
Daytime population change due to commuting: -19,498 (-17.3%)Workers who live and work in this place: 8,353 (15.3%)
Property values in East Los Angeles, CA
Unemployment in December 2023:
Most common occupations in East Los Angeles, CA (%)
Both Males Females
Building and grounds cleaning and maintenance occupations (6.7%)
Laborers and material movers, hand (6.7%)
Cooks and food preparation workers (5.3%)
Other production occupations, including supervisors (5.1%)
Material recording, scheduling, dispatching, and distributing workers (4.6%)
Cashiers (4.5%)
Construction laborers (4.5%)
Laborers and material movers, hand (8.1%)
Construction laborers (7.5%)
Building and grounds cleaning and maintenance occupations (7.3%)
Driver/sales workers and truck drivers (7.0%)
Other production occupations, including supervisors (6.5%)
Material recording, scheduling, dispatching, and distributing workers (5.4%)
Cooks and food preparation workers (4.6%)
Information and record clerks, except customer service representatives (7.3%)
Supervisors and other personal care and service workers, except child care workers (6.8%)
Cashiers (6.8%)
Cooks and food preparation workers (6.4%)
Building and grounds cleaning and maintenance occupations (5.8%)
Textile, apparel, and furnishings workers (4.8%)
Laborers and material movers, hand (4.6%)
Earthquake activity:
East Los Angeles-area historical earthquake activity is significantly above California state average. It is 7025% greater than the overall U.S. average. On 7/21/1952 at 11:52:14, a magnitude 7.7 (7.7 UK, Class: Major, Intensity: VIII - XII) earthquake occurred 82.1 miles away from East Los Angeles center, causing $50,000,000 total damage On 6/28/1992 at 11:57:34, a magnitude 7.6 (6.2 MB, 7.6 MS, 7.3 MW, Depth: 0.7 mi) earthquake occurred 94.3 miles away from East Los Angeles center, causing 3 deaths ( 1 shaking deaths, 2 other deaths) and 400 injuries, causing $100,000,000 total damage and $40,000,000 insured lossesOn 10/16/1999 at 09:46:44, a magnitude 7.4 (6.3 MB, 7.4 MS, 7.2 MW, 7.3 ML) earthquake occurred 104.6 miles away from the city center On 11/4/1927 at 13:51:53, a magnitude 7.5 (7.5 UK) earthquake occurred 174.3 miles away from East Los Angeles center On 1/17/1994 at 12:30:55, a magnitude 6.8 (6.4 MB, 6.8 MS, 6.7 MW, Depth: 11.4 mi, Class: Strong, Intensity: VII - IX) earthquake occurred 24.8 miles away from the city center, causing 60 deaths ( 60 shaking deaths) and 7000 injuriesOn 4/21/1918 at 22:32:30, a magnitude 6.8 (6.8 UK) earthquake occurred 44.5 miles away from East Los Angeles center Magnitude types: body-wave magnitude (MB), local magnitude (ML), surface-wave magnitude (MS), moment magnitude (MW) Natural disasters: The number of natural disasters in Los Angeles County (57) is a lot greater than the US average (15).Major Disasters (Presidential) Declared: 27Emergencies Declared: 3Fires: 37, Floods: 16, Storms: 9, Winter Storms: 6, Landslides: 5, Mudslides: 5, Earthquakes: 3, Freeze: 1, Heavy Rain: 1, Hurricane: 1, Snow: 1, Tornado: 1, Wind: 1, Other: 1 (Note: some incidents may be assigned to more than one category). Hospitals and medical centers in East Los Angeles: DOCTORS DIALYSIS CENTER OF EAST LOS ANGELES (950 S. EASTERN AVENUE)
EAST LOS ANGELES DIALYSIS CENTER (5830 E. WHITTIER BLVD.)
FMC-DIALYSIS SERVICES OF EAST LOS ANGELES (5220 E. TELFORD STREET)
KOREAN TOWN HOME CARE, INC (3020 WILSHIRE BLVD, STE 156)
Amtrak stations near East Los Angeles: 5 miles: LOS ANGELES (800 N. ALAMEDA ST.) Services: ticket office, fully wheelchair accessible, enclosed waiting area, public restrooms, public payphones, snack bar, free short-term parking, paid long-term parking, car rental agency, taxi stand, public transit connection.
8 miles: PASADENA (150 S. ROBLES AVE.) - Bus Station Services: fully wheelchair accessible, enclosed waiting area, public restrooms, public payphones, full-service food facilities, paid short-term parking, paid long-term parking, taxi stand, public transit connection.
9 miles: GLENDALE (400 W. CERRITOS AVE.) Services: fully wheelchair accessible, public payphones, free short-term parking, free long-term parking, call for taxi service, intercity bus service, public transit connection.
Colleges/universities with over 2000 students nearest to East Los Angeles:
East Los Angeles College (about 2 miles; Monterey Park, CA ; Full-time enrollment: 17,297)
California State University-Los Angeles (about 3 miles; Los Angeles, CA ; FT enrollment: 17,545)
Marinello Schools of Beauty-Los Angeles (about 3 miles; Los Angeles, CA ; FT enrollment: 3,923)
United Education Institute-Huntington Park Campus (about 5 miles; Huntington Park, CA ; FT enrollment: 5,151)
ICDC College (about 5 miles; Huntington Park, CA ; FT enrollment: 2,621)
Fashion Institute of Design & Merchandising-Los Angeles (about 6 miles; Los Angeles, CA ; FT enrollment: 3,705)
Los Angeles Trade Technical College (about 6 miles; Los Angeles, CA ; FT enrollment: 7,421)
Notable locations in East Los Angeles: (A) , Biscailuz Center (B) , Anthony Quinn Branch County of Los Angeles Public Library (C) , El Camino Real Branch County of Los Angeles Public Library (D) , East Los Angeles Branch County of Los Angeles Public Library (E) , City Terrace Branch County of Los Angeles Public Library (F) , Plaza Community Center (G) , Leonard Stovall Home for the Aged (H) , United Serbian Benevolent Society Hall (I) , Santa Maria Neighborhood Center (J) , Eastside Boys Club (K) , East Los Angeles Sheriffs Station (L) , Cleland House of Neighborly Service (M) , Womens Club of Montebello Park (N) , Schaefer Ambulance Service (O) , PRN Medical Transportation Services Headquarters (P) , Los Angeles County Fire Department Station 1 (Q) , Los Angeles County Fire Department Station 3 (R) , Los Angeles County Fire Department Headquarters Station and Training Facility (S) . Display/hide their locations on the map
Churches in East Los Angeles include: (A) , Grace Chapel (B) , Our Lady of Lourdes Roman Catholic Church (C) , Adams Memorial Pilgrim Church (D) , Community Brethren Church (E) , Eastmont Methodist Church (F) , First Southern Baptist Church of East Los Angeles (G) , Grace United Presbyterian Church (H) , Armenian Pentecostal Church (I) . Display/hide their locations on the map
Cemeteries: (1) , Mount Zion Cemetery (2) , Beth Israel Cemetery (3) , Home of Peace Cemetery (4) , Mausoleum of the Golden West (5) , Serbian Cemetery (6) , Chinese Cemetery (7) . Display/hide their locations on the map
Parks in East Los Angeles include: (1) , Belvedere Park (2) , City Terrace Park (3) , Salazar Park (4) , Obregon Park (5) , Saybrook Park (6) , Woods Avenue Park (7) . Display/hide their locations on the map
Birthplace of: Oscar De La Hoya - Boxer, Sergio Mora - Boxer, Ricky Romero - Baseball player, Constance Marie - Actress, Frankie Gómez - Boxer, Gronk (artist) - Artist, Hector Ramirez (fighter) - Martial artist, Luis Villegas - Musician, Shawn Estrada - Boxer, Armando Dorantes - Boxer.
Los Angeles County has a predicted average indoor radon screening level between 2 and 4 pCi/L (pico curies per liter) - Moderate Potential Average household size: This place:
4.1 peopleCalifornia:
2.9 people
Percentage of family households: This place:
83.8%Whole state:
68.7%
Percentage of households with unmarried partners: This place:
8.8%Whole state:
7.2%
Likely homosexual households (counted as self-reported same-sex unmarried-partner households)
Lesbian couples: 0.4% of all households Gay men: 0.3% of all households
People in group quarters in East Los Angeles in 2010:
150 people in other noninstitutional facilities
104 people in nursing facilities/skilled-nursing facilities
31 people in mental (psychiatric) hospitals and psychiatric units in other hospitals
12 people in workers' group living quarters and job corps centers
11 people in correctional residential facilities
6 people in group homes intended for adults
6 people in residential treatment centers for adults
People in group quarters in East Los Angeles in 2000:
98 people in local jails and other confinement facilities (including police lockups)
96 people in homes for the physically handicapped
72 people in other noninstitutional group quarters
37 people in religious group quarters
27 people in other nonhousehold living situations
23 people in nursing homes
21 people in halfway houses
20 people in homes or halfway houses for drug/alcohol abuse
6 people in other types of correctional institutions
6 people in other group homes
For population 15 years and over in East Los Angeles:
Never married: 49.9%Now married: 38.2%Separated: 2.2%Widowed: 4.3%Divorced: 5.3% For population 25 years and over in East Los Angeles:
High school or higher: 53.3%Bachelor's degree or higher: 11.6%Graduate or professional degree: 3.0%Unemployed: 11.4%Mean travel time to work (commute): 27.2 minutes
Education Gini index (Inequality in education) Here:
27.1California average:
15.5
Religion statistics for East Los Angeles, CA (based on Los Angeles County data)
Religion Adherents Congregations Catholic 3,542,994 275 Evangelical Protestant 814,611 3,249 Other 451,594 1,023 Mainline Protestant 229,056 860 Black Protestant 112,338 290 Orthodox 63,517 76 None 4,604,495 -
Source: Clifford Grammich, Kirk Hadaway, Richard Houseal, Dale E.Jones, Alexei Krindatch, Richie Stanley and Richard H.Taylor. 2012. 2010 U.S.Religion Census: Religious Congregations & Membership Study. Association of Statisticians of American Religious Bodies. Jones, Dale E., et al. 2002. Congregations and Membership in the United States 2000. Nashville, TN: Glenmary Research Center. Graphs represent county-level data
Food Environment Statistics: Number of grocery stores : 2,084Los Angeles County :
2.12 / 10,000 pop.State :
2.14 / 10,000 pop.
Number of supercenters and club stores : 32This county :
0.03 / 10,000 pop.State :
0.04 / 10,000 pop.
Number of convenience stores (no gas) : 567Los Angeles County :
0.58 / 10,000 pop.California :
0.62 / 10,000 pop.
Number of convenience stores (with gas) : 1,206This county :
1.23 / 10,000 pop.State :
1.49 / 10,000 pop.
Number of full-service restaurants : 7,008Los Angeles County :
7.15 / 10,000 pop.California :
7.42 / 10,000 pop.
Adult diabetes rate : Los Angeles County :
7.5%California :
7.3%
Adult obesity rate : This county :
20.4%State :
21.3%
Low-income preschool obesity rate : Los Angeles County :
18.6%California :
17.9%
Health and Nutrition: Healthy diet rate : East Los Angeles:
45.5%California:
49.4%
Average overall health of teeth and gums : East Los Angeles:
45.6%California:
48.0%
Average BMI : This city:
28.1California:
28.1
People feeling badly about themselves : East Los Angeles:
23.7%California:
20.2%
People not drinking alcohol at all : This city:
10.3%California:
11.2%
Average hours sleeping at night : East Los Angeles:
6.8California:
6.8
Overweight people : East Los Angeles:
30.7%State:
31.5%
General health condition : This city:
52.8%California:
56.4%
Average condition of hearing : East Los Angeles:
81.5%State:
80.9%
More about Health and Nutrition of East Los Angeles, CA Residents
2.98% of this county's 2021 resident taxpayers lived in other counties in 2020 ($81,235 average adjusted gross income )
Here:
2.98%California average:
5.19%
0.01% of residents moved from foreign countries ($155 average AGI )Los Angeles County:
0.01%California average:
0.03%
Top counties from which taxpayers relocated into this county between 2020 and 2021:
4.68% of this county's 2020 resident taxpayers moved to other counties in 2021 ($97,324 average adjusted gross income )
Here:
4.68%California average:
6.14%
0.01% of residents moved to foreign countries ($196 average AGI )Los Angeles County:
0.01%California average:
0.02%
Top counties to which taxpayers relocated from this county between 2020 and 2021:
Businesses in East Los Angeles, CA
Name Count Name Count
7-Eleven 2 McDonald's 3 AT&T 1 Payless 1 GNC 1 Rite Aid 1 H&R Block 1 T-Mobile 2
Strongest AM radio stations in East Los Angeles:
KFWB (980 AM; 50 kW; LOS ANGELES, CA; Owner: INFINITY BROADCASTING OPERATIONS, INC.)
KMPC (1540 AM; 50 kW; LOS ANGELES, CA; Owner: ROSE CITY RADIO CORPORATION)
KXMX (1190 AM; 25 kW; ANAHEIM, CA; Owner: NEW INSPIRATION BROADCASTING COMPANY)
KBLA (1580 AM; 50 kW; SANTA MONICA, CA)
KLAC (570 AM; 50 kW; LOS ANGELES, CA; Owner: AMFM RADIO LICENSES, L.L.C.)
KTNQ (1020 AM; 50 kW; LOS ANGELES, CA; Owner: KTNQ-AM LICENSE CORP.)
KFI (640 AM; 50 kW; LOS ANGELES, CA; Owner: CAPSTAR TX LIMITED PARTNERSHIP)
KXTA (1150 AM; 50 kW; LOS ANGELES, CA; Owner: CITICASTERS LICENSES, L.P.)
KRLA (870 AM; 20 kW; GLENDALE, CA; Owner: NEW INSPIRATION BROADCASTING COMPANY)
KDIS (1110 AM; 50 kW; PASADENA, CA; Owner: ABC,INC.)
KSPN (710 AM; 50 kW; LOS ANGELES, CA; Owner: KABC-AM RADIO, INC.)
KNX (1070 AM; 50 kW; LOS ANGELES, CA; Owner: INFINITY BROADCASTING OPERATIONS, INC.)
KFOX (1650 AM; 10 kW; TORRANCE, CA; Owner: CHAGAL COMMUNICATIONS, INC.)
Strongest FM radio stations in East Los Angeles:
KZLA-FM (93.9 FM; LOS ANGELES, CA; Owner: EMMIS RADIO LICENSE CORPORATION)
KPWR (105.9 FM; LOS ANGELES, CA; Owner: EMMIS RADIO LICENSE CORPORATION)
KLSX (97.1 FM; LOS ANGELES, CA; Owner: INFINITY BROADCASTING OPERATIONS, INC.)
KUSC (91.5 FM; LOS ANGELES, CA; Owner: UNIVERSITY OF SOUTHERN CALIFORNIA)
KKLA-FM (99.5 FM; LOS ANGELES, CA; Owner: NEW INSPIRATION BROADCASTING CO., INC.)
KRTH-FM (101.1 FM; LOS ANGELES, CA; Owner: INFINITY BROADCASTING OPERATIONS, INC.)
KCBS-FM (93.1 FM; LOS ANGELES, CA; Owner: INFINITY BROADCASTING OPERATIONS, INC.)
KKBT (100.3 FM; LOS ANGELES, CA; Owner: RADIO ONE LICENSES, LLC)
KSCA (101.9 FM; GLENDALE, CA; Owner: HBC LICENSE CORPORATION)
KLOS (95.5 FM; LOS ANGELES, CA; Owner: KLOS-FM RADIO, INC.)
K212FA (90.3 FM; TEMPLE CITY, CA; Owner: EDUCATIONAL MEDIA FOUNDATION)
KOST (103.5 FM; LOS ANGELES, CA; Owner: CAPSTAR TX LIMITED PARTNERSHIP)
KIIS-FM (102.7 FM; LOS ANGELES, CA; Owner: CITICASTERS LICENSES, L.P.)
KLVE (107.5 FM; LOS ANGELES, CA; Owner: KLVE-FM LICENSE CORP.)
KPCC (89.3 FM; PASADENA, CA; Owner: PASADENA AREA COMMUNITY COLLEGE DISTRICT)
KHHT (92.3 FM; LOS ANGELES, CA; Owner: AMFM RADIO LICENSES, L.L.C.)
KBIG-FM (104.3 FM; LOS ANGELES, CA; Owner: AMFM RADIO LICENSES, L.L.C.)
KMZT-FM (105.1 FM; LOS ANGELES, CA; Owner: MOUNT WILSON FM BROADCASTERS, INC.)
KTWV (94.7 FM; LOS ANGELES, CA; Owner: INFINITY BROADCASTING OPERATIONS, INC.)
KPFK (90.7 FM; LOS ANGELES, CA; Owner: PACIFICA FOUNDATION, INC)
TV broadcast stations around East Los Angeles:
KCBS-TV (Channel 2; LOS ANGELES, CA; Owner: CBS BROADCASTING INC.)
KTRO-LP (Channel 50; LANCASTER, CA; Owner: ROBERT D. ADELMAN)
KTLA-TV (Channel 5; LOS ANGELES, CA; Owner: KTLA INC.)
KABC-TV (Channel 7; LOS ANGELES, CA; Owner: ABC HOLDING COMPANY, INC.)
KCAL-TV (Channel 9; LOS ANGELES, CA; Owner: VIACOM TELEVISION STATIONS GROUP OF LOS ANGELES LLC)
KNBC (Channel 4; LOS ANGELES, CA; Owner: NBC SUBSIDIARY (KNBC-TV), INC.)
KMEX-TV (Channel 34; LOS ANGELES, CA; Owner: KMEX LICENSE PARTNERSHIP, G.P.)
KAZA-TV (Channel 54; AVALON, CA; Owner: PAPPAS SOUTHERN CALIFORNIA LICENSE LLC)
KDOC-TV (Channel 56; ANAHEIM, CA; Owner: GOLDEN ORANGE BROADCASTING CO., INC.)
KSCI (Channel 18; LONG BEACH, CA; Owner: KSLS, INC.)
KOCE-TV (Channel 50; HUNTINGTON BEACH, CA; Owner: BD. OF TRUSTEES, COAST COMMUNITY COLLEGE DIST.)
KXLA (Channel 44; RANCHO PALOS VERDES, CA; Owner: RANCHO PALOS VERDES BROADCASTERS, INC.)
KCET (Channel 28; LOS ANGELES, CA; Owner: COMMUNITY TELEVISION OF SOUTHERN CALIFORNIA)
KFTR (Channel 46; ONTARIO, CA; Owner: TELEFUTURA LOS ANGELES LLC)
KHIZ (Channel 64; BARSTOW, CA; Owner: SUNBELT TELEVISION, INC.)
KTTV (Channel 11; LOS ANGELES, CA; Owner: FOX TELEVISION STATIONS, INC.)
KWHY-TV (Channel 22; LOS ANGELES, CA; Owner: TELEMUNDO OF LOS ANGELES LICENSE CORPORATION)
KVEA (Channel 52; CORONA, CA; Owner: ESTRELLA LICENSE CORPORATION)
KCOP-TV (Channel 13; LOS ANGELES, CA; Owner: FOX TELEVISION STATIONS, INC.)
KTBN-TV (Channel 40; SANTA ANA, CA; Owner: TRINITY BROADCASTING NETWORK, INC.)
KLCS (Channel 58; LOS ANGELES, CA; Owner: LOS ANGELES UNIFIED SCHOOL DISTRICT)
KSFV-LP (Channel 26; SAN FERNANDO VALLEY, CA; Owner: VENTURE TECHNOLOGIES GROUP, LLC)
KHTV-LP (Channel 48; INLAND EMPIRE, CA; Owner: VENTURE TECHNOLOGIES GROUP, LLC)
FCC Registered Antenna Towers: 5
Shannan L Schmidt, 731 S. Ferris Blvd. (Lat: 34.023417 Lon: -118.163000), Type: 16.2, Overall height: 16.2 m, Registrant: Horvath Towers LLC, Sschmidt@horvathcommunications.Com, , South- Bend, Phone: (574) 237-0464 Shannan L Schmidt, 731 S. Ferris Blvd. (Lat: 34.023417 Lon: -118.163000), Type: 16.2, Overall height: 16.2 m, Registrant: Horvath Towers LLC, Sschmidt@horvathcommunications.Com, , South- Bend, Phone: (574) 237-0464 Edward G Roach, 731 S. Ferris Blvd. (Lat: 34.023417 Lon: -118.163000), Type: 16.2, Overall height: 16.2 m, Registrant: Sba Towers Iii LLC, Eroach@sbasite.Com, , Boca -Raton, Phone: (561) 995-7670 Edward G Roach, 731 S. Ferris Blvd. (Ca12894-A) (Lat: 34.023167 Lon: -118.163472), Type: 16.8, Overall height: 15.2 m, Registrant: Sba Towers Iii LLC, Eroach@sbasite.Com, , Boca -Raton, Phone: (561) 995-7670 Edward G Roach, 731 S. Ferris Blvd. (Ca12894-A) (Lat: 34.023167 Lon: -118.163472), Type: 16.8, Overall height: 15.2 m, Registrant: Sba Towers Iii LLC, Eroach@sbasite.Com, , Boca -Raton, Phone: (561) 995-7670 FCC Registered Broadcast Land Mobile Towers: 7
4480 E Olympic Blvd (Lat: 34.018611 Lon: -118.174167), Call Sign: WQCD847, Assigned Frequencies: 30.8400 MHz, 154.540 MHz, 33.4000 MHz, 33.1600 MHz, 31.2400 MHz, 468.487 MHz, 468.762 MHz, 468.837 MHz, 469.462 MHz, 469.637 MHz... (+22 more), Grant Date: 02/09/2005, Expiration Date: 02/09/2015, Cancellation Date: 04/11/2015, Certifier: Beth Cotner, Registrant: Dolfen Consulting Group, 95 Willow Lane, Bristol, IL 60512-9711, Phone: (630) 553-5886, Fax: (630) 566-1755, Email:
5600 East Whittier Blvd. (Lat: 34.018889 Lon: -118.150278), Call Sign: WQCD912, Assigned Frequencies: 467.187 MHz, 467.462 MHz, 467.487 MHz, 467.512 MHz, Grant Date: 02/09/2005, Expiration Date: 02/09/2015, Cancellation Date: 04/11/2015, Certifier: Joan Anderberg, Registrant: Advanced Wireless Communications, 20809 Kensington Blvd., Lakeville, MN 55021, Phone: (952) 469-5400, Email:
57-A,B,C (CB-1), 3224 Medford Ave. (Lat: 34.061444 Lon: -118.192333), Type: Tower, Structure height: 6 m, Call Sign: WQCL268, Assigned Frequencies: 218.450 MHz, Grant Date: 02/12/2015, Expiration Date: 03/30/2025, Certifier: Raymond Taylor, Registrant: Data Flow Systems, Inc., 605 N John Rodes Boulevard, Melbourne, FL 32934-9105, Phone: (321) 259-5009, Fax: (321) 259-4006, Email:
43-01, 5007 Telegraph Road (Lat: 34.013028 Lon: -118.164111), Type: Tower, Structure height: 6 m, Call Sign: WQCL269, Assigned Frequencies: 218.450 MHz, Grant Date: 02/12/2015, Expiration Date: 03/30/2025, Certifier: Raymond Taylor, Registrant: Data Flow Systems, Inc., 605 N John Rodes Blvd, Melbourne, FL 32934-9105, Phone: (321) 259-5009, Fax: (321) 259-4006, Email:
42-C,D, 1037 North Eastern Ave. (Lat: 34.048778 Lon: -118.175972), Type: Tower, Structure height: 6 m, Call Sign: WQCL270, Assigned Frequencies: 218.450 MHz, Grant Date: 02/12/2015, Expiration Date: 03/30/2025, Certifier: Raymond Taylor, Registrant: Data Flow Systems, Inc., 605 N John Rodes Blvd, Melbourne, FL 32934-9105, Phone: (321) 259-5009, Fax: (321) 259-4006, Email:
McDonald\'s #14283, 4480 E Olympic Blvd (Lat: 34.018611 Lon: -118.174167), Call Sign: WQVF921, Assigned Frequencies: 31.2400 MHz, 33.1600 MHz, 33.4000 MHz, 35.0200 MHz, 154.540 MHz, 457.512 MHz, 457.587 MHz, 464.012 MHz, 464.037 MHz, 464.062 MHz... (+20 more), Grant Date: 01/30/2015, Expiration Date: 01/30/2025, Certifier: Laura Nicholson, Registrant: Dolfen Consulting Group, 95 Willow Lane, Bristol, IL 60512-9711, Phone: (630) 251-9161, Fax: (630) 566-1755, Email:
CHARTER SCHOOL, 5115 Via Corona Street (Lat: 34.032222 Lon: -118.155056), Type: Building, Structure height: 9 m, Call Sign: WREL851, Assigned Frequencies: 465.000 MHz, Grant Date: 10/30/2019, Expiration Date: 10/30/2029, Certifier: Stephanie Conde, Registrant: Visiplex, Inc., 1287 North Barclay Boulevard, Buffalo Grove, IL 60089, Phone: (847) 229-0250, Fax: (847) 229-0259, Email:
FCC Registered Microwave Towers: 26 (
See the full list of FCC Registered Microwave Towers in this town )
FCC Registered Amateur Radio Licenses: 2
Call Sign: W6EJF, Previous Call Sign: KN6MRI, Licensee ID: L02381071, Grant Date: 01/12/2021, Expiration Date: 01/12/2031, Cancellation Date: 12/21/2021, Certifier: Evan J Fetherolf, Registrant: Evan J Fetherolf, 700 S Sadler Ave, East Los Angeles, CA 90022-3330Call Sign: KN6MRI, Previous Call Sign: W6EJF, Licensee ID: L02381071, Grant Date: 12/21/2021, Expiration Date: 12/21/2031, Certifier: Evan J Fetherolf, Registrant: Evan J Fetherolf, 700 S Sadler Ave, East Los Angeles, CA 90022-3330
Home Mortgage Disclosure Act Aggregated Statistics For Year 2009(Based on 26 full and 2 partial tracts) A) FHA, FSA/RHS & VA B) Conventional C) Refinancings D) Home Improvement Loans E) Loans on Dwellings For 5+ Families F) Non-occupant Loans on G) Loans On Manufactured Number Average Value Number Average Value Number Average Value Number Average Value Number Average Value Number Average Value Number Average Value
LOANS ORIGINATED 161 $235,388 101 $194,678 282 $207,784 29 $170,369 9 $329,946 80 $203,721 1 $306,000 APPLICATIONS APPROVED, NOT ACCEPTED 18 $249,667 19 $174,635 64 $206,257 11 $110,086 0 $0 26 $171,968 0 $0 APPLICATIONS DENIED 46 $263,004 55 $194,738 344 $222,593 64 $108,271 4 $408,250 63 $199,726 0 $0 APPLICATIONS WITHDRAWN 30 $251,045 39 $194,097 147 $221,476 24 $163,049 3 $339,667 54 $200,371 0 $0 FILES CLOSED FOR INCOMPLETENESS 9 $279,528 5 $236,596 50 $231,335 4 $136,540 0 $0 6 $173,112 0 $0
Aggregated Statistics For Year 2008(Based on 26 full and 2 partial tracts) A) FHA, FSA/RHS & VA B) Conventional C) Refinancings D) Home Improvement Loans E) Loans on Dwellings For 5+ Families F) Non-occupant Loans on G) Loans On Manufactured Number Average Value Number Average Value Number Average Value Number Average Value Number Average Value Number Average Value Number Average Value
LOANS ORIGINATED 42 $306,155 103 $249,331 450 $252,770 75 $192,928 17 $418,991 112 $223,257 2 $50,175 APPLICATIONS APPROVED, NOT ACCEPTED 5 $290,600 30 $255,480 180 $273,753 21 $167,496 1 $448,000 33 $298,826 5 $126,128 APPLICATIONS DENIED 21 $321,401 105 $309,440 720 $288,709 145 $134,705 9 $445,683 110 $274,221 9 $166,837 APPLICATIONS WITHDRAWN 8 $368,242 40 $268,011 184 $276,290 34 $163,240 3 $573,333 36 $262,308 0 $0 FILES CLOSED FOR INCOMPLETENESS 5 $387,400 16 $337,166 83 $287,754 14 $205,149 0 $0 20 $325,111 0 $0
Aggregated Statistics For Year 2007(Based on 26 full and 2 partial tracts) A) FHA, FSA/RHS & VA B) Conventional C) Refinancings D) Home Improvement Loans E) Loans on Dwellings For 5+ Families F) Non-occupant Loans on G) Loans On Manufactured Number Average Value Number Average Value Number Average Value Number Average Value Number Average Value Number Average Value Number Average Value
LOANS ORIGINATED 1 $330,000 396 $296,364 1,356 $301,520 231 $221,119 29 $469,999 248 $309,888 1 $42,000 APPLICATIONS APPROVED, NOT ACCEPTED 0 $0 122 $290,419 411 $302,124 60 $201,568 1 $460,000 59 $294,854 1 $75,000 APPLICATIONS DENIED 0 $0 409 $327,113 1,197 $316,569 268 $191,487 7 $453,429 210 $312,411 4 $125,250 APPLICATIONS WITHDRAWN 0 $0 118 $332,910 429 $315,810 79 $242,245 9 $406,166 61 $308,414 1 $310,000 FILES CLOSED FOR INCOMPLETENESS 1 $359,000 50 $350,229 149 $343,545 19 $211,281 1 $503,820 25 $346,081 0 $0
Aggregated Statistics For Year 2006(Based on 26 full and 2 partial tracts) A) FHA, FSA/RHS & VA B) Conventional C) Refinancings D) Home Improvement Loans E) Loans on Dwellings For 5+ Families F) Non-occupant Loans on G) Loans On Manufactured Number Average Value Number Average Value Number Average Value Number Average Value Number Average Value Number Average Value Number Average Value
LOANS ORIGINATED 1 $335,000 953 $262,269 1,906 $283,656 347 $193,996 35 $1,062,977 343 $281,994 3 $40,260 APPLICATIONS APPROVED, NOT ACCEPTED 1 $123,000 272 $254,895 478 $284,895 63 $210,059 0 $0 86 $277,155 7 $64,933 APPLICATIONS DENIED 0 $0 606 $287,072 1,050 $310,506 290 $177,028 5 $409,342 179 $318,530 12 $165,543 APPLICATIONS WITHDRAWN 0 $0 297 $278,501 775 $285,468 119 $182,723 4 $1,456,750 67 $279,003 2 $333,000 FILES CLOSED FOR INCOMPLETENESS 1 $207,000 67 $267,813 172 $294,077 15 $175,177 1 $490,000 15 $250,677 0 $0
Aggregated Statistics For Year 2005(Based on 26 full and 2 partial tracts) A) FHA, FSA/RHS & VA B) Conventional C) Refinancings D) Home Improvement Loans E) Loans on Dwellings For 5+ Families F) Non-occupant Loans on G) Loans On Manufactured Number Average Value Number Average Value Number Average Value Number Average Value Number Average Value Number Average Value Number Average Value
LOANS ORIGINATED 4 $279,750 946 $234,277 2,261 $240,778 327 $172,634 29 $500,446 404 $240,666 2 $210,000 APPLICATIONS APPROVED, NOT ACCEPTED 0 $0 228 $216,483 465 $227,601 46 $183,865 1 $340,000 71 $224,213 12 $74,639 APPLICATIONS DENIED 2 $239,500 460 $238,940 1,150 $241,434 295 $137,864 9 $432,258 152 $259,941 5 $146,362 APPLICATIONS WITHDRAWN 0 $0 301 $235,335 801 $237,363 175 $156,146 2 $425,000 89 $226,329 2 $122,000 FILES CLOSED FOR INCOMPLETENESS 0 $0 48 $225,707 308 $232,818 18 $176,454 2 $250,000 21 $222,796 1 $93,000
Aggregated Statistics For Year 2004(Based on 26 full and 2 partial tracts) A) FHA, FSA/RHS & VA B) Conventional C) Refinancings D) Home Improvement Loans E) Loans on Dwellings For 5+ Families F) Non-occupant Loans on G) Loans On Manufactured Number Average Value Number Average Value Number Average Value Number Average Value Number Average Value Number Average Value Number Average Value
LOANS ORIGINATED 13 $221,207 906 $186,253 2,409 $191,746 246 $138,899 37 $481,565 390 $189,875 1 $113,000 APPLICATIONS APPROVED, NOT ACCEPTED 1 $260,000 244 $198,487 525 $194,155 50 $140,209 0 $0 83 $199,973 1 $140,000 APPLICATIONS DENIED 2 $223,905 424 $194,061 1,239 $201,916 261 $122,360 11 $341,386 145 $193,898 4 $90,000 APPLICATIONS WITHDRAWN 9 $242,193 157 $187,146 1,030 $184,639 101 $131,873 4 $326,700 63 $211,089 3 $145,000 FILES CLOSED FOR INCOMPLETENESS 1 $194,000 42 $195,716 214 $202,897 15 $114,977 0 $0 18 $206,091 0 $0
Aggregated Statistics For Year 2003(Based on 26 full and 2 partial tracts) A) FHA, FSA/RHS & VA B) Conventional C) Refinancings D) Home Improvement Loans E) Loans on Dwellings For 5+ Families F) Non-occupant Loans on Number Average Value Number Average Value Number Average Value Number Average Value Number Average Value Number Average Value
LOANS ORIGINATED 64 $208,570 668 $156,653 2,784 $152,979 70 $47,829 33 $351,308 425 $150,268 APPLICATIONS APPROVED, NOT ACCEPTED 14 $206,841 151 $178,086 543 $156,609 26 $50,060 1 $59,000 92 $163,953 APPLICATIONS DENIED 15 $255,108 303 $159,032 1,284 $163,719 110 $61,381 7 $203,429 181 $159,952 APPLICATIONS WITHDRAWN 24 $231,292 144 $177,639 1,020 $160,889 46 $46,355 1 $294,730 61 $151,379 FILES CLOSED FOR INCOMPLETENESS 6 $217,367 36 $168,455 159 $152,407 6 $47,133 2 $87,450 23 $152,449
Aggregated Statistics For Year 2002(Based on 14 full and 2 partial tracts) A) FHA, FSA/RHS & VA B) Conventional C) Refinancings D) Home Improvement Loans E) Loans on Dwellings For 5+ Families F) Non-occupant Loans on Number Average Value Number Average Value Number Average Value Number Average Value Number Average Value Number Average Value
LOANS ORIGINATED 105 $190,199 282 $159,011 840 $146,033 43 $38,384 19 $426,743 133 $140,497 APPLICATIONS APPROVED, NOT ACCEPTED 15 $170,839 41 $172,328 170 $139,382 7 $20,951 1 $315,000 25 $117,818 APPLICATIONS DENIED 24 $203,150 110 $134,644 437 $145,731 65 $32,911 10 $397,300 48 $146,753 APPLICATIONS WITHDRAWN 12 $202,957 67 $183,262 438 $155,400 26 $37,567 3 $209,333 19 $197,966 FILES CLOSED FOR INCOMPLETENESS 1 $128,000 24 $140,228 121 $141,168 2 $25,000 0 $0 12 $133,132
Aggregated Statistics For Year 2001(Based on 14 full and 2 partial tracts) A) FHA, FSA/RHS & VA B) Conventional C) Refinancings D) Home Improvement Loans E) Loans on Dwellings For 5+ Families F) Non-occupant Loans on Number Average Value Number Average Value Number Average Value Number Average Value Number Average Value Number Average Value
LOANS ORIGINATED 142 $178,629 202 $126,479 721 $131,232 52 $24,277 10 $235,924 140 $128,070 APPLICATIONS APPROVED, NOT ACCEPTED 19 $182,801 37 $135,089 121 $134,324 6 $38,500 2 $216,000 21 $146,667 APPLICATIONS DENIED 43 $190,007 76 $138,735 502 $132,507 88 $31,014 2 $239,000 62 $139,917 APPLICATIONS WITHDRAWN 35 $173,987 42 $123,160 287 $136,241 43 $29,826 1 $256,000 39 $132,636 FILES CLOSED FOR INCOMPLETENESS 10 $191,099 8 $124,226 101 $137,179 2 $37,500 0 $0 14 $126,589
Aggregated Statistics For Year 2000(Based on 14 full and 2 partial tracts) A) FHA, FSA/RHS & VA B) Conventional C) Refinancings D) Home Improvement Loans E) Loans on Dwellings For 5+ Families F) Non-occupant Loans on Number Average Value Number Average Value Number Average Value Number Average Value Number Average Value Number Average Value
LOANS ORIGINATED 138 $161,905 184 $126,314 211 $115,721 34 $35,017 6 $169,395 86 $111,024 APPLICATIONS APPROVED, NOT ACCEPTED 27 $169,563 16 $108,753 59 $108,900 16 $26,009 0 $0 26 $90,409 APPLICATIONS DENIED 33 $159,510 77 $126,193 262 $115,021 59 $23,187 0 $0 46 $117,857 APPLICATIONS WITHDRAWN 34 $163,759 31 $127,554 105 $99,844 11 $19,465 0 $0 19 $115,687 FILES CLOSED FOR INCOMPLETENESS 6 $164,160 14 $128,352 79 $133,245 4 $27,000 0 $0 3 $122,867
Aggregated Statistics For Year 1999(Based on 15 full and 10 partial tracts) A) FHA, FSA/RHS & VA B) Conventional C) Refinancings D) Home Improvement Loans E) Loans on Dwellings For 5+ Families F) Non-occupant Loans on Number Average Value Number Average Value Number Average Value Number Average Value Number Average Value Number Average Value
LOANS ORIGINATED 296 $153,676 246 $124,782 687 $116,094 153 $29,801 15 $190,439 149 $112,682 APPLICATIONS APPROVED, NOT ACCEPTED 33 $141,839 21 $100,560 184 $109,141 39 $25,026 2 $172,290 29 $97,559 APPLICATIONS DENIED 67 $153,848 95 $129,020 533 $117,654 98 $22,882 5 $150,732 99 $121,267 APPLICATIONS WITHDRAWN 56 $154,608 55 $120,581 255 $113,263 4 $56,080 3 $95,533 37 $120,650 FILES CLOSED FOR INCOMPLETENESS 14 $129,032 14 $119,139 204 $117,192 4 $44,340 0 $0 17 $136,769
Detailed mortgage data for all 28 tracts in East Los Angeles, CA
Private Mortgage Insurance Companies Aggregated Statistics For Year 2009(Based on 16 full and 1 partial tracts) A) Conventional B) Refinancings Number Average Value Number Average Value
LOANS ORIGINATED 11 $231,328 2 $255,500 APPLICATIONS APPROVED, NOT ACCEPTED 5 $213,800 4 $358,075 APPLICATIONS DENIED 4 $233,750 1 $359,000 APPLICATIONS WITHDRAWN 2 $292,000 0 $0 FILES CLOSED FOR INCOMPLETENESS 0 $0 0 $0
Aggregated Statistics For Year 2008(Based on 24 full and 2 partial tracts) A) Conventional B) Refinancings C) Non-occupant Loans on Number Average Value Number Average Value Number Average Value
LOANS ORIGINATED 40 $306,437 16 $378,486 2 $187,000 APPLICATIONS APPROVED, NOT ACCEPTED 21 $370,190 32 $402,264 2 $321,000 APPLICATIONS DENIED 10 $301,159 8 $299,409 4 $256,318 APPLICATIONS WITHDRAWN 3 $292,247 2 $411,985 0 $0 FILES CLOSED FOR INCOMPLETENESS 2 $308,000 0 $0 0 $0
Aggregated Statistics For Year 2007(Based on 26 full and 2 partial tracts) A) Conventional B) Refinancings C) Non-occupant Loans on Number Average Value Number Average Value Number Average Value
LOANS ORIGINATED 41 $385,697 34 $401,235 4 $296,005 APPLICATIONS APPROVED, NOT ACCEPTED 11 $407,666 22 $405,070 1 $279,000 APPLICATIONS DENIED 4 $467,750 2 $470,500 0 $0 APPLICATIONS WITHDRAWN 6 $394,265 3 $518,333 0 $0 FILES CLOSED FOR INCOMPLETENESS 0 $0 0 $0 0 $0
Aggregated Statistics For Year 2006(Based on 21 full and 2 partial tracts) A) Conventional B) Refinancings C) Non-occupant Loans on Number Average Value Number Average Value Number Average Value
LOANS ORIGINATED 24 $379,089 25 $374,786 4 $378,250 APPLICATIONS APPROVED, NOT ACCEPTED 5 $405,096 11 $377,273 2 $380,500 APPLICATIONS DENIED 1 $473,000 1 $617,000 0 $0 APPLICATIONS WITHDRAWN 1 $473,000 6 $360,000 1 $473,000 FILES CLOSED FOR INCOMPLETENESS 0 $0 2 $455,000 0 $0
Aggregated Statistics For Year 2005(Based on 23 full and 2 partial tracts) A) Conventional B) Refinancings C) Non-occupant Loans on Number Average Value Number Average Value Number Average Value
LOANS ORIGINATED 40 $307,485 24 $299,925 6 $270,768 APPLICATIONS APPROVED, NOT ACCEPTED 12 $266,594 11 $284,541 3 $270,870 APPLICATIONS DENIED 2 $336,500 1 $415,000 0 $0 APPLICATIONS WITHDRAWN 1 $277,800 2 $277,515 0 $0 FILES CLOSED FOR INCOMPLETENESS 0 $0 0 $0 0 $0
Aggregated Statistics For Year 2004(Based on 26 full and 2 partial tracts) A) Conventional B) Refinancings C) Non-occupant Loans on Number Average Value Number Average Value Number Average Value
LOANS ORIGINATED 83 $247,175 31 $228,335 7 $250,480 APPLICATIONS APPROVED, NOT ACCEPTED 18 $244,928 17 $196,341 1 $171,000 APPLICATIONS DENIED 3 $248,137 5 $259,172 0 $0 APPLICATIONS WITHDRAWN 6 $237,167 2 $255,090 1 $284,000 FILES CLOSED FOR INCOMPLETENESS 0 $0 1 $235,000 0 $0
Aggregated Statistics For Year 2003(Based on 26 full and 2 partial tracts) A) Conventional B) Refinancings C) Non-occupant Loans on Number Average Value Number Average Value Number Average Value
LOANS ORIGINATED 166 $207,742 91 $186,029 6 $215,800 APPLICATIONS APPROVED, NOT ACCEPTED 36 $196,034 33 $178,525 4 $173,500 APPLICATIONS DENIED 4 $202,042 2 $196,125 1 $267,000 APPLICATIONS WITHDRAWN 8 $193,221 1 $181,000 2 $207,500 FILES CLOSED FOR INCOMPLETENESS 0 $0 0 $0 0 $0
Aggregated Statistics For Year 2002(Based on 14 full and 2 partial tracts) A) Conventional B) Refinancings C) Non-occupant Loans on Number Average Value Number Average Value Number Average Value
LOANS ORIGINATED 122 $182,160 37 $166,507 7 $174,311 APPLICATIONS APPROVED, NOT ACCEPTED 25 $162,318 12 $164,034 3 $143,000 APPLICATIONS DENIED 4 $211,980 2 $222,010 2 $220,510 APPLICATIONS WITHDRAWN 3 $205,433 4 $146,500 1 $90,000 FILES CLOSED FOR INCOMPLETENESS 2 $200,500 0 $0 0 $0
Aggregated Statistics For Year 2001(Based on 14 full and 2 partial tracts) A) Conventional B) Refinancings C) Non-occupant Loans on Number Average Value Number Average Value Number Average Value
LOANS ORIGINATED 72 $158,105 44 $162,203 5 $156,660 APPLICATIONS APPROVED, NOT ACCEPTED 19 $144,243 15 $159,131 0 $0 APPLICATIONS DENIED 11 $161,063 6 $154,123 1 $156,520 APPLICATIONS WITHDRAWN 2 $191,450 3 $178,130 0 $0 FILES CLOSED FOR INCOMPLETENESS 0 $0 1 $130,000 1 $130,000
Aggregated Statistics For Year 2000(Based on 14 full and 2 partial tracts) A) Conventional B) Refinancings C) Non-occupant Loans on Number Average Value Number Average Value Number Average Value
LOANS ORIGINATED 65 $153,760 27 $130,945 12 $141,473 APPLICATIONS APPROVED, NOT ACCEPTED 9 $128,696 8 $143,420 0 $0 APPLICATIONS DENIED 5 $141,208 1 $145,000 0 $0 APPLICATIONS WITHDRAWN 5 $141,644 0 $0 2 $160,610 FILES CLOSED FOR INCOMPLETENESS 0 $0 0 $0 0 $0
Aggregated Statistics For Year 1999(Based on 15 full and 10 partial tracts) A) Conventional B) Refinancings C) Non-occupant Loans on Number Average Value Number Average Value Number Average Value
LOANS ORIGINATED 74 $144,201 89 $138,213 6 $125,640 APPLICATIONS APPROVED, NOT ACCEPTED 9 $119,098 33 $151,533 1 $164,180 APPLICATIONS DENIED 8 $127,874 8 $123,782 2 $91,965 APPLICATIONS WITHDRAWN 4 $188,082 5 $143,354 0 $0 FILES CLOSED FOR INCOMPLETENESS 1 $148,000 2 $173,500 0 $0
East Los Angeles compared to California state average:
Black race population percentage significantly below state average. Hispanic race population percentage above state average. Length of stay since moving in above state average. House age above state average. Percentage of population with a bachelor's degree or higher below state average. East Los Angeles, CA compared to other similar cities: East Los Angeles on our top lists :
#2 on the list of "Top 101 cities with the least people having professional degrees (population 50,000+)"
#2 on the list of "Top 100 least racially diverse cities (pop. 50,000+)"
#3 on the list of "Top 100 least-educated cities (pop. 50,000+)"
#4 on the list of "Top 101 cities with largest percentage of males in industries: other services, except public administration (population 50,000+)"
#5 on the list of "Top 101 cities with the highest percentage of family households, population 100,000+"
#7 on the list of "Top 101 cities with the least people having Master's or Doctorate degrees (population 50,000+)"
#12 on the list of "Top 101 cities with the least people having Doctorate degrees (population 50,000+)"
#13 on the list of "Top 101 cities with the lowest percentage of English-only speaking households, population 50,000+"
#17 on the list of "Top 101 cities with largest percentage of males in occupations: construction and extraction occupations (population 50,000+)"
#21 on the list of "Top 101 cities with largest percentage of females in occupations: production occupations (population 50,000+)"
#24 on the list of "Top 100 cities with old houses but young residents (pop. 50,000+)"
#28 on the list of "Top 101 cities with largest percentage of females in occupations: farming, fishing, and forestry occupations (population 50,000+)"
#28 on the list of "Top 101 cities with largest percentage of females in occupations: material moving occupations (population 50,000+)"
#29 on the list of "Top 101 cities with largest percentage of females in industries: wholesale trade (population 50,000+)"
#30 on the list of "Top 101 cities with largest percentage of males in occupations: office and administrative support occupations (population 50,000+)"
#30 on the list of "Top 100 cities with smallest houses (pop. 50,000+)"
#31 on the list of "Top 100 cities with highest percentage of renters (pop. 50,000+)"
#38 on the list of "Top 101 cities with largest percentage of females in occupations: office and administrative support occupations (population 50,000+)"
#38 on the list of "Top 101 cities with largest percentage of males in industries: construction (population 50,000+)"
#40 on the list of "Top 101 cities with largest percentage of females in industries: manufacturing (population 50,000+)"
#1 (90063) on the list of "Top 101 zip codes with the lowest 2012 average net capital gain/loss (pop 1,000+)"
#66 (90063) on the list of "Top 101 zip codes with the largest percentage of taxpayers using paid preparers for 2012 taxes (pop 5,000+)"
#83 (91754) on the list of "Top 101 zip codes with the most offices of physicians in 2005"
#1 on the list of "Top 101 counties with the most Evangelical Protestant congregations"
#1 on the list of "Top 101 counties with the most Mainline Protestant congregations"
#1 on the list of "Top 101 counties with the most Orthodox adherents"
#1 on the list of "Top 101 counties with the highest ground withdrawal of fresh water for public supply (pop. 50,000+)"
#1 on the list of "Top 101 counties with the most Catholic adherents (pop. 50,000+)"
Top Patent Applicants
Ellen Sletten (2)
Emily Cosco (2)
Donald Kohn (1)
Total of 3 patent applications in 2008-2024.
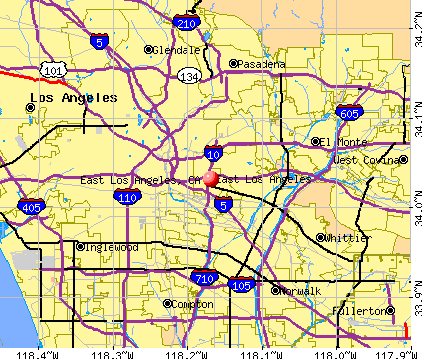


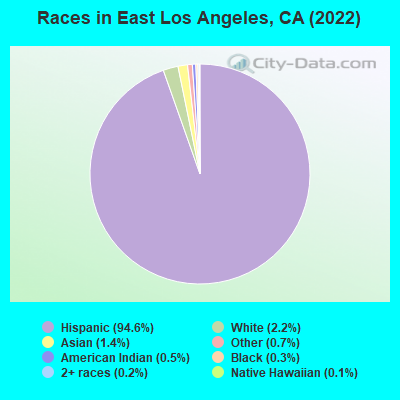
 Recent articles from our blog. Our writers, many of them Ph.D. graduates or candidates, create easy-to-read articles on a wide variety of topics.

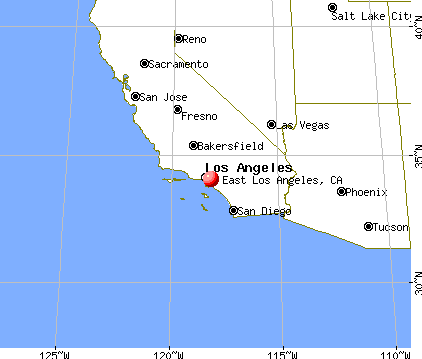
 , pop. 320,008).
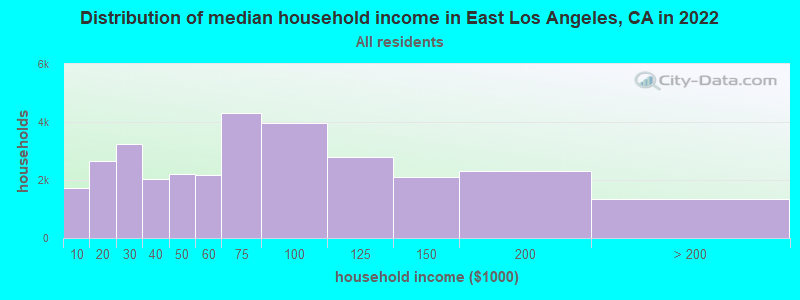
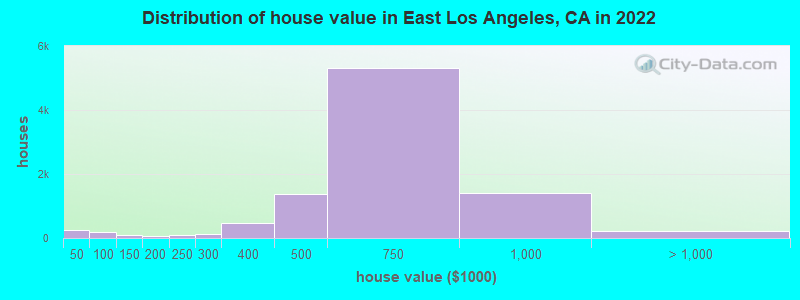
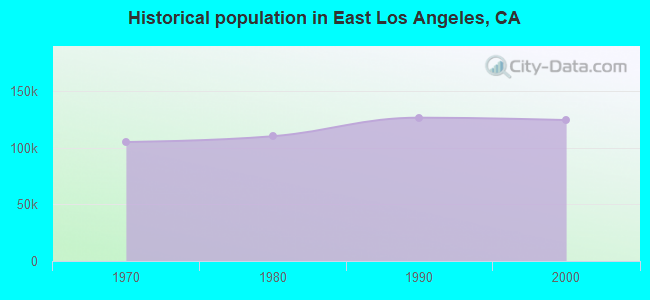
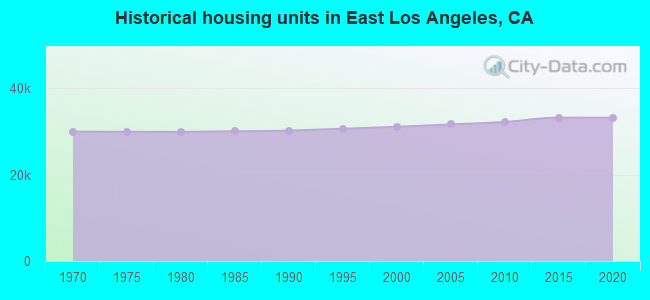
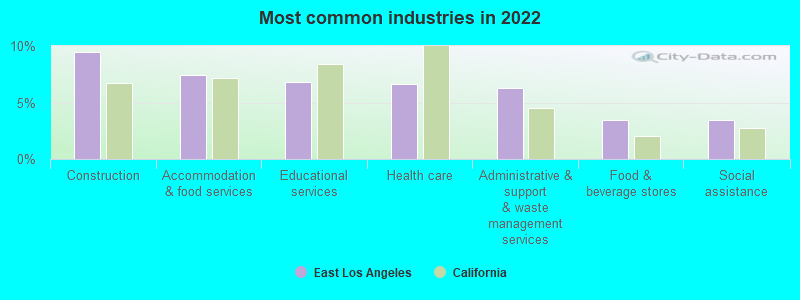
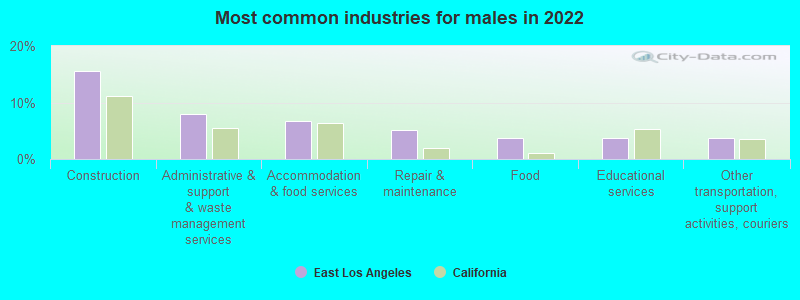
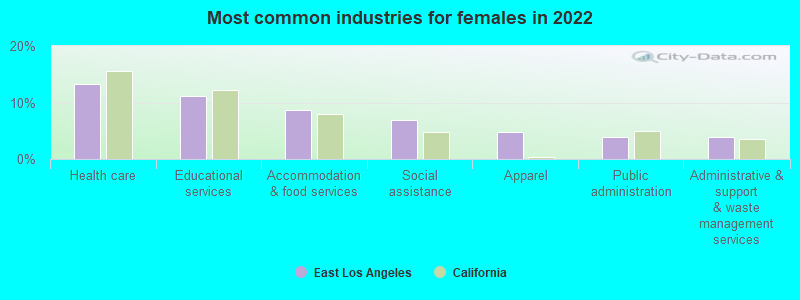
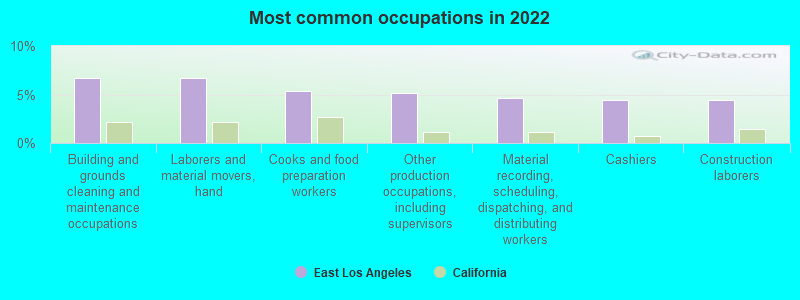
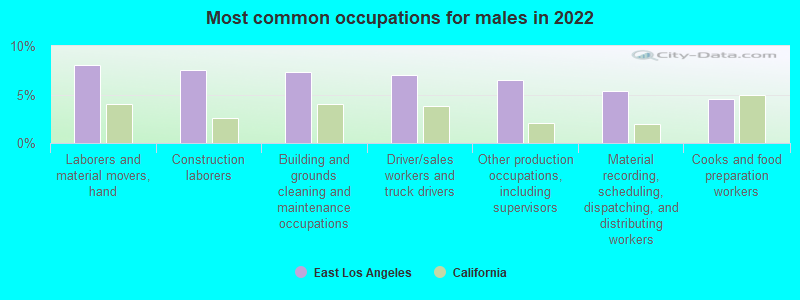
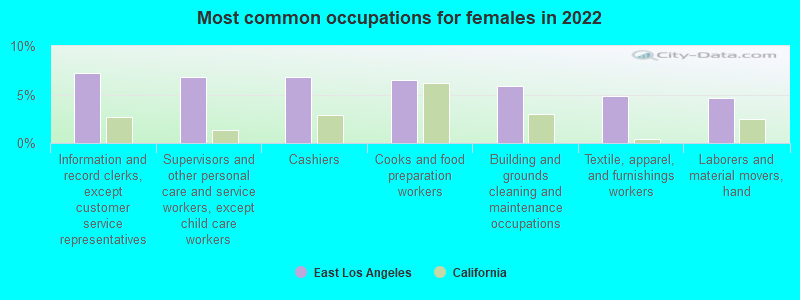
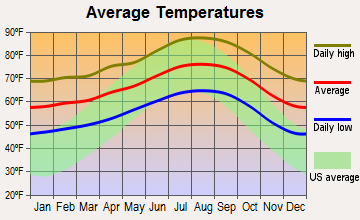
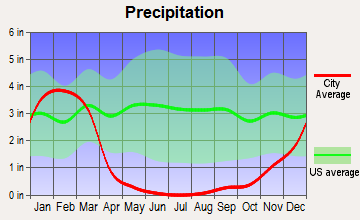
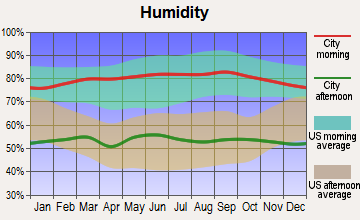
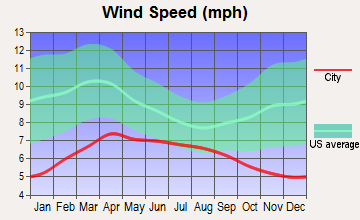
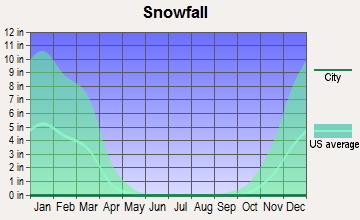
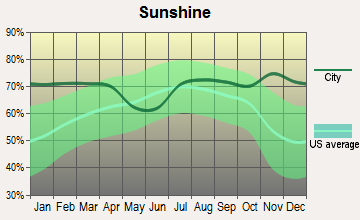
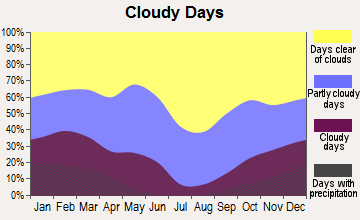
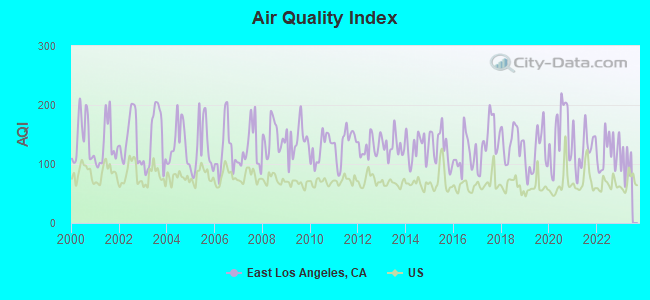
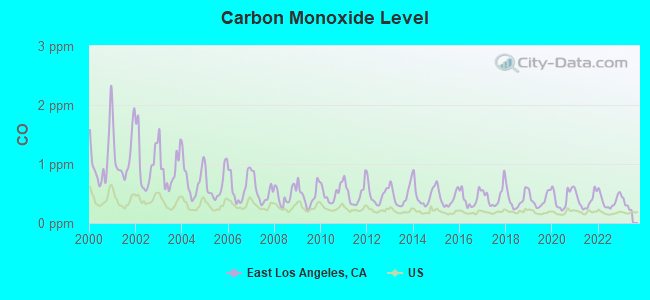
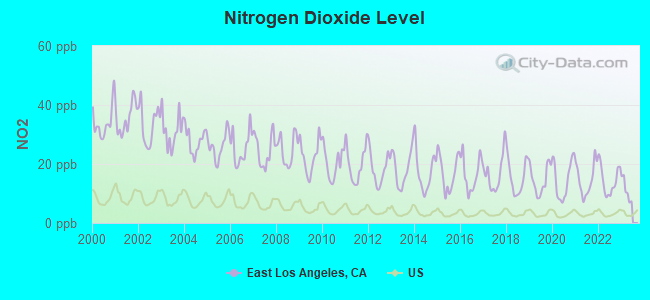
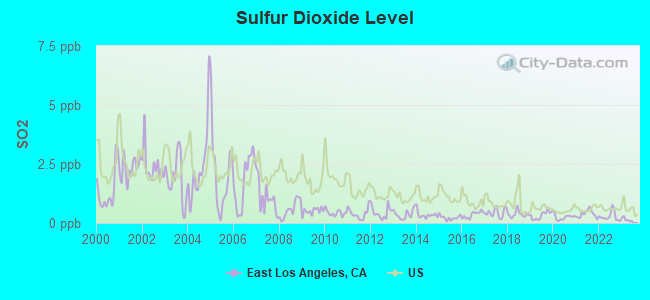
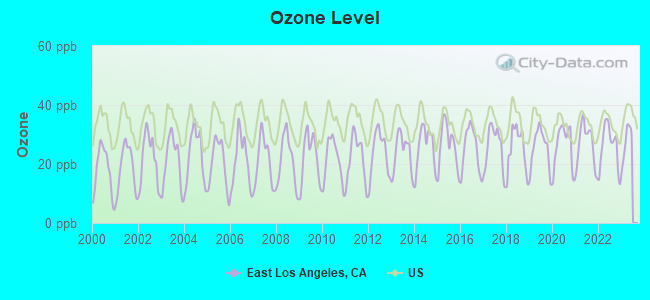
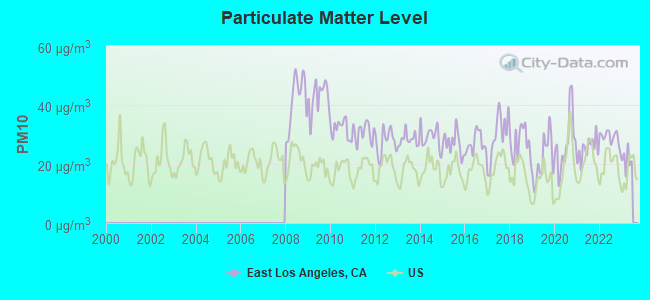
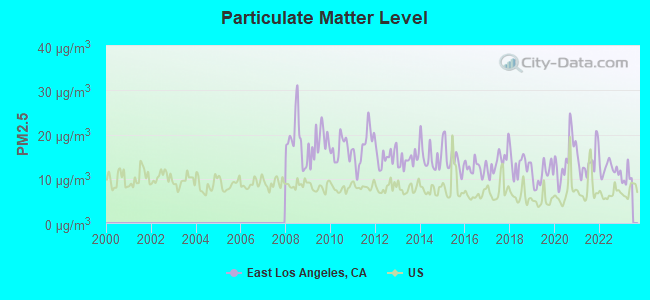
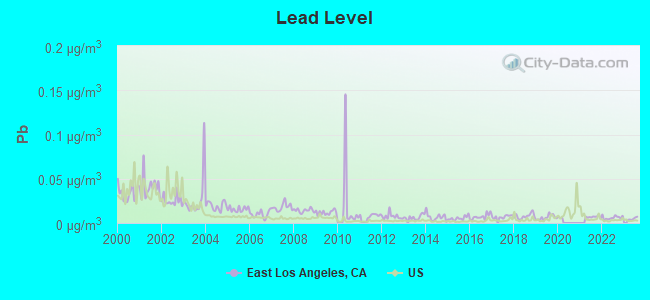
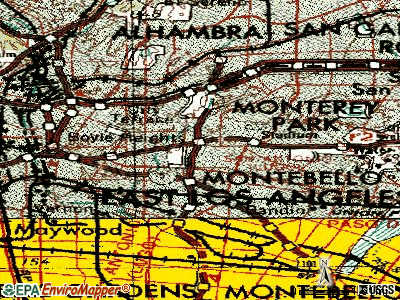
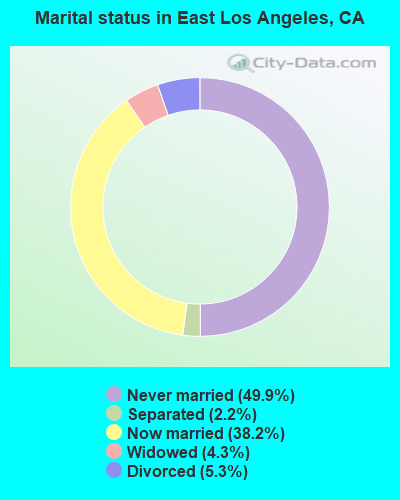
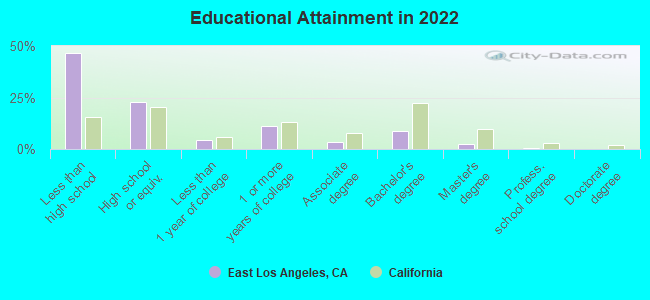
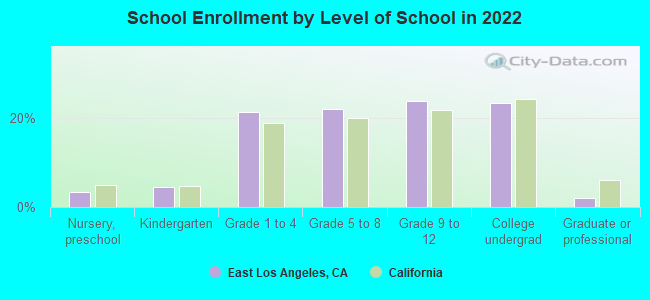
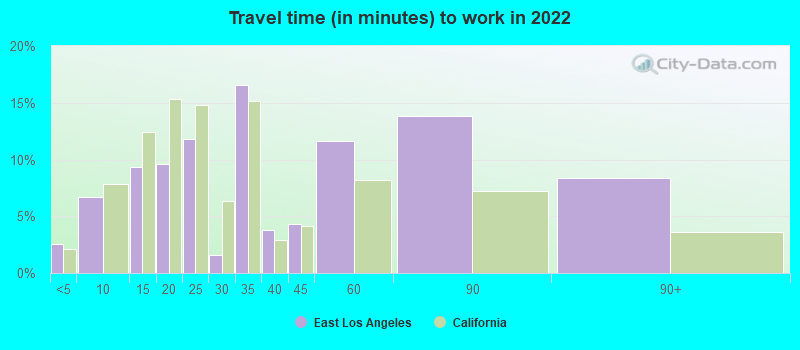
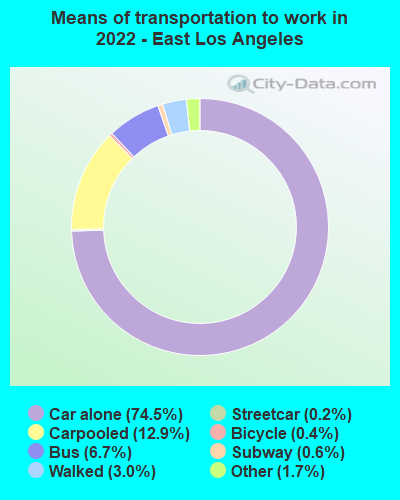


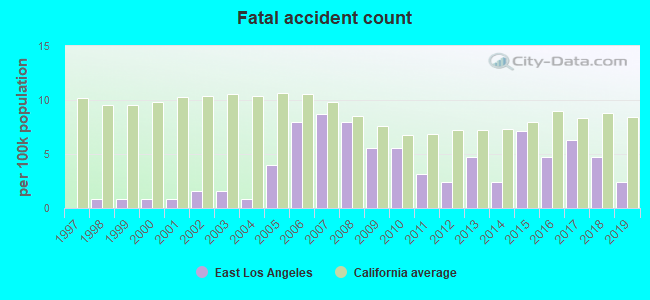
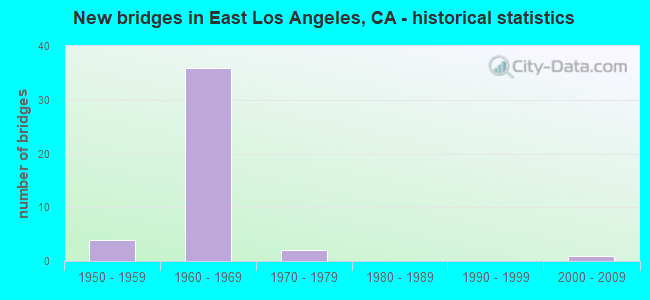
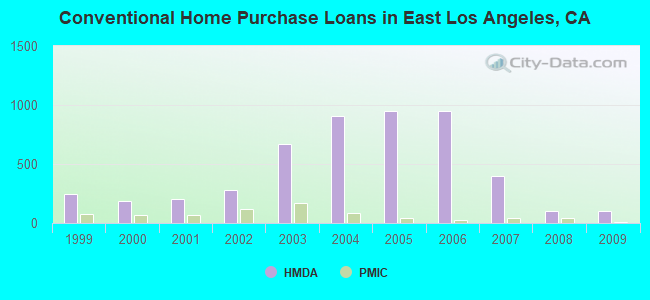
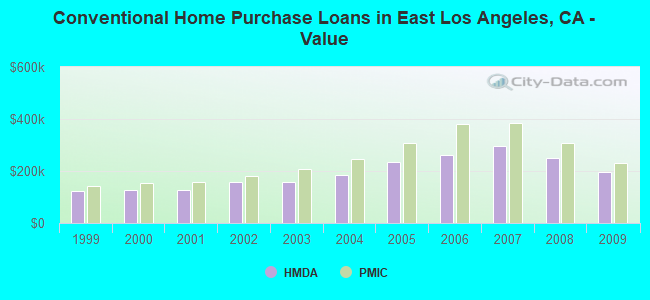
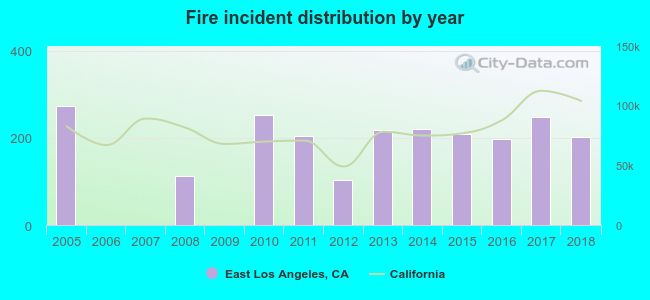 Based on the data from the years 2005 - 2018 the average number of fire incidents per year is 160. The highest number of fire incidents - 274 took place in 2005, and the least - 0 in 2006. The data has a dropping trend.
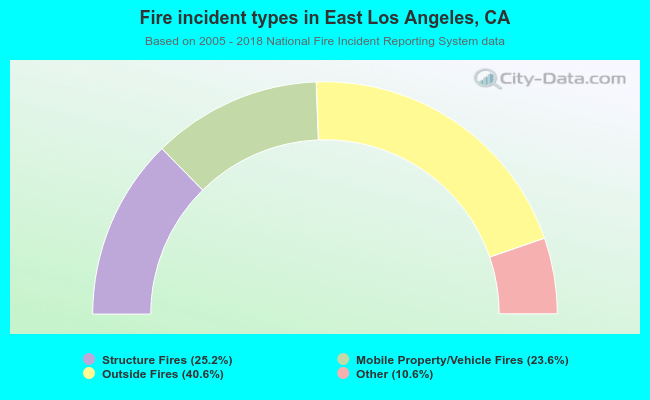 When looking into fire subcategories, the most incidents belonged to: Outside Fires (40.6%), and Structure Fires (25.2%).