Cayce, South Carolina Submit your own pictures of this city and show them to the world
OSM Map
General Map
Google Map
MSN Map
OSM Map
General Map
Google Map
MSN Map
OSM Map
General Map
Google Map
MSN Map
OSM Map
General Map
Google Map
MSN Map
Please wait while loading the map...
Population in 2022: 13,649 (100% urban, 0% rural). Population change since 2000: +12.3%Males: 6,859 Females: 6,790
March 2022 cost of living index in Cayce: 86.9 (less than average, U.S. average is 100) Percentage of residents living in poverty in 2022: 17.9%for White Non-Hispanic residents , 29.0% for Black residents , 18.6% for Hispanic or Latino residents , 4.7% for other race residents , 7.1% for two or more races residents )Business Search - 14 Million verified businesses
Data:
Median household income ($)
Median household income (% change since 2000)
Household income diversity
Ratio of average income to average house value (%)
Ratio of average income to average rent
Median household income ($) - White
Median household income ($) - Black or African American
Median household income ($) - Asian
Median household income ($) - Hispanic or Latino
Median household income ($) - American Indian and Alaska Native
Median household income ($) - Multirace
Median household income ($) - Other Race
Median household income for houses/condos with a mortgage ($)
Median household income for apartments without a mortgage ($)
Races - White alone (%)
Races - White alone (% change since 2000)
Races - Black alone (%)
Races - Black alone (% change since 2000)
Races - American Indian alone (%)
Races - American Indian alone (% change since 2000)
Races - Asian alone (%)
Races - Asian alone (% change since 2000)
Races - Hispanic (%)
Races - Hispanic (% change since 2000)
Races - Native Hawaiian and Other Pacific Islander alone (%)
Races - Native Hawaiian and Other Pacific Islander alone (% change since 2000)
Races - Two or more races (%)
Races - Two or more races (% change since 2000)
Races - Other race alone (%)
Races - Other race alone (% change since 2000)
Racial diversity
Unemployment (%)
Unemployment (% change since 2000)
Unemployment (%) - White
Unemployment (%) - Black or African American
Unemployment (%) - Asian
Unemployment (%) - Hispanic or Latino
Unemployment (%) - American Indian and Alaska Native
Unemployment (%) - Multirace
Unemployment (%) - Other Race
Population density (people per square mile)
Population - Males (%)
Population - Females (%)
Population - Males (%) - White
Population - Males (%) - Black or African American
Population - Males (%) - Asian
Population - Males (%) - Hispanic or Latino
Population - Males (%) - American Indian and Alaska Native
Population - Males (%) - Multirace
Population - Males (%) - Other Race
Population - Females (%) - White
Population - Females (%) - Black or African American
Population - Females (%) - Asian
Population - Females (%) - Hispanic or Latino
Population - Females (%) - American Indian and Alaska Native
Population - Females (%) - Multirace
Population - Females (%) - Other Race
Coronavirus confirmed cases (May 04, 2024)
Deaths caused by coronavirus (May 04, 2024)
Coronavirus confirmed cases (per 100k population) (May 04, 2024)
Deaths caused by coronavirus (per 100k population) (May 04, 2024)
Daily increase in number of cases (May 04, 2024)
Weekly increase in number of cases (May 04, 2024)
Cases doubled (in days) (May 04, 2024)
Hospitalized patients (Apr 18, 2022)
Negative test results (Apr 18, 2022)
Total test results (Apr 18, 2022)
COVID Vaccine doses distributed (per 100k population) (Sep 19, 2023)
COVID Vaccine doses administered (per 100k population) (Sep 19, 2023)
COVID Vaccine doses distributed (Sep 19, 2023)
COVID Vaccine doses administered (Sep 19, 2023)
Likely homosexual households (%)
Likely homosexual households (% change since 2000)
Likely homosexual households - Lesbian couples (%)
Likely homosexual households - Lesbian couples (% change since 2000)
Likely homosexual households - Gay men (%)
Likely homosexual households - Gay men (% change since 2000)
Cost of living index
Median gross rent ($)
Median contract rent ($)
Median monthly housing costs ($)
Median house or condo value ($)
Median house or condo value ($ change since 2000)
Mean house or condo value by units in structure - 1, detached ($)
Mean house or condo value by units in structure - 1, attached ($)
Mean house or condo value by units in structure - 2 ($)
Mean house or condo value by units in structure by units in structure - 3 or 4 ($)
Mean house or condo value by units in structure - 5 or more ($)
Mean house or condo value by units in structure - Boat, RV, van, etc. ($)
Mean house or condo value by units in structure - Mobile home ($)
Median house or condo value ($) - White
Median house or condo value ($) - Black or African American
Median house or condo value ($) - Asian
Median house or condo value ($) - Hispanic or Latino
Median house or condo value ($) - American Indian and Alaska Native
Median house or condo value ($) - Multirace
Median house or condo value ($) - Other Race
Median resident age
Resident age diversity
Median resident age - Males
Median resident age - Females
Median resident age - White
Median resident age - Black or African American
Median resident age - Asian
Median resident age - Hispanic or Latino
Median resident age - American Indian and Alaska Native
Median resident age - Multirace
Median resident age - Other Race
Median resident age - Males - White
Median resident age - Males - Black or African American
Median resident age - Males - Asian
Median resident age - Males - Hispanic or Latino
Median resident age - Males - American Indian and Alaska Native
Median resident age - Males - Multirace
Median resident age - Males - Other Race
Median resident age - Females - White
Median resident age - Females - Black or African American
Median resident age - Females - Asian
Median resident age - Females - Hispanic or Latino
Median resident age - Females - American Indian and Alaska Native
Median resident age - Females - Multirace
Median resident age - Females - Other Race
Commute - mean travel time to work (minutes)
Travel time to work - Less than 5 minutes (%)
Travel time to work - Less than 5 minutes (% change since 2000)
Travel time to work - 5 to 9 minutes (%)
Travel time to work - 5 to 9 minutes (% change since 2000)
Travel time to work - 10 to 19 minutes (%)
Travel time to work - 10 to 19 minutes (% change since 2000)
Travel time to work - 20 to 29 minutes (%)
Travel time to work - 20 to 29 minutes (% change since 2000)
Travel time to work - 30 to 39 minutes (%)
Travel time to work - 30 to 39 minutes (% change since 2000)
Travel time to work - 40 to 59 minutes (%)
Travel time to work - 40 to 59 minutes (% change since 2000)
Travel time to work - 60 to 89 minutes (%)
Travel time to work - 60 to 89 minutes (% change since 2000)
Travel time to work - 90 or more minutes (%)
Travel time to work - 90 or more minutes (% change since 2000)
Marital status - Never married (%)
Marital status - Now married (%)
Marital status - Separated (%)
Marital status - Widowed (%)
Marital status - Divorced (%)
Median family income ($)
Median family income (% change since 2000)
Median non-family income ($)
Median non-family income (% change since 2000)
Median per capita income ($)
Median per capita income (% change since 2000)
Median family income ($) - White
Median family income ($) - Black or African American
Median family income ($) - Asian
Median family income ($) - Hispanic or Latino
Median family income ($) - American Indian and Alaska Native
Median family income ($) - Multirace
Median family income ($) - Other Race
Median year house/condo built
Median year apartment built
Year house built - Built 2005 or later (%)
Year house built - Built 2000 to 2004 (%)
Year house built - Built 1990 to 1999 (%)
Year house built - Built 1980 to 1989 (%)
Year house built - Built 1970 to 1979 (%)
Year house built - Built 1960 to 1969 (%)
Year house built - Built 1950 to 1959 (%)
Year house built - Built 1940 to 1949 (%)
Year house built - Built 1939 or earlier (%)
Average household size
Household density (households per square mile)
Average household size - White
Average household size - Black or African American
Average household size - Asian
Average household size - Hispanic or Latino
Average household size - American Indian and Alaska Native
Average household size - Multirace
Average household size - Other Race
Occupied housing units (%)
Vacant housing units (%)
Owner occupied housing units (%)
Renter occupied housing units (%)
Vacancy status - For rent (%)
Vacancy status - For sale only (%)
Vacancy status - Rented or sold, not occupied (%)
Vacancy status - For seasonal, recreational, or occasional use (%)
Vacancy status - For migrant workers (%)
Vacancy status - Other vacant (%)
Residents with income below the poverty level (%)
Residents with income below 50% of the poverty level (%)
Children below poverty level (%)
Poor families by family type - Married-couple family (%)
Poor families by family type - Male, no wife present (%)
Poor families by family type - Female, no husband present (%)
Poverty status for native-born residents (%)
Poverty status for foreign-born residents (%)
Poverty among high school graduates not in families (%)
Poverty among people who did not graduate high school not in families (%)
Residents with income below the poverty level (%) - White
Residents with income below the poverty level (%) - Black or African American
Residents with income below the poverty level (%) - Asian
Residents with income below the poverty level (%) - Hispanic or Latino
Residents with income below the poverty level (%) - American Indian and Alaska Native
Residents with income below the poverty level (%) - Multirace
Residents with income below the poverty level (%) - Other Race
Air pollution - Air Quality Index (AQI)
Air pollution - CO
Air pollution - NO2
Air pollution - SO2
Air pollution - Ozone
Air pollution - PM10
Air pollution - PM25
Air pollution - Pb
Crime - Murders per 100,000 population
Crime - Rapes per 100,000 population
Crime - Robberies per 100,000 population
Crime - Assaults per 100,000 population
Crime - Burglaries per 100,000 population
Crime - Thefts per 100,000 population
Crime - Auto thefts per 100,000 population
Crime - Arson per 100,000 population
Crime - City-data.com crime index
Crime - Violent crime index
Crime - Property crime index
Crime - Murders per 100,000 population (5 year average)
Crime - Rapes per 100,000 population (5 year average)
Crime - Robberies per 100,000 population (5 year average)
Crime - Assaults per 100,000 population (5 year average)
Crime - Burglaries per 100,000 population (5 year average)
Crime - Thefts per 100,000 population (5 year average)
Crime - Auto thefts per 100,000 population (5 year average)
Crime - Arson per 100,000 population (5 year average)
Crime - City-data.com crime index (5 year average)
Crime - Violent crime index (5 year average)
Crime - Property crime index (5 year average)
1996 Presidential Elections Results (%) - Democratic Party (Clinton)
1996 Presidential Elections Results (%) - Republican Party (Dole)
1996 Presidential Elections Results (%) - Other
2000 Presidential Elections Results (%) - Democratic Party (Gore)
2000 Presidential Elections Results (%) - Republican Party (Bush)
2000 Presidential Elections Results (%) - Other
2004 Presidential Elections Results (%) - Democratic Party (Kerry)
2004 Presidential Elections Results (%) - Republican Party (Bush)
2004 Presidential Elections Results (%) - Other
2008 Presidential Elections Results (%) - Democratic Party (Obama)
2008 Presidential Elections Results (%) - Republican Party (McCain)
2008 Presidential Elections Results (%) - Other
2012 Presidential Elections Results (%) - Democratic Party (Obama)
2012 Presidential Elections Results (%) - Republican Party (Romney)
2012 Presidential Elections Results (%) - Other
2016 Presidential Elections Results (%) - Democratic Party (Clinton)
2016 Presidential Elections Results (%) - Republican Party (Trump)
2016 Presidential Elections Results (%) - Other
2020 Presidential Elections Results (%) - Democratic Party (Biden)
2020 Presidential Elections Results (%) - Republican Party (Trump)
2020 Presidential Elections Results (%) - Other
Ancestries Reported - Arab (%)
Ancestries Reported - Czech (%)
Ancestries Reported - Danish (%)
Ancestries Reported - Dutch (%)
Ancestries Reported - English (%)
Ancestries Reported - French (%)
Ancestries Reported - French Canadian (%)
Ancestries Reported - German (%)
Ancestries Reported - Greek (%)
Ancestries Reported - Hungarian (%)
Ancestries Reported - Irish (%)
Ancestries Reported - Italian (%)
Ancestries Reported - Lithuanian (%)
Ancestries Reported - Norwegian (%)
Ancestries Reported - Polish (%)
Ancestries Reported - Portuguese (%)
Ancestries Reported - Russian (%)
Ancestries Reported - Scotch-Irish (%)
Ancestries Reported - Scottish (%)
Ancestries Reported - Slovak (%)
Ancestries Reported - Subsaharan African (%)
Ancestries Reported - Swedish (%)
Ancestries Reported - Swiss (%)
Ancestries Reported - Ukrainian (%)
Ancestries Reported - United States (%)
Ancestries Reported - Welsh (%)
Ancestries Reported - West Indian (%)
Ancestries Reported - Other (%)
Educational Attainment - No schooling completed (%)
Educational Attainment - Less than high school (%)
Educational Attainment - High school or equivalent (%)
Educational Attainment - Less than 1 year of college (%)
Educational Attainment - 1 or more years of college (%)
Educational Attainment - Associate degree (%)
Educational Attainment - Bachelor's degree (%)
Educational Attainment - Master's degree (%)
Educational Attainment - Professional school degree (%)
Educational Attainment - Doctorate degree (%)
School Enrollment - Nursery, preschool (%)
School Enrollment - Kindergarten (%)
School Enrollment - Grade 1 to 4 (%)
School Enrollment - Grade 5 to 8 (%)
School Enrollment - Grade 9 to 12 (%)
School Enrollment - College undergrad (%)
School Enrollment - Graduate or professional (%)
School Enrollment - Not enrolled in school (%)
School enrollment - Public schools (%)
School enrollment - Private schools (%)
School enrollment - Not enrolled (%)
Median number of rooms in houses and condos
Median number of rooms in apartments
Housing units lacking complete plumbing facilities (%)
Housing units lacking complete kitchen facilities (%)
Density of houses
Urban houses (%)
Rural houses (%)
Households with people 60 years and over (%)
Households with people 65 years and over (%)
Households with people 75 years and over (%)
Households with one or more nonrelatives (%)
Households with no nonrelatives (%)
Population in households (%)
Family households (%)
Nonfamily households (%)
Population in families (%)
Family households with own children (%)
Median number of bedrooms in owner occupied houses
Mean number of bedrooms in owner occupied houses
Median number of bedrooms in renter occupied houses
Mean number of bedrooms in renter occupied houses
Median number of vehichles in owner occupied houses
Mean number of vehichles in owner occupied houses
Median number of vehichles in renter occupied houses
Mean number of vehichles in renter occupied houses
Mortgage status - with mortgage (%)
Mortgage status - with second mortgage (%)
Mortgage status - with home equity loan (%)
Mortgage status - with both second mortgage and home equity loan (%)
Mortgage status - without a mortgage (%)
Average family size
Average family size - White
Average family size - Black or African American
Average family size - Asian
Average family size - Hispanic or Latino
Average family size - American Indian and Alaska Native
Average family size - Multirace
Average family size - Other Race
Geographical mobility - Same house 1 year ago (%)
Geographical mobility - Moved within same county (%)
Geographical mobility - Moved from different county within same state (%)
Geographical mobility - Moved from different state (%)
Geographical mobility - Moved from abroad (%)
Place of birth - Born in state of residence (%)
Place of birth - Born in other state (%)
Place of birth - Native, outside of US (%)
Place of birth - Foreign born (%)
Housing units in structures - 1, detached (%)
Housing units in structures - 1, attached (%)
Housing units in structures - 2 (%)
Housing units in structures - 3 or 4 (%)
Housing units in structures - 5 to 9 (%)
Housing units in structures - 10 to 19 (%)
Housing units in structures - 20 to 49 (%)
Housing units in structures - 50 or more (%)
Housing units in structures - Mobile home (%)
Housing units in structures - Boat, RV, van, etc. (%)
House/condo owner moved in on average (years ago)
Renter moved in on average (years ago)
Year householder moved into unit - Moved in 1999 to March 2000 (%)
Year householder moved into unit - Moved in 1995 to 1998 (%)
Year householder moved into unit - Moved in 1990 to 1994 (%)
Year householder moved into unit - Moved in 1980 to 1989 (%)
Year householder moved into unit - Moved in 1970 to 1979 (%)
Year householder moved into unit - Moved in 1969 or earlier (%)
Means of transportation to work - Drove car alone (%)
Means of transportation to work - Carpooled (%)
Means of transportation to work - Public transportation (%)
Means of transportation to work - Bus or trolley bus (%)
Means of transportation to work - Streetcar or trolley car (%)
Means of transportation to work - Subway or elevated (%)
Means of transportation to work - Railroad (%)
Means of transportation to work - Ferryboat (%)
Means of transportation to work - Taxicab (%)
Means of transportation to work - Motorcycle (%)
Means of transportation to work - Bicycle (%)
Means of transportation to work - Walked (%)
Means of transportation to work - Other means (%)
Working at home (%)
Industry diversity
Most Common Industries - Agriculture, forestry, fishing and hunting, and mining (%)
Most Common Industries - Agriculture, forestry, fishing and hunting (%)
Most Common Industries - Mining, quarrying, and oil and gas extraction (%)
Most Common Industries - Construction (%)
Most Common Industries - Manufacturing (%)
Most Common Industries - Wholesale trade (%)
Most Common Industries - Retail trade (%)
Most Common Industries - Transportation and warehousing, and utilities (%)
Most Common Industries - Transportation and warehousing (%)
Most Common Industries - Utilities (%)
Most Common Industries - Information (%)
Most Common Industries - Finance and insurance, and real estate and rental and leasing (%)
Most Common Industries - Finance and insurance (%)
Most Common Industries - Real estate and rental and leasing (%)
Most Common Industries - Professional, scientific, and management, and administrative and waste management services (%)
Most Common Industries - Professional, scientific, and technical services (%)
Most Common Industries - Management of companies and enterprises (%)
Most Common Industries - Administrative and support and waste management services (%)
Most Common Industries - Educational services, and health care and social assistance (%)
Most Common Industries - Educational services (%)
Most Common Industries - Health care and social assistance (%)
Most Common Industries - Arts, entertainment, and recreation, and accommodation and food services (%)
Most Common Industries - Arts, entertainment, and recreation (%)
Most Common Industries - Accommodation and food services (%)
Most Common Industries - Other services, except public administration (%)
Most Common Industries - Public administration (%)
Occupation diversity
Most Common Occupations - Management, business, science, and arts occupations (%)
Most Common Occupations - Management, business, and financial occupations (%)
Most Common Occupations - Management occupations (%)
Most Common Occupations - Business and financial operations occupations (%)
Most Common Occupations - Computer, engineering, and science occupations (%)
Most Common Occupations - Computer and mathematical occupations (%)
Most Common Occupations - Architecture and engineering occupations (%)
Most Common Occupations - Life, physical, and social science occupations (%)
Most Common Occupations - Education, legal, community service, arts, and media occupations (%)
Most Common Occupations - Community and social service occupations (%)
Most Common Occupations - Legal occupations (%)
Most Common Occupations - Education, training, and library occupations (%)
Most Common Occupations - Arts, design, entertainment, sports, and media occupations (%)
Most Common Occupations - Healthcare practitioners and technical occupations (%)
Most Common Occupations - Health diagnosing and treating practitioners and other technical occupations (%)
Most Common Occupations - Health technologists and technicians (%)
Most Common Occupations - Service occupations (%)
Most Common Occupations - Healthcare support occupations (%)
Most Common Occupations - Protective service occupations (%)
Most Common Occupations - Fire fighting and prevention, and other protective service workers including supervisors (%)
Most Common Occupations - Law enforcement workers including supervisors (%)
Most Common Occupations - Food preparation and serving related occupations (%)
Most Common Occupations - Building and grounds cleaning and maintenance occupations (%)
Most Common Occupations - Personal care and service occupations (%)
Most Common Occupations - Sales and office occupations (%)
Most Common Occupations - Sales and related occupations (%)
Most Common Occupations - Office and administrative support occupations (%)
Most Common Occupations - Natural resources, construction, and maintenance occupations (%)
Most Common Occupations - Farming, fishing, and forestry occupations (%)
Most Common Occupations - Construction and extraction occupations (%)
Most Common Occupations - Installation, maintenance, and repair occupations (%)
Most Common Occupations - Production, transportation, and material moving occupations (%)
Most Common Occupations - Production occupations (%)
Most Common Occupations - Transportation occupations (%)
Most Common Occupations - Material moving occupations (%)
People in Group quarters - Institutionalized population (%)
People in Group quarters - Correctional institutions (%)
People in Group quarters - Federal prisons and detention centers (%)
People in Group quarters - Halfway houses (%)
People in Group quarters - Local jails and other confinement facilities (including police lockups) (%)
People in Group quarters - Military disciplinary barracks (%)
People in Group quarters - State prisons (%)
People in Group quarters - Other types of correctional institutions (%)
People in Group quarters - Nursing homes (%)
People in Group quarters - Hospitals/wards, hospices, and schools for the handicapped (%)
People in Group quarters - Hospitals/wards and hospices for chronically ill (%)
People in Group quarters - Hospices or homes for chronically ill (%)
People in Group quarters - Military hospitals or wards for chronically ill (%)
People in Group quarters - Other hospitals or wards for chronically ill (%)
People in Group quarters - Hospitals or wards for drug/alcohol abuse (%)
People in Group quarters - Mental (Psychiatric) hospitals or wards (%)
People in Group quarters - Schools, hospitals, or wards for the mentally retarded (%)
People in Group quarters - Schools, hospitals, or wards for the physically handicapped (%)
People in Group quarters - Institutions for the deaf (%)
People in Group quarters - Institutions for the blind (%)
People in Group quarters - Orthopedic wards and institutions for the physically handicapped (%)
People in Group quarters - Wards in general hospitals for patients who have no usual home elsewhere (%)
People in Group quarters - Wards in military hospitals for patients who have no usual home elsewhere (%)
People in Group quarters - Juvenile institutions (%)
People in Group quarters - Long-term care (%)
People in Group quarters - Homes for abused, dependent, and neglected children (%)
People in Group quarters - Residential treatment centers for emotionally disturbed children (%)
People in Group quarters - Training schools for juvenile delinquents (%)
People in Group quarters - Short-term care, detention or diagnostic centers for delinquent children (%)
People in Group quarters - Type of juvenile institution unknown (%)
People in Group quarters - Noninstitutionalized population (%)
People in Group quarters - College dormitories (includes college quarters off campus) (%)
People in Group quarters - Military quarters (%)
People in Group quarters - On base (%)
People in Group quarters - Barracks, unaccompanied personnel housing (UPH), (Enlisted/Officer), ;and similar group living quarters for military personnel (%)
People in Group quarters - Transient quarters for temporary residents (%)
People in Group quarters - Military ships (%)
People in Group quarters - Group homes (%)
People in Group quarters - Homes or halfway houses for drug/alcohol abuse (%)
People in Group quarters - Homes for the mentally ill (%)
People in Group quarters - Homes for the mentally retarded (%)
People in Group quarters - Homes for the physically handicapped (%)
People in Group quarters - Other group homes (%)
People in Group quarters - Religious group quarters (%)
People in Group quarters - Dormitories (%)
People in Group quarters - Agriculture workers' dormitories on farms (%)
People in Group quarters - Job Corps and vocational training facilities (%)
People in Group quarters - Other workers' dormitories (%)
People in Group quarters - Crews of maritime vessels (%)
People in Group quarters - Other nonhousehold living situations (%)
People in Group quarters - Other noninstitutional group quarters (%)
Residents speaking English at home (%)
Residents speaking English at home - Born in the United States (%)
Residents speaking English at home - Native, born elsewhere (%)
Residents speaking English at home - Foreign born (%)
Residents speaking Spanish at home (%)
Residents speaking Spanish at home - Born in the United States (%)
Residents speaking Spanish at home - Native, born elsewhere (%)
Residents speaking Spanish at home - Foreign born (%)
Residents speaking other language at home (%)
Residents speaking other language at home - Born in the United States (%)
Residents speaking other language at home - Native, born elsewhere (%)
Residents speaking other language at home - Foreign born (%)
Class of Workers - Employee of private company (%)
Class of Workers - Self-employed in own incorporated business (%)
Class of Workers - Private not-for-profit wage and salary workers (%)
Class of Workers - Local government workers (%)
Class of Workers - State government workers (%)
Class of Workers - Federal government workers (%)
Class of Workers - Self-employed workers in own not incorporated business and Unpaid family workers (%)
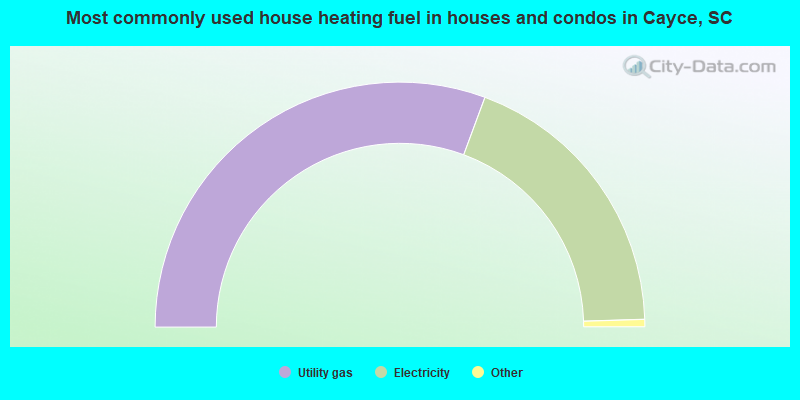
House heating fuel used in houses and condos - Utility gas (%)
House heating fuel used in houses and condos - Bottled, tank, or LP gas (%)
House heating fuel used in houses and condos - Electricity (%)
House heating fuel used in houses and condos - Fuel oil, kerosene, etc. (%)
House heating fuel used in houses and condos - Coal or coke (%)
House heating fuel used in houses and condos - Wood (%)
House heating fuel used in houses and condos - Solar energy (%)
House heating fuel used in houses and condos - Other fuel (%)
House heating fuel used in houses and condos - No fuel used (%)
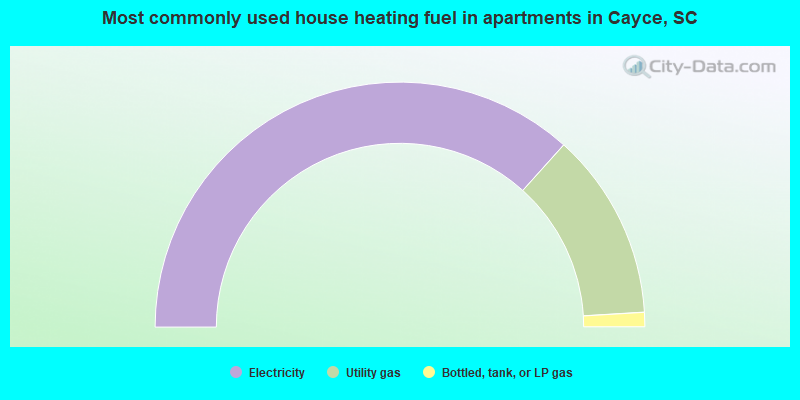
House heating fuel used in apartments - Utility gas (%)
House heating fuel used in apartments - Bottled, tank, or LP gas (%)
House heating fuel used in apartments - Electricity (%)
House heating fuel used in apartments - Fuel oil, kerosene, etc. (%)
House heating fuel used in apartments - Coal or coke (%)
House heating fuel used in apartments - Wood (%)
House heating fuel used in apartments - Solar energy (%)
House heating fuel used in apartments - Other fuel (%)
House heating fuel used in apartments - No fuel used (%)
Armed forces status - In Armed Forces (%)
Armed forces status - Civilian (%)
Armed forces status - Civilian - Veteran (%)
Armed forces status - Civilian - Nonveteran (%)
Fatal accidents locations in years 2005-2021
Fatal accidents locations in 2005
Fatal accidents locations in 2006
Fatal accidents locations in 2007
Fatal accidents locations in 2008
Fatal accidents locations in 2009
Fatal accidents locations in 2010
Fatal accidents locations in 2011
Fatal accidents locations in 2012
Fatal accidents locations in 2013
Fatal accidents locations in 2014
Fatal accidents locations in 2015
Fatal accidents locations in 2016
Fatal accidents locations in 2017
Fatal accidents locations in 2018
Fatal accidents locations in 2019
Fatal accidents locations in 2020
Fatal accidents locations in 2021
Alcohol use - People drinking some alcohol every month (%)
Alcohol use - People not drinking at all (%)
Alcohol use - Average days/month drinking alcohol
Alcohol use - Average drinks/week
Alcohol use - Average days/year people drink much
Audiometry - Average condition of hearing (%)
Audiometry - People that can hear a whisper from across a quiet room (%)
Audiometry - People that can hear normal voice from across a quiet room (%)
Audiometry - Ears ringing, roaring, buzzing (%)
Audiometry - Had a job exposure to loud noise (%)
Audiometry - Had off-work exposure to loud noise (%)
Blood Pressure & Cholesterol - Has high blood pressure (%)
Blood Pressure & Cholesterol - Checking blood pressure at home (%)
Blood Pressure & Cholesterol - Frequently checking blood cholesterol (%)
Blood Pressure & Cholesterol - Has high cholesterol level (%)
Consumer Behavior - Money monthly spent on food at supermarket/grocery store
Consumer Behavior - Money monthly spent on food at other stores
Consumer Behavior - Money monthly spent on eating out
Consumer Behavior - Money monthly spent on carryout/delivered foods
Consumer Behavior - Income spent on food at supermarket/grocery store (%)
Consumer Behavior - Income spent on food at other stores (%)
Consumer Behavior - Income spent on eating out (%)
Consumer Behavior - Income spent on carryout/delivered foods (%)
Current Health Status - General health condition (%)
Current Health Status - Blood donors (%)
Current Health Status - Has blood ever tested for HIV virus (%)
Current Health Status - Left-handed people (%)
Dermatology - People using sunscreen (%)
Diabetes - Diabetics (%)
Diabetes - Had a blood test for high blood sugar (%)
Diabetes - People taking insulin (%)
Diet Behavior & Nutrition - Diet health (%)
Diet Behavior & Nutrition - Milk product consumption (# of products/month)
Diet Behavior & Nutrition - Meals not home prepared (#/week)
Diet Behavior & Nutrition - Meals from fast food or pizza place (#/week)
Diet Behavior & Nutrition - Ready-to-eat foods (#/month)
Diet Behavior & Nutrition - Frozen meals/pizza (#/month)
Drug Use - People that ever used marijuana or hashish (%)
Drug Use - Ever used hard drugs (%)
Drug Use - Ever used any form of cocaine (%)
Drug Use - Ever used heroin (%)
Drug Use - Ever used methamphetamine (%)
Health Insurance - People covered by health insurance (%)
Kidney Conditions-Urology - Avg. # of times urinating at night
Medical Conditions - People with asthma (%)
Medical Conditions - People with anemia (%)
Medical Conditions - People with psoriasis (%)
Medical Conditions - People with overweight (%)
Medical Conditions - Elderly people having difficulties in thinking or remembering (%)
Medical Conditions - People who ever received blood transfusion (%)
Medical Conditions - People having trouble seeing even with glass/contacts (%)
Medical Conditions - People with arthritis (%)
Medical Conditions - People with gout (%)
Medical Conditions - People with congestive heart failure (%)
Medical Conditions - People with coronary heart disease (%)
Medical Conditions - People with angina pectoris (%)
Medical Conditions - People who ever had heart attack (%)
Medical Conditions - People who ever had stroke (%)
Medical Conditions - People with emphysema (%)
Medical Conditions - People with thyroid problem (%)
Medical Conditions - People with chronic bronchitis (%)
Medical Conditions - People with any liver condition (%)
Medical Conditions - People who ever had cancer or malignancy (%)
Mental Health - People who have little interest in doing things (%)
Mental Health - People feeling down, depressed, or hopeless (%)
Mental Health - People who have trouble sleeping or sleeping too much (%)
Mental Health - People feeling tired or having little energy (%)
Mental Health - People with poor appetite or overeating (%)
Mental Health - People feeling bad about themself (%)
Mental Health - People who have trouble concentrating on things (%)
Mental Health - People moving or speaking slowly or too fast (%)
Mental Health - People having thoughts they would be better off dead (%)
Oral Health - Average years since last visit a dentist
Oral Health - People embarrassed because of mouth (%)
Oral Health - People with gum disease (%)
Oral Health - General health of teeth and gums (%)
Oral Health - Average days a week using dental floss/device
Oral Health - Average days a week using mouthwash for dental problem
Oral Health - Average number of teeth
Pesticide Use - Households using pesticides to control insects (%)
Pesticide Use - Households using pesticides to kill weeds (%)
Physical Activity - People doing vigorous-intensity work activities (%)
Physical Activity - People doing moderate-intensity work activities (%)
Physical Activity - People walking or bicycling (%)
Physical Activity - People doing vigorous-intensity recreational activities (%)
Physical Activity - People doing moderate-intensity recreational activities (%)
Physical Activity - Average hours a day doing sedentary activities
Physical Activity - Average hours a day watching TV or videos
Physical Activity - Average hours a day using computer
Physical Functioning - People having limitations keeping them from working (%)
Physical Functioning - People limited in amount of work they can do (%)
Physical Functioning - People that need special equipment to walk (%)
Physical Functioning - People experiencing confusion/memory problems (%)
Physical Functioning - People requiring special healthcare equipment (%)
Prescription Medications - Average number of prescription medicines taking
Preventive Aspirin Use - Adults 40+ taking low-dose aspirin (%)
Reproductive Health - Vaginal deliveries (%)
Reproductive Health - Cesarean deliveries (%)
Reproductive Health - Deliveries resulted in a live birth (%)
Reproductive Health - Pregnancies resulted in a delivery (%)
Reproductive Health - Women breastfeeding newborns (%)
Reproductive Health - Women that had a hysterectomy (%)
Reproductive Health - Women that had both ovaries removed (%)
Reproductive Health - Women that have ever taken birth control pills (%)
Reproductive Health - Women taking birth control pills (%)
Reproductive Health - Women that have ever used Depo-Provera or injectables (%)
Reproductive Health - Women that have ever used female hormones (%)
Sexual Behavior - People 18+ that ever had sex (vaginal, anal, or oral) (%)
Sexual Behavior - Males 18+ that ever had vaginal sex with a woman (%)
Sexual Behavior - Males 18+ that ever performed oral sex on a woman (%)
Sexual Behavior - Males 18+ that ever had anal sex with a woman (%)
Sexual Behavior - Males 18+ that ever had any sex with a man (%)
Sexual Behavior - Females 18+ that ever had vaginal sex with a man (%)
Sexual Behavior - Females 18+ that ever performed oral sex on a man (%)
Sexual Behavior - Females 18+ that ever had anal sex with a man (%)
Sexual Behavior - Females 18+ that ever had any kind of sex with a woman (%)
Sexual Behavior - Average age people first had sex
Sexual Behavior - Average number of female sex partners in lifetime (males 18+)
Sexual Behavior - Average number of female vaginal sex partners in lifetime (males 18+)
Sexual Behavior - Average age people first performed oral sex on a woman (18+)
Sexual Behavior - Average number of woman performed oral sex on in lifetime (18+)
Sexual Behavior - Average number of male sex partners in lifetime (males 18+)
Sexual Behavior - Average number of male anal sex partners in lifetime (males 18+)
Sexual Behavior - Average age people first performed oral sex on a man (18+)
Sexual Behavior - Average number of male oral sex partners in lifetime (18+)
Sexual Behavior - People using protection when performing oral sex (%)
Sexual Behavior - Average number of times people have vaginal or anal sex a year
Sexual Behavior - People having sex without condom (%)
Sexual Behavior - Average number of male sex partners in lifetime (females 18+)
Sexual Behavior - Average number of male vaginal sex partners in lifetime (females 18+)
Sexual Behavior - Average number of female sex partners in lifetime (females 18+)
Sexual Behavior - Circumcised males 18+ (%)
Sleep Disorders - Average hours sleeping at night
Sleep Disorders - People that has trouble sleeping (%)
Smoking-Cigarette Use - People smoking cigarettes (%)
Taste & Smell - People 40+ having problems with smell (%)
Taste & Smell - People 40+ having problems with taste (%)
Taste & Smell - People 40+ that ever had wisdom teeth removed (%)
Taste & Smell - People 40+ that ever had tonsils teeth removed (%)
Taste & Smell - People 40+ that ever had a loss of consciousness because of a head injury (%)
Taste & Smell - People 40+ that ever had a broken nose or other serious injury to face or skull (%)
Taste & Smell - People 40+ that ever had two or more sinus infections (%)
Weight - Average height (inches)
Weight - Average weight (pounds)
Weight - Average BMI
Weight - People that are obese (%)
Weight - People that ever were obese (%)
Weight - People trying to lose weight (%)
According to our research of South Carolina and other state lists, there were 2 registered sex offenders living in Cayce, South Carolina as of May 04, 2024 . The ratio of all residents to sex offenders in Cayce is 7,051 to 1.The ratio of registered sex offenders to all residents in this city is much lower than the state average.
Officers per 1,000 residents here:
3.76South Carolina average:
2.21
Latest news from Cayce, SC collected exclusively by city-data.com from local newspapers, TV, and radio stations
Ancestries: American (10.9%), English (9.2%), Irish (5.5%), German (4.6%), Italian (2.5%), European (2.5%).
Current Local Time:
Land area: 10.9 square miles.
Population density: 1,252 people per square mile (low).
773 residents are foreign born (2.8% Asia , 1.9% Latin America , 0.8% Europe ).
This city:
5.5%South Carolina:
5.3%
Median real estate property taxes paid for housing units with mortgages in 2022: $869 (0.5%)Median real estate property taxes paid for housing units with no mortgage in 2022: $584 (0.4%)
Nearest city with pop. 50,000+: Columbia, SC
Nearest city with pop. 200,000+: Charlotte, NC
Nearest city with pop. 1,000,000+: Philadelphia, PA
Nearest cities:
Latitude: 33.96 N, Longitude: 81.07 W
Daytime population change due to commuting: +443 (+3.1%)Workers who live and work in this city: 1,048 (14.7%)
Area code commonly used in this area: 803
Single-family new house construction building permits:
2022: 3 buildings , average cost: $158,2002021: 12 buildings , average cost: $156,3002020: 9 buildings , average cost: $149,9002019: 12 buildings , average cost: $131,3002018: 7 buildings , average cost: $139,7002017: 8 buildings , average cost: $119,5002016: 29 buildings , average cost: $180,2002015: 43 buildings , average cost: $205,6002014: 36 buildings , average cost: $184,1002013: 45 buildings , average cost: $158,5002012: 57 buildings , average cost: $229,0002011: 19 buildings , average cost: $106,7002010: 16 buildings , average cost: $122,6002009: 36 buildings , average cost: $130,8002008: 104 buildings , average cost: $85,3002007: 54 buildings , average cost: $127,2002006: 75 buildings , average cost: $110,3002005: 78 buildings , average cost: $102,0002004: 22 buildings , average cost: $98,7002003: 14 buildings , average cost: $79,8002002: 7 buildings , average cost: $109,3002001: 8 buildings , average cost: $88,3002000: 3 buildings , average cost: $112,9001999: 14 buildings , average cost: $115,1001998: 19 buildings , average cost: $90,1001997: 14 buildings , average cost: $95,400Unemployment in December 2023: Here:
2.5%South Carolina:
3.1%
Population change in the 1990s: +461 (+3.9%).
Most common occupations in Cayce, SC (%)
Both Males Females
Other management occupations, except farmers and farm managers (4.8%)
Secretaries and administrative assistants (4.7%)
Other office and administrative support workers, including supervisors (4.6%)
Driver/sales workers and truck drivers (4.0%)
Other sales and related occupations, including supervisors (3.5%)
Sales representatives, services, wholesale and manufacturing (3.1%)
Financial clerks, except bookkeeping, accounting and auditing clerks (3.0%)
Driver/sales workers and truck drivers (7.5%)
Other management occupations, except farmers and farm managers (5.6%)
Sales representatives, services, wholesale and manufacturing (5.1%)
Other sales and related occupations, including supervisors (4.9%)
Electrical equipment mechanics and other installation, maintenance, and repair workers, including supervisors (4.9%)
Material recording, scheduling, dispatching, and distributing workers (4.1%)
Other production occupations, including supervisors (3.9%)
Secretaries and administrative assistants (9.1%)
Other office and administrative support workers, including supervisors (7.5%)
Cashiers (4.6%)
Other management occupations, except farmers and farm managers (3.9%)
Financial clerks, except bookkeeping, accounting and auditing clerks (3.8%)
Retail sales workers, except cashiers (3.4%)
Child care workers (3.4%)
Tornado activity:
Cayce-area historical tornado activity is slightly above South Carolina state average. It is 31% greater than the overall U.S. average.
On 3/28/1984, a category F4 (max. wind speeds 207-260 mph) tornado 31.7 miles away from the Cayce city center killed 5 people and injured 49 people and caused between $5,000,000 and $50,000,000 in damages.
On 8/16/1994, a category F3 (max. wind speeds 158-206 mph) tornado 9.7 miles away from the city center injured 40 people and caused between $5,000,000 and $50,000,000 in damages.
Earthquake activity:
Cayce-area historical earthquake activity is significantly above South Carolina state average. It is 26% smaller than the overall U.S. average. On 8/2/1974 at 08:52:09, a magnitude 4.9 (4.3 MB, 4.9 LG, Class: Light, Intensity: IV - V) earthquake occurred 81.8 miles away from Cayce center On 11/22/1974 at 05:25:55, a magnitude 4.7 (4.7 MB) earthquake occurred 90.8 miles away from the city center On 8/9/2020 at 12:07:37, a magnitude 5.1 (5.1 MW, Depth: 4.7 mi, Class: Moderate, Intensity: VI - VII) earthquake occurred 173.8 miles away from Cayce center On 8/23/2011 at 17:51:04, a magnitude 5.8 (5.8 MW, Depth: 3.7 mi) earthquake occurred 324.4 miles away from the city center On 8/21/1992 at 16:31:55, a magnitude 4.4 (4.1 MB, 4.1 LG, 4.4 LG, Depth: 6.2 mi) earthquake occurred 83.6 miles away from Cayce center On 2/15/2014 at 03:23:38, a magnitude 4.1 (4.1 MW, Depth: 3.2 mi) earthquake occurred 59.7 miles away from the city center Magnitude types: regional Lg-wave magnitude (LG), body-wave magnitude (MB), moment magnitude (MW) Natural disasters: The number of natural disasters in Lexington County (14) is near the US average (15).Major Disasters (Presidential) Declared: 6Emergencies Declared: 6Hurricanes: 5, Winter Storms: 3, Floods: 2, Storms: 2, Drought: 1, Ice Storm: 1, Tropical Storm: 1, Other: 1 (Note: some incidents may be assigned to more than one category). Hospitals and medical centers near Cayce: STILL HOPES EPISCOPAL RETIREMENT COMMUNITY (Nursing Home, about 2 miles away; WEST COLUMBIA, SC)
AGAPE COMMUNITY HOSPICE (Hospital, about 2 miles away; WEST COLUMBIA, SC)
DYNAMIC HOSPICE (Hospital, about 3 miles away; COLUMBIA, SC)
RELIANT HOSPICE, INC (Hospital, about 3 miles away; WEST COLUMBIA, SC)
AGAPE NURSING AND REHAB CENTER (Nursing Home, about 4 miles away; WEST COLUMBIA, SC)
FRESENIUS MEDICAL CARE MIDTOWN (Dialysis Facility, about 4 miles away; COLUMBIA, SC)
HEARTLAND OF LEXINGTON REHAB AND NURSING CENTER (Nursing Home, about 4 miles away; WEST COLUMBIA, SC)
Amtrak station near Cayce: 3 miles: COLUMBIA (850 PULASKI ST.) Services: ticket office, fully wheelchair accessible, enclosed waiting area, public restrooms, public payphones, vending machines, free short-term parking, free long-term parking, call for car rental service, taxi stand.
Colleges/universities with over 2000 students nearest to Cayce:
Midlands Technical College (about 3 miles; West Columbia, SC ; Full-time enrollment: 8,916)
University of South Carolina-Columbia (about 4 miles; Columbia, SC ; FT enrollment: 27,789)
Benedict College (about 5 miles; Columbia, SC ; FT enrollment: 3,039)
Orangeburg Calhoun Technical College (about 32 miles; Orangeburg, SC ; FT enrollment: 2,113)
South Carolina State University (about 35 miles; Orangeburg, SC ; FT enrollment: 3,481)
Central Carolina Technical College (about 41 miles; Sumter, SC ; FT enrollment: 3,108)
Denmark Technical College (about 46 miles; Denmark, SC ; FT enrollment: 2,050)
Public high school in Cayce: BROOKLAND-CAYCE SENIOR HIGH Location: 1300 STATE STREET, Grades: 9-12)
Public elementary/middle schools in Cayce: CLAUDE A. TAYLOR ELEMENTARY Students: 361, Location: 103 ANN LANE, Grades: 3-5)CYRIL B. BUSBEE CREATIVE ARTS ACADEMY Students: 342, Location: 501 BULLDOG BOULEVARD, Grades: 6-8)R. EARLE DAVIS EARLY CHILDHOOD CENTER FOR TECHNOLO Location: 2305 FRINK STREET, Grades: PK-2)
EAST POINT ACADEMY Location: 1340 KNOX ABBOTT DRIVE, Grades: PK-5, Charter school )
See full list of schools located in Cayce User-submitted facts and corrections:
Please update your listing for Glenforest School (private, Cayce) Glenforest School 1041 Harbor Drive West Columbia, South Carolina 29169 Toll Free: 1-800-849-7312 Voice: (803) 796-7622 Fax: (803) 796-1603 Email: glenforest at glenforest.org
Notable locations in Cayce: (A) , Columbia Speedway (B) , Cayce City Hall (C) , Cayce Department of Public Safety (D) . Display/hide their locations on the map
Shopping Centers: (1) , Parkland Shopping Center (2) , Three Fountains Plaza Shopping Center (3) , Town and Country Shopping Center (4) . Display/hide their locations on the map
Cemetery: (1) . Display/hide its location on the map
Reservoir: (A) . Display/hide its location on the map
Creeks: (A) , Sixmile Creek (B) , Dry Creek (C) . Display/hide their locations on the map
Park in Cayce: (1) . Display/hide its location on the map
Tourist attraction: (1) . Display/hide its approximate location on the map
Hotels: (1) , Masters Inn - Columbia Knox Abbott (613 Knox Abbott Dr) (2) , Country Inn & Suites by Carlson-Columbia Airport (1935 Airport Boulevard) (3) , Palmetto Motel (2310 Charleston Highway) (4) , Masters Inn - Columbia I-26 (2125 Commerce Dr) (5) , Ramada Limited Cayce (3020 Charleston Hwy.) (6) . Display/hide their approximate locations on the map
Birthplace of: Jerell Jamison - College basketball player (Charlotte 49ers), Jim Stuckey - College football player.
Lexington County has a predicted average indoor radon screening level less than 2 pCi/L (pico curies per liter) - Low Potential Drinking water stations with addresses in Cayce and their reported violations in the past:
CAYCE CITY OF (3210003) (Population served: 17,272, Surface water):
Past health violations:
MCL, Average - Between APR-2012 and JUN-2012, Contaminant: TTHM. Follow-up actions: St Public Notif requested (JUN-22-2012), St Violation/Reminder Notice (JUN-22-2012), St Public Notif received (JUL-18-2012), St Formal NOV issued (AUG-07-2012), St Show-cause Hearing (AUG-23-2012), St Admin Penalty assessed (SEP-25-2012), St AO (w/penalty) issued (SEP-25-2012), St Compliance achieved (JAN-01-2013)
Average household size: This city:
2.3 peopleSouth Carolina:
2.5 people
Percentage of family households: This city:
54.9%Whole state:
67.5%
Percentage of households with unmarried partners: This city:
6.6%Whole state:
6.0%
Likely homosexual households (counted as self-reported same-sex unmarried-partner households)
Lesbian couples: 0.5% of all households Gay men: 0.4% of all households
27 people in nursing homes in 2000
Banks with branches in Cayce (2011 data):
Bank of America, National Association: Park Place Branch at 440 Knox Abbott Drive, branch established on 1959/05/13. Info updated 2009/11/18: Bank assets: $1,451,969.3 mil, Deposits: $1,077,176.8 mil, headquarters in Charlotte, NC, positive income , 5782 total offices , Holding Company: Bank Of America Corporation
Southern First Bank, National Association: Knox Abbott Br at 190 Knox Abbott Drive, branch established on 2009/08/03. Info updated 2007/07/10: Bank assets: $766.3 mil, Deposits: $565.3 mil, headquarters in Greenville, SC, positive income , Commercial Lending Specialization, 6 total offices , Holding Company: Southern First Bancshares, Inc.
SCBT National Association: Knox Abbott Drive Branch at 1100 Knox Abbott Drive, branch established on 2003/11/20. Info updated 2011/08/01: Bank assets: $3,893.8 mil, Deposits: $3,257.7 mil, headquarters in Orangeburg, SC, positive income , Commercial Lending Specialization, 79 total offices , Holding Company: Scbt Financial Corporation
Wells Fargo Bank, National Association: Cayce Branch at 1131 Knox Abbott Drive, branch established on 1962/12/27. Info updated 2011/04/05: Bank assets: $1,161,490.0 mil, Deposits: $905,653.0 mil, headquarters in Sioux Falls, SD, positive income , 6395 total offices , Holding Company: Wells Fargo & Company
Congaree State Bank: Cayce Office Branch at 1201 Knox Abbott Drive, branch established on 2007/07/02. Info updated 2009/02/04: Bank assets: $122.0 mil, Deposits: $102.5 mil, headquarters in West Columbia, SC, positive income , Commercial Lending Specialization, 2 total offices , Holding Company: Congaree Bancshares, Inc.
Synovus Bank: Cayce Branch at 1245 Knox Abbott Drive, branch established on 1993/05/25. Info updated 2011/01/25: Bank assets: $26,863.3 mil, Deposits: $22,415.0 mil, headquarters in Columbus, GA, positive income , Commercial Lending Specialization, 296 total offices , Holding Company: Synovus Financial Corp.
First Citizens Bank and Trust Company, Inc.: Cayce Branch at 860 Knox Abbott Drive, branch established on 1908/01/01. Info updated 2011/08/24: Bank assets: $8,104.0 mil, Deposits: $6,880.8 mil, headquarters in Columbia, SC, positive income , 197 total offices , Holding Company: First Citizens Bancorporation, Inc.
For population 15 years and over in Cayce:
Never married: 41.2%Now married: 38.1%Separated: 2.0%Widowed: 5.9%Divorced: 12.9% For population 25 years and over in Cayce:
High school or higher: 94.7%Bachelor's degree or higher: 32.4%Graduate or professional degree: 13.5%Unemployed: 4.5%Mean travel time to work (commute): 18.2 minutes
Education Gini index (Inequality in education) Here:
10.2South Carolina average:
11.1
Religion statistics for Cayce, SC (based on Lexington County data)
Religion Adherents Congregations Evangelical Protestant 67,801 183 Mainline Protestant 43,909 78 Catholic 5,739 3 Black Protestant 4,706 26 Other 4,433 14 Orthodox 230 3 None 135,573 -
Source: Clifford Grammich, Kirk Hadaway, Richard Houseal, Dale E.Jones, Alexei Krindatch, Richie Stanley and Richard H.Taylor. 2012. 2010 U.S.Religion Census: Religious Congregations & Membership Study. Association of Statisticians of American Religious Bodies. Jones, Dale E., et al. 2002. Congregations and Membership in the United States 2000. Nashville, TN: Glenmary Research Center. Graphs represent county-level data
Food Environment Statistics: Number of grocery stores : 42Lexington County :
1.73 / 10,000 pop.State :
1.99 / 10,000 pop.
Number of supercenters and club stores : 4Here :
0.16 / 10,000 pop.South Carolina :
0.15 / 10,000 pop.
Number of convenience stores (no gas) : 13Here :
0.54 / 10,000 pop.South Carolina :
0.85 / 10,000 pop.
Number of convenience stores (with gas) : 124Lexington County :
5.11 / 10,000 pop.State :
5.38 / 10,000 pop.
Number of full-service restaurants : 188This county :
7.74 / 10,000 pop.South Carolina :
7.75 / 10,000 pop.
Adult diabetes rate : Lexington County :
8.9%South Carolina :
10.6%
Adult obesity rate : This county :
26.9%South Carolina :
29.4%
Low-income preschool obesity rate : Lexington County :
15.8%South Carolina :
13.4%
Health and Nutrition: Healthy diet rate : Cayce:
57.8%South Carolina:
49.2%
Average overall health of teeth and gums : Cayce:
60.8%South Carolina:
46.2%
Average BMI : Cayce:
27.9South Carolina:
29.0
People feeling badly about themselves : Here:
16.4%South Carolina:
20.4%
People not drinking alcohol at all : Cayce:
7.6%South Carolina:
11.0%
Average hours sleeping at night : Here:
7.0South Carolina:
6.8
Overweight people : This city:
33.2%South Carolina:
34.4%
General health condition : Here:
65.0%South Carolina:
55.6%
Average condition of hearing : Cayce:
83.3%South Carolina:
79.9%
More about Health and Nutrition of Cayce, SC Residents
Local government employment and payroll (March 2022)
Function
Full-time employees
Monthly full-time payroll
Average yearly full-time wage
Part-time employees
Monthly part-time payroll
Police Protection - Officers
39 $157,918 $48,590 0 $0 Sewerage
26 $120,150 $55,454 0 $0 Water Supply
22 $96,024 $52,377 0 $0 Other and Unallocable
20 $87,370 $52,422 0 $0 Solid Waste Management
17 $55,343 $39,066 0 $0 Parks and Recreation
14 $41,536 $35,602 0 $0 Firefighters
13 $50,937 $47,019 0 $0 Other Government Administration
8 $57,427 $86,141 3 $5,121 Police - Other
7 $24,081 $41,282 0 $0 Financial Administration
4 $24,891 $74,673 0 $0 Judicial and Legal
2 $6,618 $39,708 1 $1,460 Fire - Other
2 $9,851 $59,106 0 $0
Totals for Government
174 $732,146 $50,493 4 $6,581
Cayce government finances - Expenditure in 2021 (per resident):
Construction - Water Utilities: $2,732,000 ($200.16)
Current Operations - Sewerage: $7,053,000 ($516.74)
Police Protection: $5,698,000 ($417.47)Water Utilities: $3,834,000 ($280.90)Central Staff Services: $2,275,000 ($166.68)Local Fire Protection: $1,454,000 ($106.53)Solid Waste Management: $1,201,000 ($87.99)General - Other: $961,000 ($70.41)Parks and Recreation: $947,000 ($69.38)Regular Highways: $364,000 ($26.67)Financial Administration: $348,000 ($25.50)Judicial and Legal Services: $305,000 ($22.35)General Public Buildings: $116,000 ($8.50)Health - Other: $83,000 ($6.08)General - Interest on Debt: $19,000 ($1.39)
Intergovernmental to Local - Other - Financial Administration: $22,000 ($1.61)
Other - Judicial and Legal Services: $10,000 ($0.73)Other Capital Outlay - Parks and Recreation: $1,316,000 ($96.42)
General - Other: $470,000 ($34.43)Police Protection: $283,000 ($20.73)Local Fire Protection: $75,000 ($5.49)Central Staff Services: $33,000 ($2.42)General Public Building: $8,000 ($0.59)Total Salaries and Wages: $10,230,000 ($749.51)
Water Utilities - Interest on Debt: $2,687,000 ($196.86)
Cayce government finances - Revenue in 2021 (per resident):
Charges - Sewerage: $12,623,000 ($924.83)
Solid Waste Management: $731,000 ($53.56)Federal Intergovernmental - Other: $900,000 ($65.94)
Local Intergovernmental - Other: $82,000 ($6.01)
Miscellaneous - General Revenue - Other: $852,000 ($62.42)
Fines and Forfeits: $164,000 ($12.02)Interest Earnings: $17,000 ($1.25)Donations From Private Sources: $6,000 ($0.44)Sale of Property: $5,000 ($0.37)Revenue - Water Utilities: $6,012,000 ($440.47)
State Intergovernmental - Other: $413,000 ($30.26)
Tax - Occupation and Business License - Other: $6,200,000 ($454.25)
Property: $3,937,000 ($288.45)Other Selective Sales: $1,033,000 ($75.68)Other: $451,000 ($33.04)
Cayce government finances - Debt in 2021 (per resident):
Long Term Debt - Beginning Outstanding - Unspecified Public Purpose: $63,932,000 ($4684.01)
Outstanding Unspecified Public Purpose: $60,204,000 ($4410.87)Retired Unspecified Public Purpose: $3,728,000 ($273.13)
Cayce government finances - Cash and Securities in 2021 (per resident):
Other Funds - Cash and Securities: $12,613,000 ($924.10)
8.73% of this county's 2021 resident taxpayers lived in other counties in 2020 ($64,899 average adjusted gross income )
Here:
8.73%South Carolina average:
8.89%
0.03% of residents moved from foreign countries ($169 average AGI )Lexington County:
0.03%South Carolina average:
0.04%
Top counties from which taxpayers relocated into this county between 2020 and 2021:
7.10% of this county's 2020 resident taxpayers moved to other counties in 2021 ($56,656 average adjusted gross income )
Here:
7.10%South Carolina average:
7.46%
0.02% of residents moved to foreign countries ($100 average AGI )Lexington County:
0.02%South Carolina average:
0.03%
Top counties to which taxpayers relocated from this county between 2020 and 2021:
Businesses in Cayce, SC
Name Count Name Count
AMF Bowling 1 Pizza Hut 1 Ace Hardware 1 Red Lobster 1 Advance Auto Parts 1 Sprint Nextel 1 CVS 2 Subway 1 Dairy Queen 1 T-Mobile 2 FedEx 2 Taco Bell 1 H&R Block 1 U-Haul 2 Knights Inn 1 UPS 1 MasterBrand Cabinets 1 Waffle House 1 McDonald's 1 Wendy's 1
Strongest AM radio stations in Cayce:
WGCV (620 AM; 1 kW; CAYCE, SC; Owner: GLORY COMMUNICATIONS, INC.)
WBAJ (890 AM; daytime; 50 kW; BLYTHEWOOD, SC; Owner: FAMILY FIRST)
WISW (1320 AM; 5 kW; COLUMBIA, SC; Owner: CITADEL BROADCASTING COMPANY)
WVOC (560 AM; 5 kW; COLUMBIA, SC; Owner: CAPSTAR TX LIMITED PARTNERSHIP)
WQXL (1470 AM; 5 kW; COLUMBIA, SC; Owner: METRO COMMUNICATIONS, INCORP.)
WOIC (1230 AM; 1 kW; COLUMBIA, SC; Owner: URBAN RADIO OF SOUTH CAROLINA, LLC)
WCEO (840 AM; daytime; 50 kW; COLUMBIA, SC; Owner: EASTERN BROADCASTING GROUP, INC.)
WLGO (1170 AM; daytime; 10 kW; LEXINGTON, SC; Owner: LEVAS COMMUNICATIONS, LLC)
WCOS (1400 AM; 1 kW; COLUMBIA, SC; Owner: CAPSTAR TX LIMITED PARTNERSHIP)
WBCU (1460 AM; 50 kW; UNION, SC)
WAGL (1560 AM; daytime; 50 kW; LANCASTER, SC; Owner: PALMETTO BROADCASTING SYSTEM, INC.)
WLFJ (660 AM; daytime; 50 kW; GREENVILLE, SC; Owner: CLEAR CHANNEL BROADCASTING LICENSES, INC.)
WBT (1110 AM; 50 kW; CHARLOTTE, NC; Owner: JEFFERSON-PILOT COMMUNICATNS CO. OF NORTH CAROLINA)
Strongest FM radio stations in Cayce:
WMHK (89.7 FM; COLUMBIA, SC; Owner: COLUMBIA BIBLE COLLEGE B/CING CO.)
WLTY (96.7 FM; CAYCE, SC; Owner: CAPSTAR TX LIMITED PARTNERSHIP)
WUSC-FM (90.5 FM; COLUMBIA, SC; Owner: THE UNIVERSITY OF SOUTH CAROLINA)
WCOS-FM (97.5 FM; COLUMBIA, SC; Owner: CAPSTAR TX LIMITED PARTNERSHIP)
WYFV (88.7 FM; CAYCE, SC; Owner: BIBLE BROADCASTING NETWORK, INC.)
WARQ (93.5 FM; COLUMBIA, SC; Owner: URBAN RADIO OF SOUTH CAROLINA, LLC)
WNOK (104.7 FM; COLUMBIA, SC; Owner: CAPSTAR TX LIMITED PARTNERSHIP)
W240AX (95.9 FM; COLUMBIA, SC; Owner: BIBLE BROADCASTING NETWORK, INC.)
WLTR (91.3 FM; COLUMBIA, SC; Owner: SOUTH CAROLINA EDUCATIONAL TV COMMISSION)
WXBT (100.1 FM; WEST COLUMBIA, SC; Owner: CAPSTAR TX LIMITED PARTNERSHIP)
WOMG (103.1 FM; COLUMBIA, SC; Owner: CITADEL BROADCASTING COMPANY)
WTCB (106.7 FM; ORANGEBURG, SC; Owner: CITADEL BROADCASTING COMPANY)
WWDM (101.3 FM; SUMTER, SC; Owner: URBAN RADIO OF SOUTH CAROLINA, LLC)
WMFX (102.3 FM; ST. ANDREWS, SC; Owner: URBAN RADIO OF SOUTH CAROLINA, LLC)
WFMV (95.3 FM; SOUTH CONGAREE, SC; Owner: GLORY COMMUNICATIONS, INC.)
WLXC (98.5 FM; LEXINGTON, SC; Owner: CITADEL BROADCASTING COMPANY)
W207BQ (89.3 FM; COLUMBIA, SC; Owner: CALVARY CHAPEL OF TWIN FALLS, INC.)
WZMJ (93.1 FM; BATESBURG, SC; Owner: URBAN RADIO OF SOUTH CAROLINA, LLC)
WHXT (103.9 FM; ORANGEBURG, SC; Owner: URBAN RADIO OF SOUTH CAROLINA, LLC)
WQKI-FM (93.9 FM; ST. MATTHEWS, SC; Owner: MILLER COMMUNICATIONS, INC.)
TV broadcast stations around Cayce:
WRLK-TV (Channel 35; COLUMBIA, SC; Owner: SOUTH CAROLINA EDUCATIONAL TV COMMISSION)
WLTX (Channel 19; COLUMBIA, SC; Owner: PACIFIC AND SOUTHERN COMPANY, INC.)
WOLO-TV (Channel 25; COLUMBIA, SC; Owner: SOUTH CAROLINA BROADCASTING PARTNERS)
W21CA (Channel 21; COLUMBIA, SC; Owner: DOVE BROADCASTING, INC.)
WACH (Channel 57; COLUMBIA, SC; Owner: RAYCOM AMERICA, INC.)
WIS (Channel 10; COLUMBIA, SC; Owner: LIBCO, INC.)
WBHQ (Channel 63; SUMTER, SC; Owner: COLUMBIA BROADCASTING, INC.)
W39CL (Channel 39; COLUMBIA, SC; Owner: NATIONAL MINORITY T.V., INC.)
W67DP (Channel 67; COLUMBIA, SC; Owner: DOVE BROADCASTING, INC.)
W31BS (Channel 31; ORANGEBURG, SC; Owner: DOVE BROADCASTING INC.)
WRJA-TV (Channel 27; SUMTER, SC; Owner: SOUTH CAROLINA EDUCATIONAL TV COMMISSION)
National Bridge Inventory (NBI) Statistics 69 Number of bridges2,815ft / 858m Total length $20,079,000 Total costs2,168,898 Total average daily traffic232,852 Total average daily truck traffic
New bridges - historical statistics
4 1930-1939 2 1940-1949 14 1950-1959 3 1960-1969 35 1980-1989 6 1990-1999 3 2000-2009 2 2010-2019
See full National Bridge Inventory statistics for Cayce, SC
FCC Registered Antenna Towers: 114 (
See the full list of FCC Registered Antenna Towers in Cayce )
FCC Registered Broadcast Land Mobile Towers: 10 (
See the full list of FCC Registered Broadcast Land Mobile Towers in Cayce, SC )
FCC Registered Microwave Towers: 5
1801 Charleston Hwy (Lat: 33.964028 Lon: -81.078694), Overall height: 14 m, Call Sign: WME653, Assigned Frequencies: 950.000 MHz, Grant Date: 12/29/1992, Expiration Date: 12/01/2019, Cancellation Date: 11/13/2012, Registrant: Munn-Reese, Inc., 385 Airport Drive, Coldwater, MI 49036, Phone: (517) 278-7339 Citadel Studios, 1801 Charleston Highway (Lat: 33.963833 Lon: -81.078472), Type: Tower, Structure height: 26.2 m, Overall height: 26.3 m, Call Sign: WMW691, Assigned Frequencies: 951.625 MHz, Grant Date: 07/18/1995, Expiration Date: 12/01/2027, Registrant: Cumulus Media Inc., 3280 Peachtree Road, Nw, Suite 2300, Atlanta, GA 30305, Phone: (404) 260-6761, Fax: (404) 260-6961, Email:
2253 Love Chevrolet, Alongside L Avenue (Lat: 33.975139 Lon: -81.074417), Type: Building, Structure height: 32 m, Call Sign: WQRJ645, Assigned Frequencies: 11225.0 MHz, 19375.0 MHz, 11225.0 MHz, 19375.0 MHz, 19375.0 MHz, 19375.0 MHz, Grant Date: 05/29/2013, Expiration Date: 05/29/2023, Cancellation Date: 07/29/2023, Certifier: Rick Downs, Registrant: Pta-Fla, Inc., 8550 W. Desert Inn Rd. # 107, Las Vegas, NV 89117, Phone: (310) 798-7110, Fax: (877) 367-6824, Email:
2258 Emmanuel Church, Alongside Emmanuel Church Road (Lat: 33.946250 Lon: -81.167083), Type: Building, Structure height: 30.5 m, Call Sign: WQRJ659, Assigned Frequencies: 18065.0 MHz, 10735.0 MHz, 10735.0 MHz, 18065.0 MHz, 18065.0 MHz, 18065.0 MHz, Grant Date: 05/29/2013, Expiration Date: 05/29/2023, Cancellation Date: 07/29/2023, Certifier: Rick Downs, Registrant: Pta-Fla, Inc., 8550 W. Desert Inn Rd. # 107, Las Vegas, NV 89117, Phone: (310) 798-7110, Fax: (877) 367-6824, Email:
8CO0554A, 607 Old Taylor Road (Lat: 33.949694 Lon: -81.043778), Type: Ltower, Structure height: 76.2 m, Overall height: 79.2 m, Call Sign: WRAE409, Assigned Frequencies: 10755.0 MHz, 10835.0 MHz, 10755.0 MHz, 10835.0 MHz, 10755.0 MHz, 10835.0 MHz, 10755.0 MHz, 10835.0 MHz, 10755.0 MHz, 10835.0 MHz... (+6 more), Grant Date: 10/24/2017, Expiration Date: 11/26/2017, Cancellation Date: 01/27/2018, Certifier: David Werblow, Registrant: T-Mobile Usa, Inc., 12920 Se 38th Street, Bellevue, WA 98006, Phone: (425) 383-8401, Fax: (425) 383-4040, Email:
FCC Registered Amateur Radio Licenses: 46 (
See the full list of FCC Registered Amateur Radio Licenses in Cayce )
FAA Registered Aircraft: 14 (
See the full list of FAA Registered Aircraft in Cayce )
Home Mortgage Disclosure Act Aggregated Statistics For Year 2009(Based on 1 full and 5 partial tracts) A) FHA, FSA/RHS & VA B) Conventional C) Refinancings D) Home Improvement Loans E) Loans on Dwellings For 5+ Families F) Non-occupant Loans on G) Loans On Manufactured Number Average Value Number Average Value Number Average Value Number Average Value Number Average Value Number Average Value Number Average Value
LOANS ORIGINATED 34 $107,570 52 $124,363 130 $114,309 9 $51,126 1 $774,180 44 $125,356 0 $0 APPLICATIONS APPROVED, NOT ACCEPTED 1 $117,930 3 $106,323 12 $85,848 0 $0 0 $0 1 $108,040 1 $77,900 APPLICATIONS DENIED 11 $103,433 13 $120,780 49 $107,455 6 $41,208 0 $0 7 $109,626 6 $65,092 APPLICATIONS WITHDRAWN 6 $95,298 7 $85,223 39 $111,022 4 $37,080 0 $0 4 $88,288 0 $0 FILES CLOSED FOR INCOMPLETENESS 1 $99,790 1 $92,860 2 $140,210 0 $0 0 $0 0 $0 0 $0
Aggregated Statistics For Year 2008(Based on 1 full and 5 partial tracts) A) FHA, FSA/RHS & VA B) Conventional C) Refinancings D) Home Improvement Loans E) Loans on Dwellings For 5+ Families F) Non-occupant Loans on G) Loans On Manufactured Number Average Value Number Average Value Number Average Value Number Average Value Number Average Value Number Average Value Number Average Value
LOANS ORIGINATED 23 $103,642 70 $106,520 110 $106,892 14 $44,487 1 $294,130 41 $101,174 1 $110,720 APPLICATIONS APPROVED, NOT ACCEPTED 0 $0 9 $74,629 25 $86,738 1 $113,630 0 $0 8 $69,492 1 $46,300 APPLICATIONS DENIED 5 $89,024 13 $94,605 75 $98,248 30 $49,285 0 $0 11 $72,057 1 $11,650 APPLICATIONS WITHDRAWN 3 $83,123 10 $94,421 30 $102,971 5 $62,070 0 $0 4 $77,785 0 $0 FILES CLOSED FOR INCOMPLETENESS 0 $0 2 $187,270 8 $92,944 2 $70,515 0 $0 1 $58,500 0 $0
Aggregated Statistics For Year 2007(Based on 1 full and 5 partial tracts) A) FHA, FSA/RHS & VA B) Conventional C) Refinancings D) Home Improvement Loans E) Loans on Dwellings For 5+ Families F) Non-occupant Loans on G) Loans On Manufactured Number Average Value Number Average Value Number Average Value Number Average Value Number Average Value Number Average Value Number Average Value
LOANS ORIGINATED 10 $111,832 166 $95,988 146 $88,479 21 $44,104 1 $296,730 68 $72,691 3 $73,707 APPLICATIONS APPROVED, NOT ACCEPTED 0 $0 22 $75,959 33 $77,991 6 $17,448 0 $0 10 $57,792 2 $48,515 APPLICATIONS DENIED 0 $0 34 $94,921 129 $93,629 39 $69,591 1 $140,760 12 $78,478 3 $68,977 APPLICATIONS WITHDRAWN 0 $0 13 $101,909 51 $110,064 6 $83,407 1 $1,452,640 4 $68,890 0 $0 FILES CLOSED FOR INCOMPLETENESS 1 $94,720 4 $108,835 12 $94,382 0 $0 0 $0 1 $59,690 0 $0
Aggregated Statistics For Year 2006(Based on 1 full and 5 partial tracts) A) FHA, FSA/RHS & VA B) Conventional C) Refinancings D) Home Improvement Loans F) Non-occupant Loans on G) Loans On Manufactured Number Average Value Number Average Value Number Average Value Number Average Value Number Average Value Number Average Value
LOANS ORIGINATED 12 $112,802 142 $92,186 135 $82,859 17 $24,756 65 $82,626 1 $79,720 APPLICATIONS APPROVED, NOT ACCEPTED 0 $0 21 $94,973 27 $72,642 4 $32,620 11 $79,914 3 $55,373 APPLICATIONS DENIED 2 $64,485 50 $79,547 120 $91,140 34 $38,452 18 $103,654 20 $66,763 APPLICATIONS WITHDRAWN 0 $0 15 $77,012 52 $89,429 8 $57,846 8 $97,794 0 $0 FILES CLOSED FOR INCOMPLETENESS 0 $0 8 $158,149 12 $86,999 1 $14,000 2 $132,315 0 $0
Aggregated Statistics For Year 2005(Based on 1 full and 5 partial tracts) A) FHA, FSA/RHS & VA B) Conventional C) Refinancings D) Home Improvement Loans F) Non-occupant Loans on G) Loans On Manufactured Number Average Value Number Average Value Number Average Value Number Average Value Number Average Value Number Average Value
LOANS ORIGINATED 14 $100,513 162 $81,191 161 $86,605 16 $35,886 66 $73,236 1 $28,250 APPLICATIONS APPROVED, NOT ACCEPTED 0 $0 20 $65,840 36 $70,456 3 $17,833 5 $53,798 4 $33,342 APPLICATIONS DENIED 4 $79,980 46 $64,604 120 $87,339 23 $27,924 11 $82,625 15 $43,913 APPLICATIONS WITHDRAWN 0 $0 20 $127,295 64 $108,756 5 $163,572 9 $100,322 0 $0 FILES CLOSED FOR INCOMPLETENESS 0 $0 7 $106,343 23 $102,780 1 $66,860 4 $109,332 0 $0
Aggregated Statistics For Year 2004(Based on 1 full and 5 partial tracts) A) FHA, FSA/RHS & VA B) Conventional C) Refinancings D) Home Improvement Loans E) Loans on Dwellings For 5+ Families F) Non-occupant Loans on G) Loans On Manufactured Number Average Value Number Average Value Number Average Value Number Average Value Number Average Value Number Average Value Number Average Value
LOANS ORIGINATED 19 $100,197 151 $84,379 181 $80,172 15 $31,916 1 $2,579,830 74 $72,827 4 $30,282 APPLICATIONS APPROVED, NOT ACCEPTED 0 $0 16 $77,646 33 $81,044 3 $7,880 0 $0 1 $68,920 6 $30,277 APPLICATIONS DENIED 2 $79,350 21 $61,062 136 $84,224 19 $27,770 0 $0 24 $67,340 11 $45,869 APPLICATIONS WITHDRAWN 2 $85,295 18 $98,491 60 $85,288 5 $49,370 0 $0 12 $62,429 0 $0 FILES CLOSED FOR INCOMPLETENESS 0 $0 4 $69,485 15 $102,363 2 $19,600 0 $0 0 $0 0 $0
Aggregated Statistics For Year 2003(Based on 1 full and 5 partial tracts) A) FHA, FSA/RHS & VA B) Conventional C) Refinancings D) Home Improvement Loans F) Non-occupant Loans on Number Average Value Number Average Value Number Average Value Number Average Value Number Average Value
LOANS ORIGINATED 23 $90,654 126 $83,145 352 $83,977 19 $33,148 63 $62,748 APPLICATIONS APPROVED, NOT ACCEPTED 0 $0 19 $70,447 53 $68,796 3 $6,767 17 $43,094 APPLICATIONS DENIED 2 $61,990 35 $65,687 150 $90,006 5 $21,614 12 $80,046 APPLICATIONS WITHDRAWN 2 $85,175 22 $96,632 75 $95,603 2 $18,005 5 $46,928 FILES CLOSED FOR INCOMPLETENESS 0 $0 4 $59,488 42 $127,215 1 $21,850 1 $68,500
Aggregated Statistics For Year 2002(Based on 1 full and 5 partial tracts) A) FHA, FSA/RHS & VA B) Conventional C) Refinancings D) Home Improvement Loans E) Loans on Dwellings For 5+ Families F) Non-occupant Loans on Number Average Value Number Average Value Number Average Value Number Average Value Number Average Value Number Average Value
LOANS ORIGINATED 20 $94,214 108 $78,956 256 $76,426 9 $20,841 1 $256,520 67 $58,536 APPLICATIONS APPROVED, NOT ACCEPTED 1 $64,980 19 $48,636 44 $76,504 1 $9,470 0 $0 4 $83,545 APPLICATIONS DENIED 2 $70,635 44 $46,179 134 $72,497 7 $34,880 0 $0 10 $46,144 APPLICATIONS WITHDRAWN 1 $136,260 18 $73,654 59 $75,303 0 $0 0 $0 5 $64,080 FILES CLOSED FOR INCOMPLETENESS 0 $0 3 $60,593 17 $82,003 1 $5,830 0 $0 2 $105,085
Aggregated Statistics For Year 2001(Based on 1 full and 5 partial tracts) A) FHA, FSA/RHS & VA B) Conventional C) Refinancings D) Home Improvement Loans E) Loans on Dwellings For 5+ Families F) Non-occupant Loans on Number Average Value Number Average Value Number Average Value Number Average Value Number Average Value Number Average Value
LOANS ORIGINATED 21 $84,436 98 $76,247 211 $71,681 12 $13,469 1 $1,791,230 45 $48,640 APPLICATIONS APPROVED, NOT ACCEPTED 1 $118,540 25 $59,646 31 $71,591 3 $30,223 0 $0 6 $65,167 APPLICATIONS DENIED 2 $82,680 62 $50,363 105 $63,145 10 $14,029 0 $0 12 $56,364 APPLICATIONS WITHDRAWN 1 $116,670 15 $76,831 61 $66,610 3 $37,673 0 $0 8 $57,724 FILES CLOSED FOR INCOMPLETENESS 1 $70,990 3 $71,100 9 $53,680 0 $0 0 $0 0 $0
Aggregated Statistics For Year 2000(Based on 1 full and 5 partial tracts) A) FHA, FSA/RHS & VA B) Conventional C) Refinancings D) Home Improvement Loans F) Non-occupant Loans on Number Average Value Number Average Value Number Average Value Number Average Value Number Average Value
LOANS ORIGINATED 21 $73,703 104 $66,215 117 $58,955 10 $16,019 28 $50,488 APPLICATIONS APPROVED, NOT ACCEPTED 3 $39,223 33 $45,042 35 $60,094 5 $14,096 8 $43,194 APPLICATIONS DENIED 9 $43,043 133 $44,604 104 $56,432 15 $20,331 7 $46,016 APPLICATIONS WITHDRAWN 1 $60,500 15 $65,124 42 $56,326 3 $38,257 1 $90,960 FILES CLOSED FOR INCOMPLETENESS 1 $60,060 4 $71,258 24 $57,423 0 $0 1 $49,950
Aggregated Statistics For Year 1999(Based on 1 full and 5 partial tracts) A) FHA, FSA/RHS & VA B) Conventional C) Refinancings D) Home Improvement Loans F) Non-occupant Loans on Number Average Value Number Average Value Number Average Value Number Average Value Number Average Value
LOANS ORIGINATED 22 $69,199 122 $66,389 191 $61,126 33 $20,035 43 $49,309 APPLICATIONS APPROVED, NOT ACCEPTED 0 $0 47 $45,769 56 $61,367 6 $19,160 6 $52,253 APPLICATIONS DENIED 1 $53,790 208 $39,498 158 $57,896 17 $13,210 8 $45,656 APPLICATIONS WITHDRAWN 2 $47,235 18 $67,925 54 $58,141 1 $40,120 4 $46,100 FILES CLOSED FOR INCOMPLETENESS 0 $0 8 $85,125 42 $57,099 0 $0 3 $49,513
Detailed HMDA statistics for the following Tracts:
0201.00
, 0202.01 , 0202.02 , 0203.00 , 0206.04 , 0206.05
Private Mortgage Insurance Companies Aggregated Statistics For Year 2009(Based on 1 full and 4 partial tracts) A) Conventional B) Refinancings Number Average Value Number Average Value
LOANS ORIGINATED 5 $116,096 4 $128,492 APPLICATIONS APPROVED, NOT ACCEPTED 2 $181,465 0 $0 APPLICATIONS DENIED 2 $131,375 0 $0 APPLICATIONS WITHDRAWN 0 $0 0 $0 FILES CLOSED FOR INCOMPLETENESS 0 $0 0 $0
Aggregated Statistics For Year 2008(Based on 1 full and 5 partial tracts) A) Conventional B) Refinancings C) Non-occupant Loans on Number Average Value Number Average Value Number Average Value
LOANS ORIGINATED 35 $107,619 10 $115,620 5 $101,484 APPLICATIONS APPROVED, NOT ACCEPTED 10 $97,494 9 $105,442 0 $0 APPLICATIONS DENIED 2 $90,505 0 $0 1 $91,020 APPLICATIONS WITHDRAWN 1 $96,560 0 $0 0 $0 FILES CLOSED FOR INCOMPLETENESS 0 $0 0 $0 0 $0
Aggregated Statistics For Year 2007(Based on 1 full and 5 partial tracts) A) Conventional B) Refinancings C) Non-occupant Loans on Number Average Value Number Average Value Number Average Value
LOANS ORIGINATED 75 $101,452 22 $122,870 12 $64,431 APPLICATIONS APPROVED, NOT ACCEPTED 9 $84,776 0 $0 2 $51,990 APPLICATIONS DENIED 3 $85,423 0 $0 2 $86,985 APPLICATIONS WITHDRAWN 1 $119,200 0 $0 0 $0 FILES CLOSED FOR INCOMPLETENESS 2 $41,990 0 $0 2 $41,990
Aggregated Statistics For Year 2006(Based on 1 full and 5 partial tracts) A) Conventional B) Refinancings C) Non-occupant Loans on Number Average Value Number Average Value Number Average Value
LOANS ORIGINATED 31 $94,802 11 $89,135 7 $78,953 APPLICATIONS APPROVED, NOT ACCEPTED 7 $93,856 3 $124,280 2 $67,385 APPLICATIONS DENIED 0 $0 0 $0 0 $0 APPLICATIONS WITHDRAWN 5 $87,650 1 $148,270 1 $67,790 FILES CLOSED FOR INCOMPLETENESS 0 $0 0 $0 0 $0
Aggregated Statistics For Year 2005(Based on 1 full and 5 partial tracts) A) Conventional B) Refinancings C) Non-occupant Loans on Number Average Value Number Average Value Number Average Value
LOANS ORIGINATED 41 $97,431 9 $116,758 8 $80,778 APPLICATIONS APPROVED, NOT ACCEPTED 3 $81,817 2 $84,600 1 $43,990 APPLICATIONS DENIED 0 $0 1 $46,990 1 $46,990 APPLICATIONS WITHDRAWN 8 $83,988 1 $123,520 2 $44,365 FILES CLOSED FOR INCOMPLETENESS 0 $0 0 $0 0 $0
Aggregated Statistics For Year 2004(Based on 1 full and 5 partial tracts) A) Conventional B) Refinancings C) Non-occupant Loans on Number Average Value Number Average Value Number Average Value
LOANS ORIGINATED 44 $84,952 27 $91,014 17 $64,121 APPLICATIONS APPROVED, NOT ACCEPTED 5 $97,572 9 $121,643 2 $109,885 APPLICATIONS DENIED 1 $121,050 0 $0 0 $0 APPLICATIONS WITHDRAWN 2 $92,900 3 $81,400 1 $68,990 FILES CLOSED FOR INCOMPLETENESS 0 $0 0 $0 0 $0
Aggregated Statistics For Year 2003(Based on 1 full and 5 partial tracts) A) Conventional B) Refinancings C) Non-occupant Loans on Number Average Value Number Average Value Number Average Value
LOANS ORIGINATED 45 $93,863 53 $98,925 5 $59,154 APPLICATIONS APPROVED, NOT ACCEPTED 5 $101,288 10 $85,685 2 $92,420 APPLICATIONS DENIED 2 $92,635 3 $85,007 1 $78,670 APPLICATIONS WITHDRAWN 2 $81,240 8 $98,462 1 $56,990 FILES CLOSED FOR INCOMPLETENESS 2 $92,880 0 $0 0 $0
Aggregated Statistics For Year 2002(Based on 1 full and 5 partial tracts) A) Conventional B) Refinancings C) Non-occupant Loans on Number Average Value Number Average Value Number Average Value
LOANS ORIGINATED 52 $88,539 54 $88,294 12 $70,793 APPLICATIONS APPROVED, NOT ACCEPTED 3 $96,577 10 $89,352 0 $0 APPLICATIONS DENIED 0 $0 2 $86,225 0 $0 APPLICATIONS WITHDRAWN 2 $99,335 1 $120,120 1 $38,070 FILES CLOSED FOR INCOMPLETENESS 0 $0 0 $0 0 $0
Aggregated Statistics For Year 2001(Based on 1 full and 5 partial tracts) A) Conventional B) Refinancings C) Non-occupant Loans on Number Average Value Number Average Value Number Average Value
LOANS ORIGINATED 42 $84,070 30 $86,082 4 $47,448 APPLICATIONS APPROVED, NOT ACCEPTED 4 $77,002 6 $104,532 0 $0 APPLICATIONS DENIED 1 $60,460 2 $95,835 0 $0 APPLICATIONS WITHDRAWN 2 $70,745 4 $64,282 0 $0 FILES CLOSED FOR INCOMPLETENESS 0 $0 4 $134,332 0 $0
Aggregated Statistics For Year 2000(Based on 1 full and 5 partial tracts) A) Conventional B) Refinancings C) Non-occupant Loans on Number Average Value Number Average Value Number Average Value
LOANS ORIGINATED 45 $74,318 9 $68,159 5 $59,888 APPLICATIONS APPROVED, NOT ACCEPTED 4 $59,958 2 $112,815 0 $0 APPLICATIONS DENIED 0 $0 0 $0 0 $0 APPLICATIONS WITHDRAWN 4 $72,795 1 $57,670 0 $0 FILES CLOSED FOR INCOMPLETENESS 0 $0 0 $0 0 $0
Aggregated Statistics For Year 1999(Based on 1 full and 5 partial tracts) A) Conventional B) Refinancings C) Non-occupant Loans on Number Average Value Number Average Value Number Average Value
LOANS ORIGINATED 38 $84,499 21 $85,371 2 $61,225 APPLICATIONS APPROVED, NOT ACCEPTED 3 $84,130 8 $92,366 1 $70,960 APPLICATIONS DENIED 0 $0 2 $61,380 0 $0 APPLICATIONS WITHDRAWN 0 $0 3 $92,667 0 $0 FILES CLOSED FOR INCOMPLETENESS 0 $0 1 $76,950 0 $0
Detailed PMIC statistics for the following Tracts:
0201.00
, 0202.01 , 0202.02 , 0203.00 , 0206.04 , 0206.05 Fire-safe hotels and motels in Cayce, South Carolina:
Country Hearth Inn & Suites, 3020 Charleston Hwy, Cayce, South Carolina 29033 Phone: (803) 794-7500, Fax: (803) 794-7500
Country Inn & Suites - Columbia Airport, 2245 Airport Blvd, Cayce, South Carolina 29033 Phone: (803) 794-6200, Fax: (803) 794-6270
Courtyard Columbia Cayce, 1125 Ft Congaree Trl, Cayce, South Carolina 29033 Phone: (803) 794-7033, Fax: (803) 794-9929
All 3 fire-safe hotels and motels in Cayce, South Carolina
Most common first names in Cayce, SC among deceased individuals Name Count Lived (average)
James 81 68.9 years John 80 71.3 years William 72 71.5 years Mary 65 76.6 years Charles 48 69.4 years Robert 42 71.8 years Willie 40 68.8 years George 36 70.9 years Thomas 33 68.4 years Annie 30 79.4 years
Most common last names in Cayce, SC among deceased individuals Last name Count Lived (average)
Smith 46 75.6 years Brown 35 67.0 years Johnson 29 74.2 years Jones 28 68.6 years Williams 25 67.2 years Davis 24 67.9 years Jackson 18 66.5 years Taylor 17 70.2 years Sharpe 15 72.8 years Lucas 14 78.6 years
Cayce compared to South Carolina state average:
Median house value below state average. Unemployed percentage significantly below state average. Length of stay since moving in significantly above state average. House age above state average. Number of college students above state average.
#52 on the list of "Top 101 cities with the most residents born in Other Northern America (population 500+)"
#96 on the list of "Top 101 cities with the highest number of police officers per 1000 residents (population 5,000+)"
#49 (29201) on the list of "Top 101 zip codes with the most offices of lawyers in 2005"
#20 on the list of "Top 101 counties with the lowest percentage of residents that drank alcohol in the past 30 days"
#27 on the list of "Top 101 counties with the highest percentage of residents that keep firearms around their homes"
#46 on the list of "Top 101 counties with the highest average weight of females"
#100 on the list of "Top 101 counties with the most Mainline Protestant adherents"
Top Patent Applicants
Charles E. Holland (5)
Licia Wu (3)
Stephen Harris (2)
Yuriy Aleshin (2)
Samir Y. Garzon (2)
Jeffrey M. Mccarty (2)
Steven K. Krooswyk (1)
Eric M. Carter (1)
John H. Gerdes, Jr. (1)
Daniel E. Ross (1)
Total of 27 patent applications in 2008-2024.
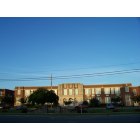
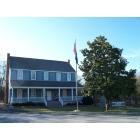
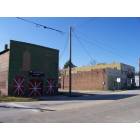
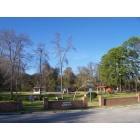
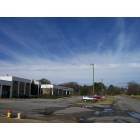
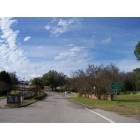

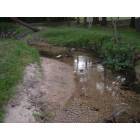
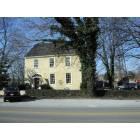
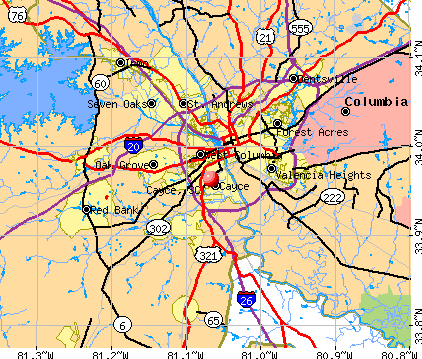


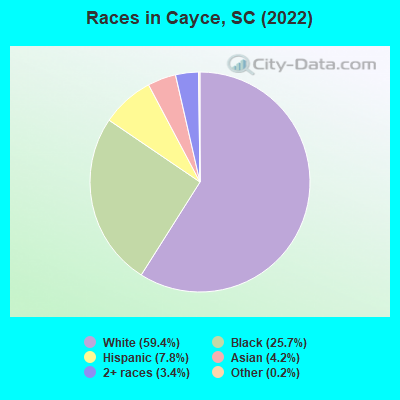
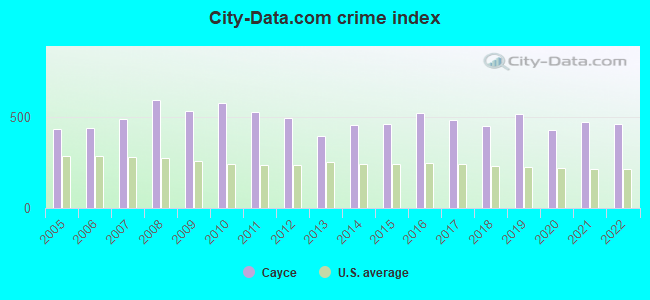
 Recent articles from our blog. Our writers, many of them Ph.D. graduates or candidates, create easy-to-read articles on a wide variety of topics.

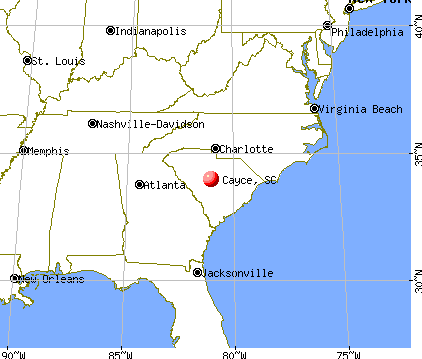
 (4.9 miles
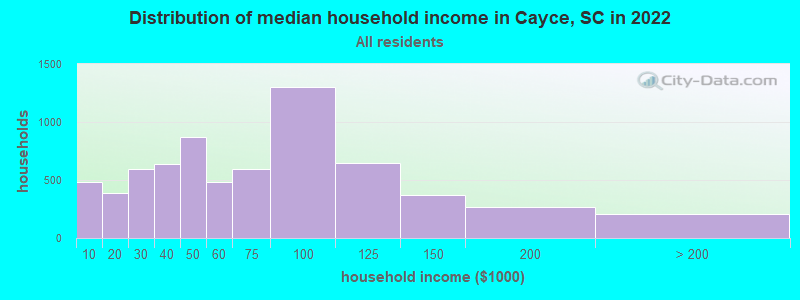
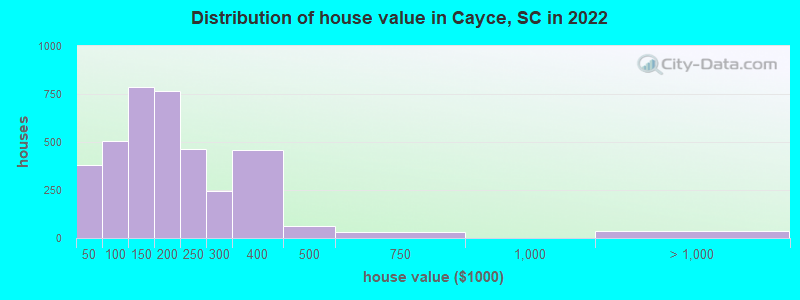
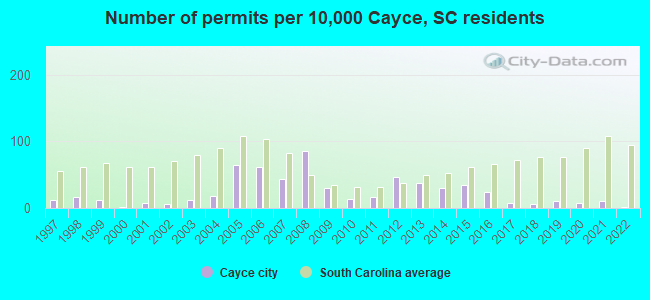
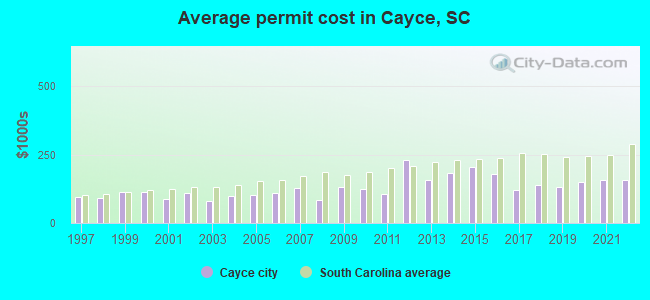
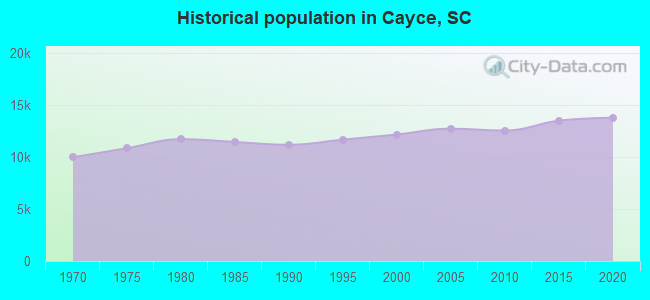
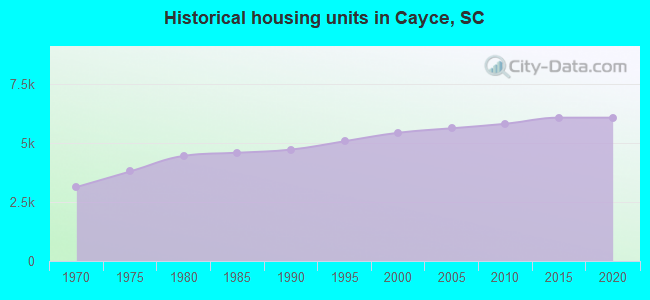
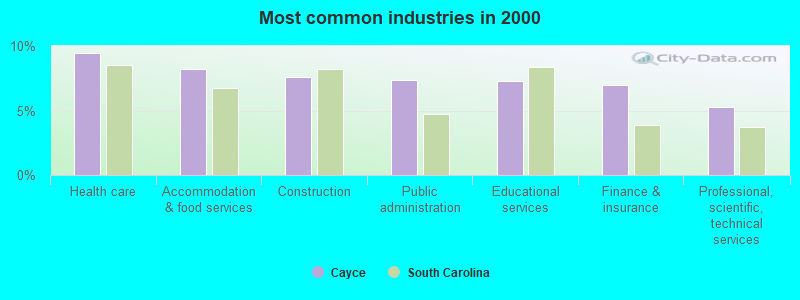
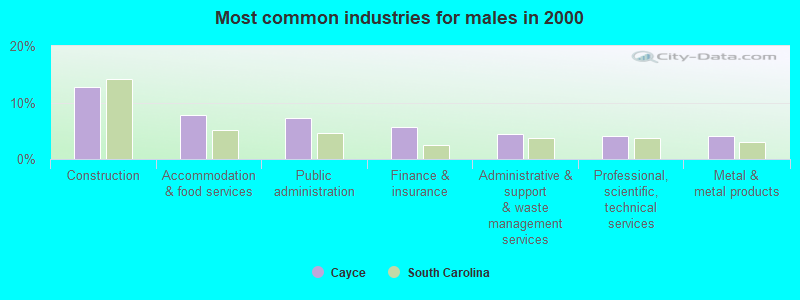
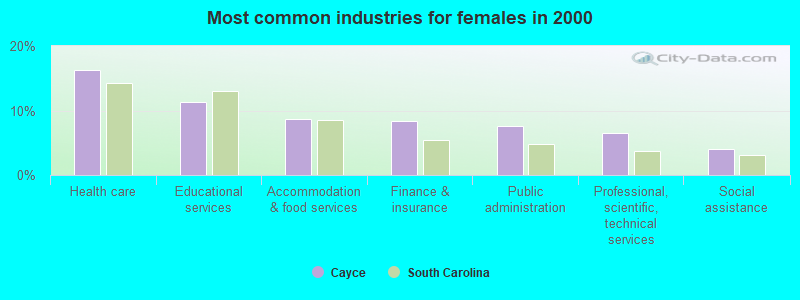
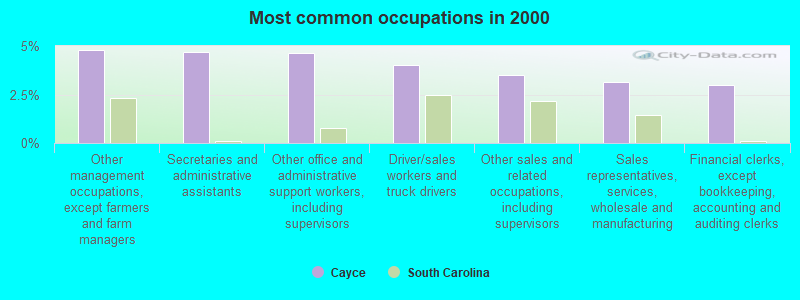
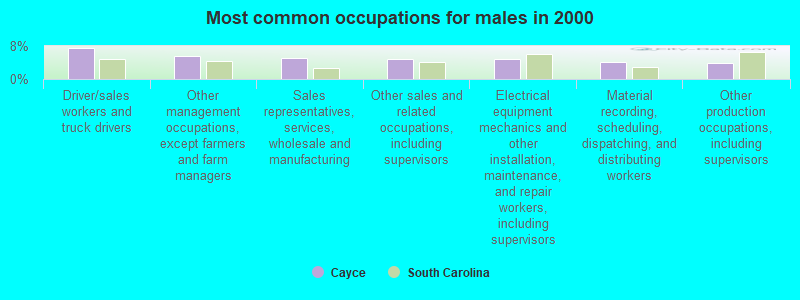
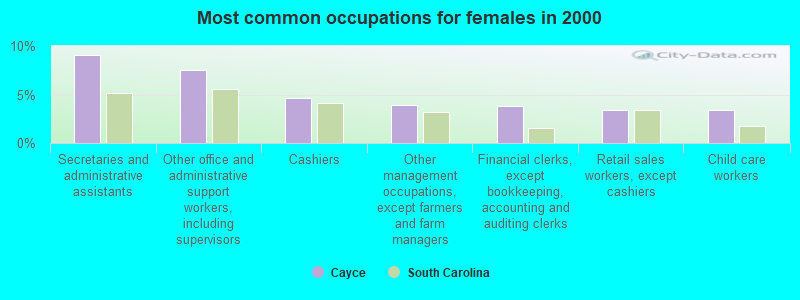
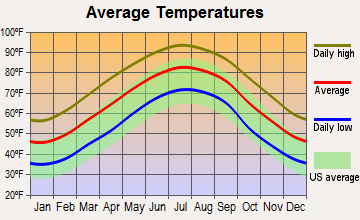
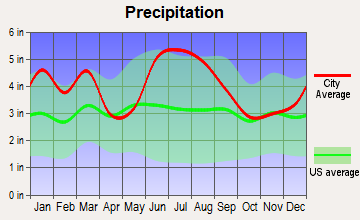
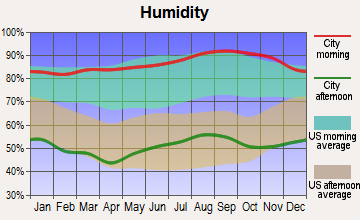
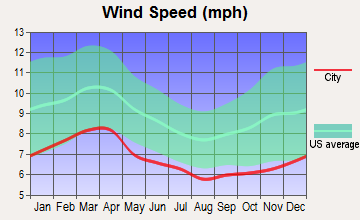
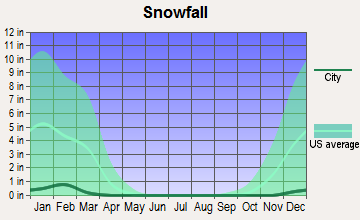

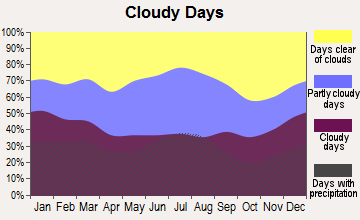
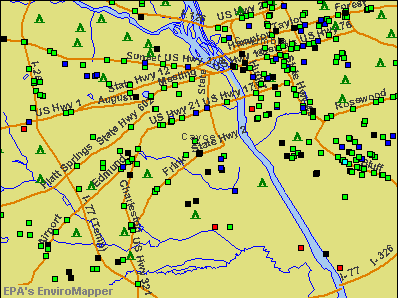

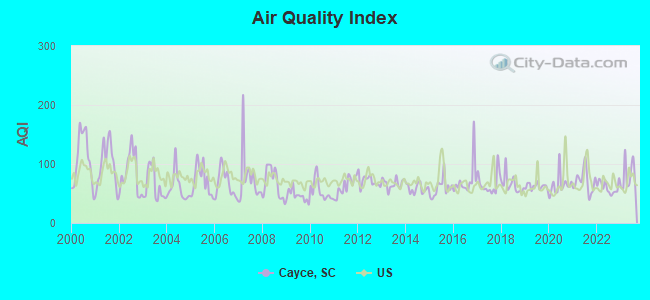
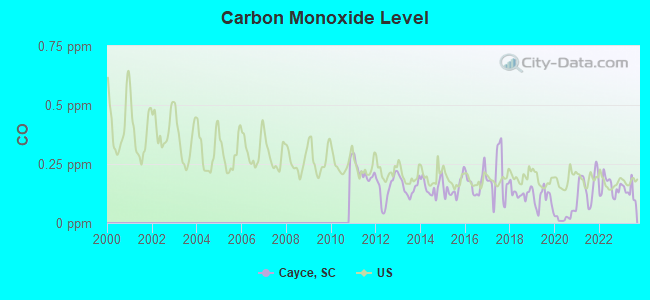
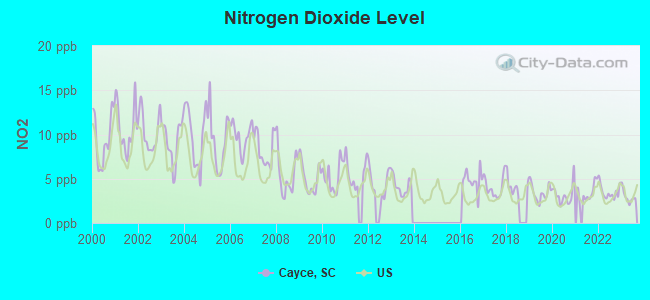
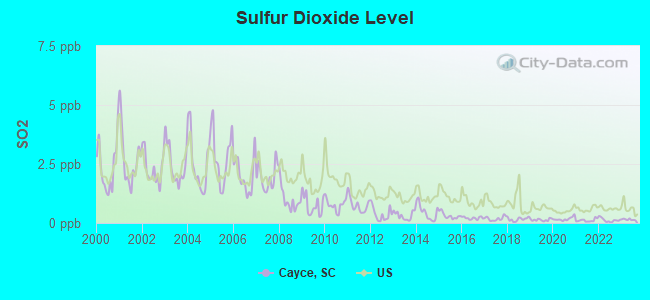
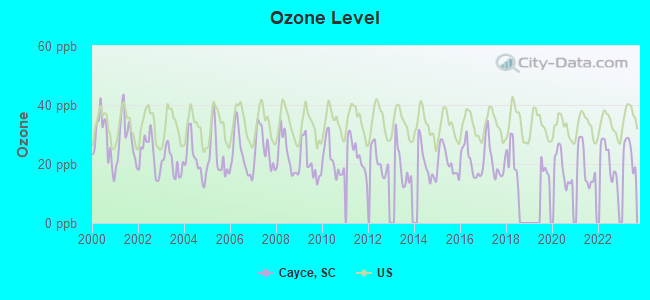
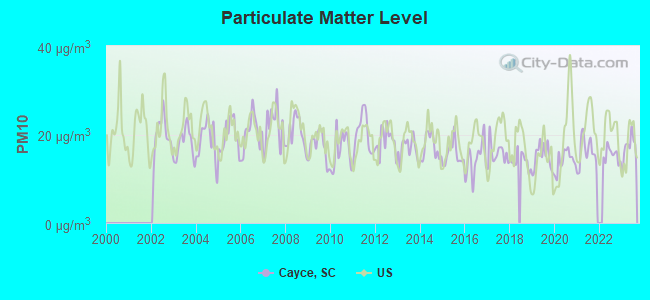
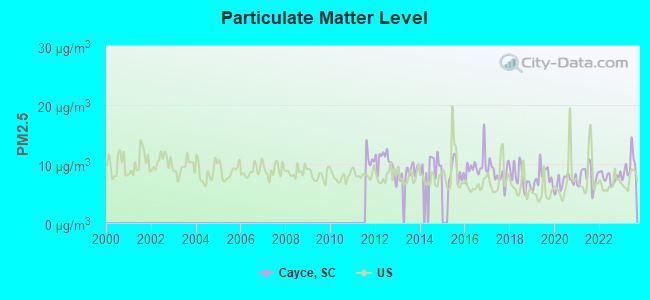
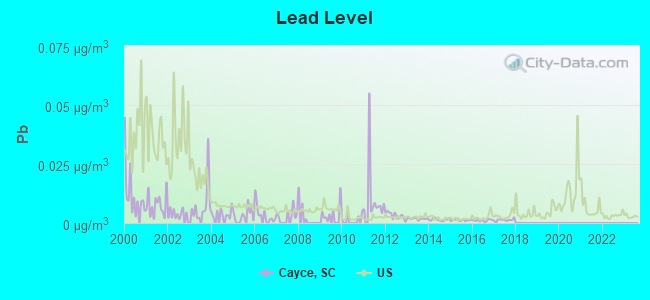
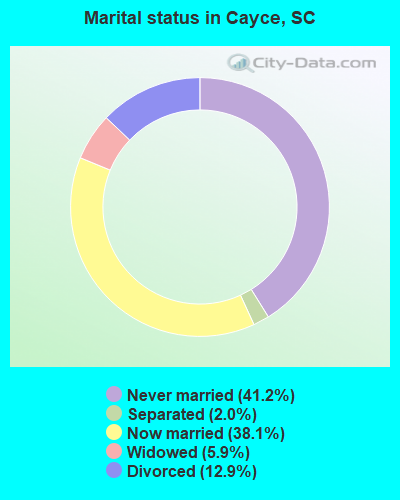
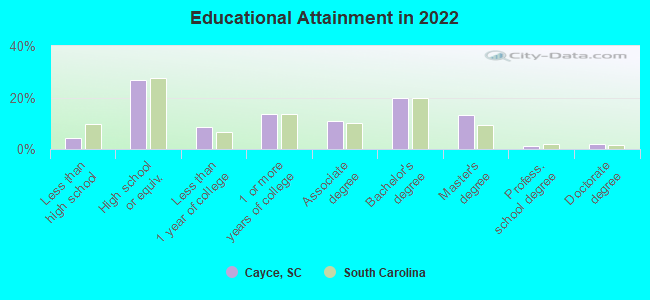
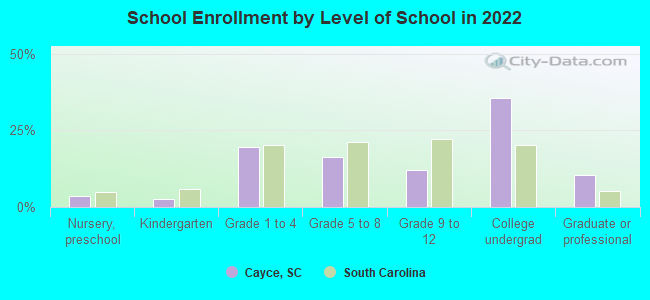
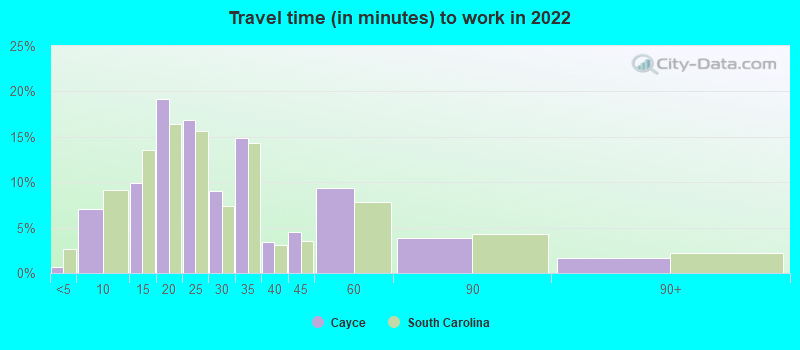
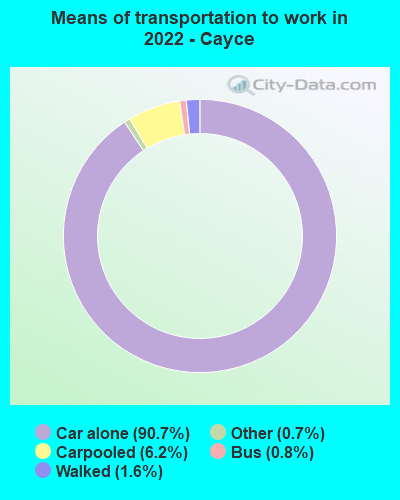
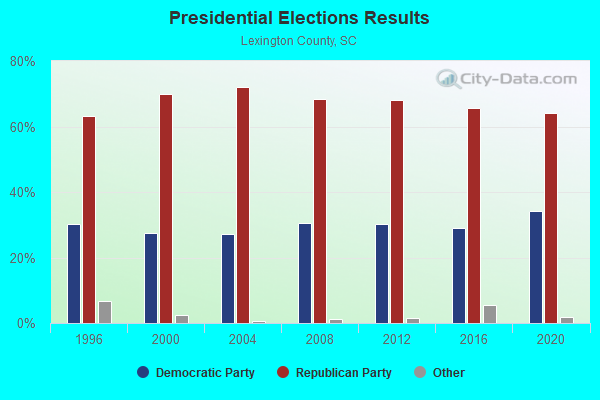
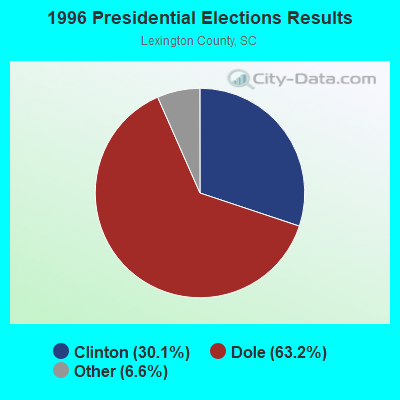


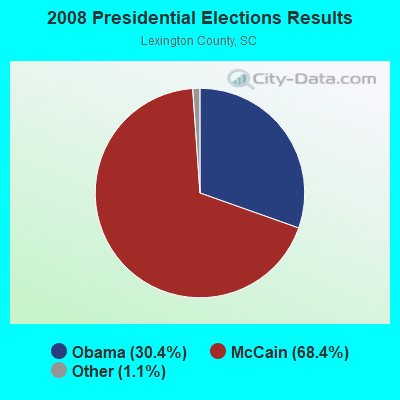
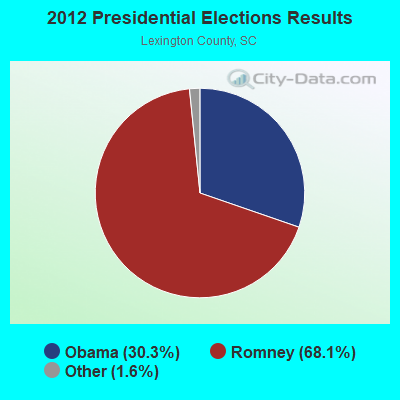
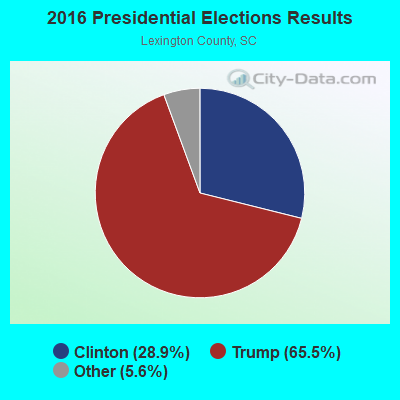
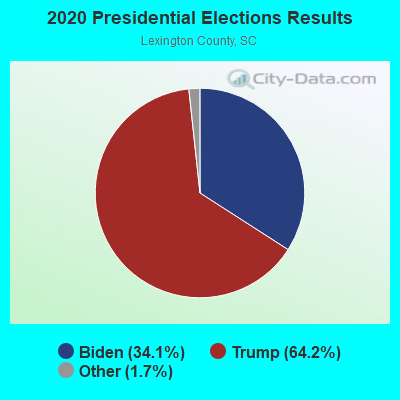
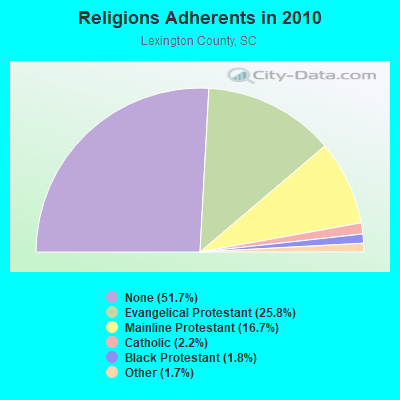
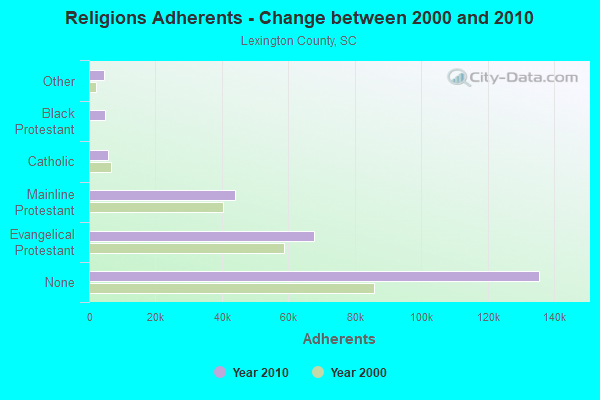
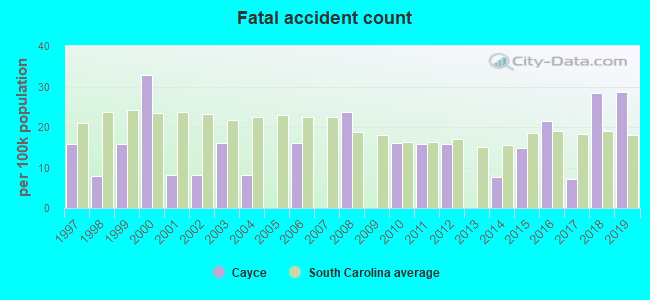
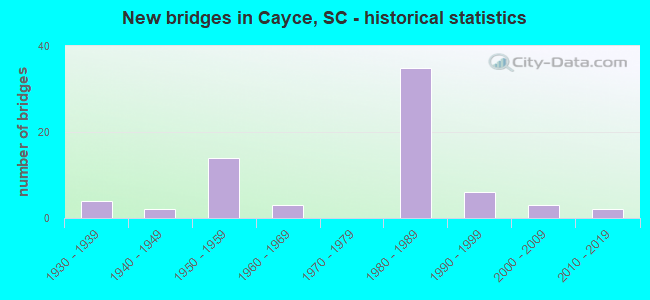
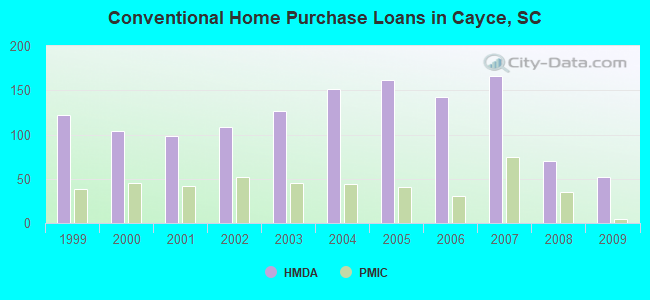
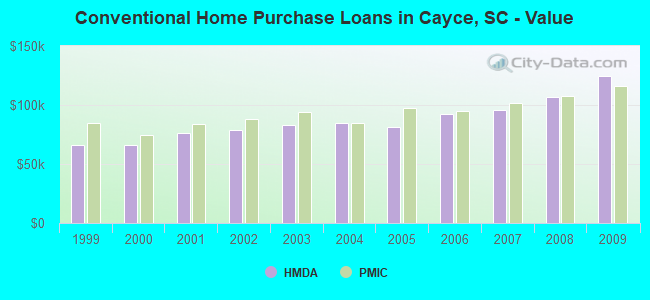
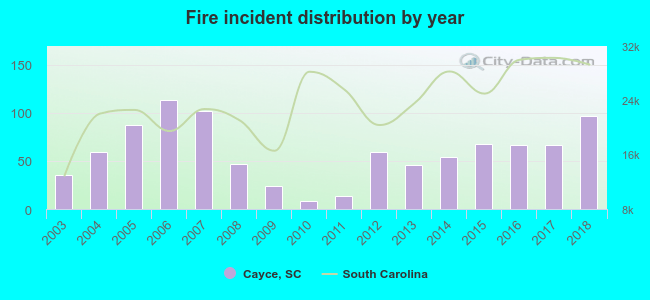 Based on the data from the years 2003 - 2018 the average number of fire incidents per year is 59. The highest number of fires - 113 took place in 2006, and the least - 8 in 2010. The data has a rising trend.
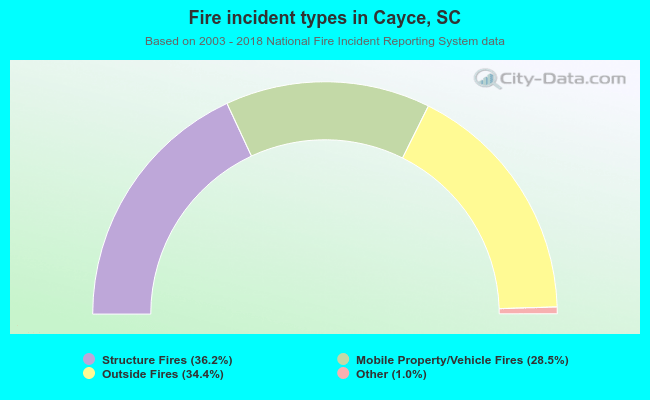 When looking into fire subcategories, the most reports belonged to: Structure Fires (36.2%), and Outside Fires (34.4%).