Percentage of residents living in poverty in 2022: 3.9%
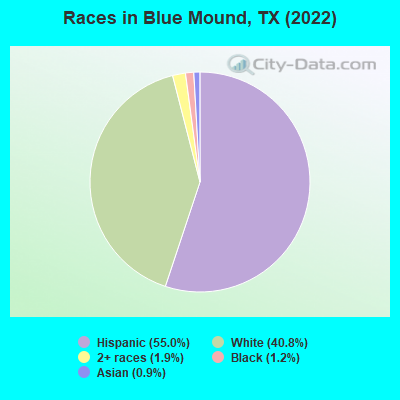
(5.7% for White Non-Hispanic residents, 46.7% for Black residents, 1.4% for Hispanic or Latino residents, 0.8% for two or more races residents)
According to our research of Texas and other state lists, there were 3 registered sex offenders living in Blue Mound, Texas as of May 09, 2024. The ratio of all residents to sex offenders in Blue Mound is 1,126 to 1. The ratio of registered sex offenders to all residents in this city is much lower than the state average.
Crime rates in Blue Mound by year
Type
2009
2010
2011
2012
2013
2014
2015
2016
2017
2018
2019
2020
2021
2022
Murders (per 100,000)
0 (0.0)
0 (0.0)
0 (0.0)
0 (0.0)
0 (0.0)
0 (0.0)
0 (0.0)
0 (0.0)
0 (0.0)
0 (0.0)
0 (0.0)
0 (0.0)
0 (0.0)
0 (0.0)
Rapes (per 100,000)
0 (0.0)
0 (0.0)
0 (0.0)
0 (0.0)
1 (40.6)
0 (0.0)
1 (40.1)
0 (0.0)
0 (0.0)
0 (0.0)
0 (0.0)
0 (0.0)
0 (0.0)
0 (0.0)
Robberies (per 100,000)
2 (84.7)
0 (0.0)
0 (0.0)
0 (0.0)
0 (0.0)
0 (0.0)
0 (0.0)
0 (0.0)
1 (39.8)
1 (40.1)
0 (0.0)
0 (0.0)
0 (0.0)
0 (0.0)
Assaults (per 100,000)
1 (42.3)
2 (83.5)
0 (0.0)
0 (0.0)
0 (0.0)
1 (40.3)
0 (0.0)
0 (0.0)
2 (79.6)
2 (80.2)
5 (201.2)
1 (40.8)
2 (83.0)
3 (129.0)
Burglaries (per 100,000)
30 (1,270)
26 (1,086)
14 (572.8)
3 (120.8)
2 (81.1)
3 (121.0)
2 (80.2)
4 (159.4)
2 (79.6)
2 (80.2)
9 (362.2)
3 (122.4)
1 (41.5)
2 (86.0)
Thefts (per 100,000)
22 (931.4)
20 (835.4)
36 (1,473)
21 (845.4)
21 (851.6)
9 (362.9)
28 (1,123)
18 (717.4)
15 (596.7)
10 (401.0)
13 (523.1)
8 (326.5)
0 (0.0)
2 (86.0)
Auto thefts (per 100,000)
5 (211.7)
5 (208.9)
1 (40.9)
0 (0.0)
2 (81.1)
5 (201.6)
6 (240.6)
4 (159.4)
4 (159.1)
6 (240.6)
8 (321.9)
11 (449.0)
2 (83.0)
3 (129.0)
Arson (per 100,000)
2 (84.7)
0 (0.0)
0 (0.0)
0 (0.0)
0 (0.0)
0 (0.0)
0 (0.0)
0 (0.0)
0 (0.0)
0 (0.0)
1 (40.2)
0 (0.0)
0 (0.0)
0 (0.0)
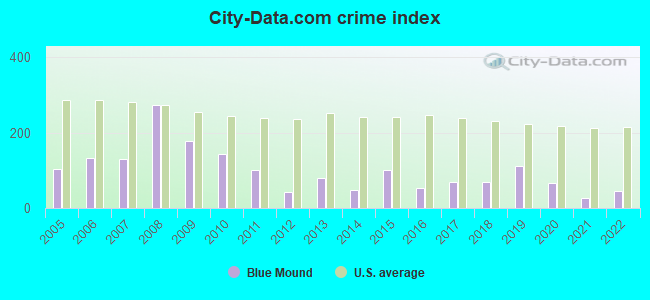
City-Data.com crime index
177.0
142.9
102.3
42.3
78.7
47.2
101.8
52.6
70.0
69.0
112.3
65.7
26.1
45.6
The City-Data.com crime index weighs serious crimes and violent crimes more heavily. Higher means more crime, U.S. average is 246.1. It adjusts for the number of visitors and daily workers commuting into cities.
Latest news from Blue Mound, TX collected exclusively by city-data.com from local newspapers, TV, and radio stations
Ancestries: American (5.6%), Dutch (4.7%), European (2.2%), English (2.1%), German (1.8%), Swedish (1.3%).
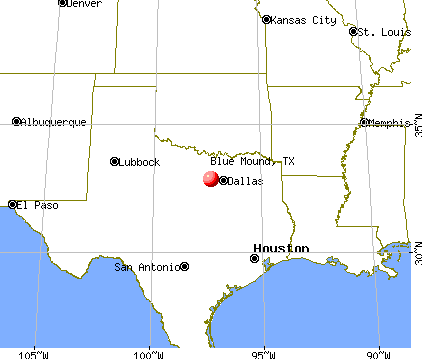
Current Local Time: CST time zone
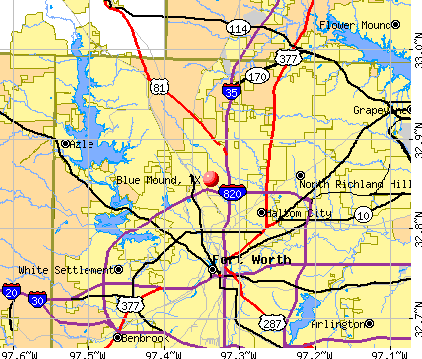
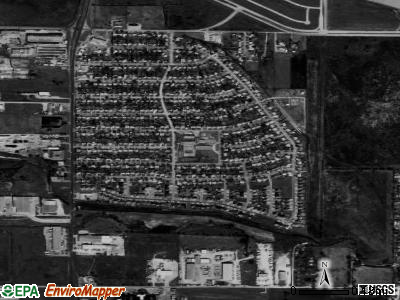
Land area: 0.54 square miles.
Population density: 4,340 people per square mile (average).
525 residents are foreign born (18.3% Latin America).
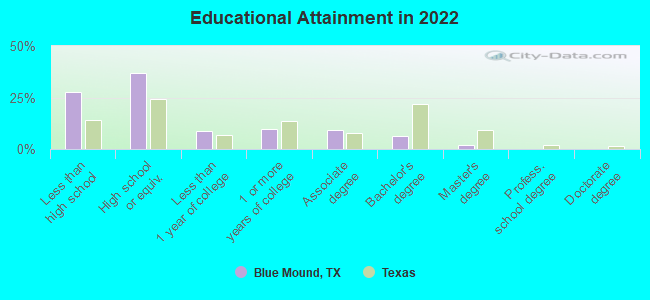
This city:
19.6%
Texas:
17.1%
Median real estate property taxes paid for housing units with mortgages in 2022: $2,869 (1.5%) Median real estate property taxes paid for housing units with no mortgage in 2022: $2,671 (1.5%)
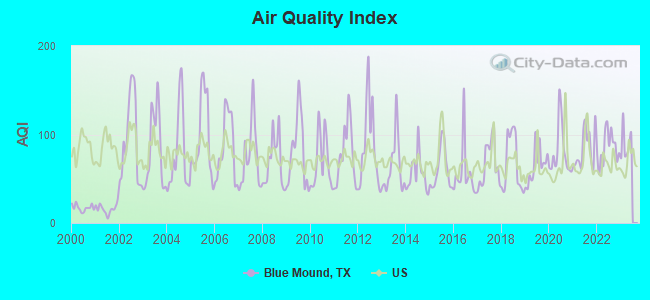
Air Quality Index (AQI) level in 2022 was 85.1. This is about average.
City:
85.1
U.S.:
72.6
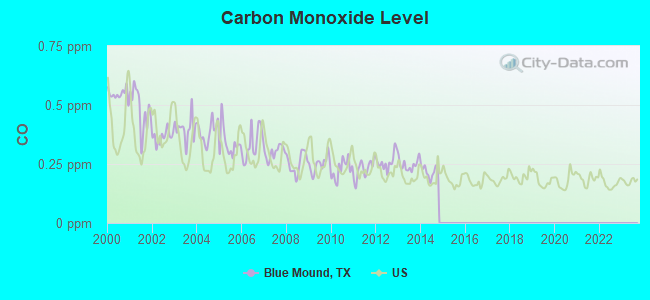
Carbon Monoxide (CO) [ppm] level in 2014 was 0.219. This is about average.Closest monitor was 3.6 miles away from the city center.
City:
0.219
U.S.:
0.251
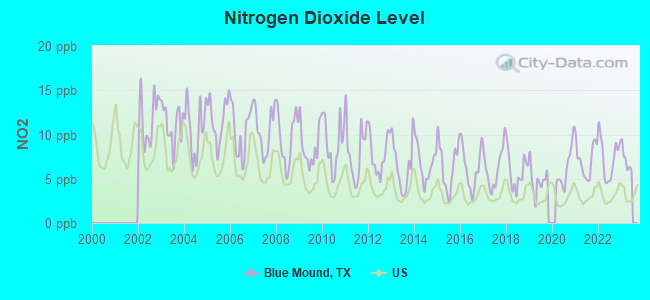
Nitrogen Dioxide (NO2) [ppb] level in 2022 was 7.38. This is significantly worse than average.Closest monitor was 4.5 miles away from the city center.
City:
7.38
U.S.:
5.11
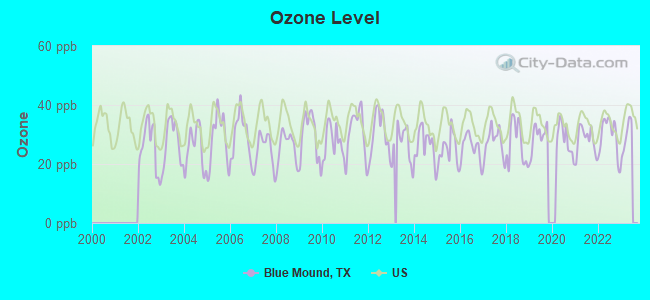
Ozone [ppb] level in 2022 was 29.5. This is about average.Closest monitor was 6.2 miles away from the city center.
City:
29.5
U.S.:
33.3
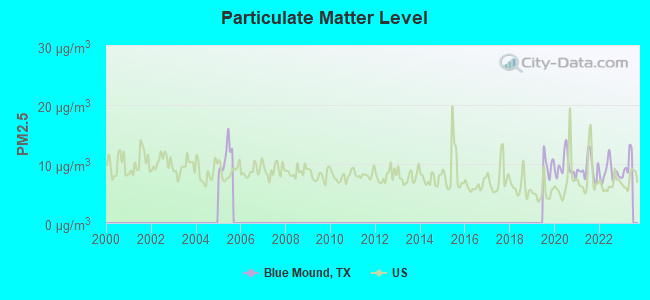
Particulate Matter (PM2.5) [µg/m3] level in 2022 was 8.64. This is about average.Closest monitor was 3.6 miles away from the city center.
City:
8.64
U.S.:
8.11
Tornado activity:
Blue Mound-area historical tornado activity is above Texas state average. It is 149% greater than the overall U.S. average.
On 4/25/1990, a category F4 (max. wind speeds 207-260 mph) tornado 24.1 miles away from the Blue Mound city center causedbetween $500,000 and $5,000,000 in damages.
On 5/4/1960, a category F3 (max. wind speeds 158-206 mph) tornado 1.1 miles away from the city center injured 12 peopleand causedbetween $50,000 and $500,000 in damages.
Earthquake activity:
Blue Mound-area historical earthquake activity is significantly above Texas state average. It is 477% greater than the overall U.S. average.
On 11/6/2011 at 03:53:10, a magnitude 5.7 (5.7 MW, Depth: 3.2 mi, Class: Moderate, Intensity: VI - VII) earthquake occurred 188.0 miles away from the city center On 9/3/2016 at 12:02:44, a magnitude 5.8 (5.8 MW, Depth: 3.5 mi) earthquake occurred 248.0 miles away from Blue Mound center On 6/16/1978 at 11:46:54, a magnitude 5.3 (4.4 MB, 4.6 UK, 5.3 ML) earthquake occurred 199.3 miles away from the city center On 11/7/2016 at 01:44:24, a magnitude 5.0 (5.0 MW, Depth: 2.8 mi) earthquake occurred 219.0 miles away from Blue Mound center On 5/17/2012 at 08:12:00, a magnitude 4.8 (4.8 MW, Depth: 3.1 mi, Class: Light, Intensity: IV - V) earthquake occurred 184.9 miles away from Blue Mound center On 11/8/2011 at 02:46:57, a magnitude 4.8 (4.8 MW, Depth: 3.1 mi) earthquake occurred 187.7 miles away from Blue Mound center Magnitude types: body-wave magnitude (MB), local magnitude (ML), moment magnitude (MW)
Natural disasters:
The number of natural disasters in Tarrant County (23) is greater than the US average (15). Major Disasters (Presidential) Declared: 10 Emergencies Declared: 10
Causes of natural disasters: Storms: 8, Floods: 7, Hurricanes: 7, Fires: 6, Tornadoes: 5, Wind: 1, Other: 2 (Note: some incidents may be assigned to more than one category).
Hospitals and medical centers near Blue Mound:
HOSPICE OF THE WEST LP (Hospital, about 2 miles away; FORT WORTH, TX)
REMARKABLE HEALTHCARE OF FORT WORTH (Nursing Home, about 2 miles away; FORT WORTH, TX)
SEASONS HOSPICE AND PALLIATIVE CARE OF TEXAS INC (Hospital, about 3 miles away; FORT WORTH, TX)
SAFE CARE I I I (Hospital, about 4 miles away; FORT WORTH, TX)
JARVIS HEIGHTS NURSING CE (Nursing Home, about 4 miles away; FORT WORTH, TX)
SAFE CARE IV BENTLEY HOUSE (Hospital, about 4 miles away; FORT WORTH, TX)
MARINE CREEK NURSING AND REHABILITATION LP (Nursing Home, about 4 miles away; FORT WORTH, TX)
Amtrak station near Blue Mound:
8 miles: FORT WORTH (1501 JONES ST.) . Services: ticket office, fully wheelchair accessible, enclosed waiting area, public restrooms, public payphones, vending machines, free short-term parking, paid long-term parking, call for car rental service, call for taxi service, public transit connection.
Colleges/universities with over 2000 students nearest to Blue Mound:
Tarrant County College District (about 8 miles; Fort Worth, TX; Full-time enrollment: 33,775)
Texas Christian University (about 11 miles; Fort Worth, TX; FT enrollment: 9,131)
The University of Texas at Arlington (about 16 miles; Arlington, TX; FT enrollment: 27,453)
DeVry University-Texas (about 20 miles; Irving, TX; FT enrollment: 4,098)
North Lake College (about 22 miles; Irving, TX; FT enrollment: 6,191)
University of Dallas (about 25 miles; Irving, TX; FT enrollment: 2,192)
Dallas Baptist University (about 25 miles; Dallas, TX; FT enrollment: 4,280)
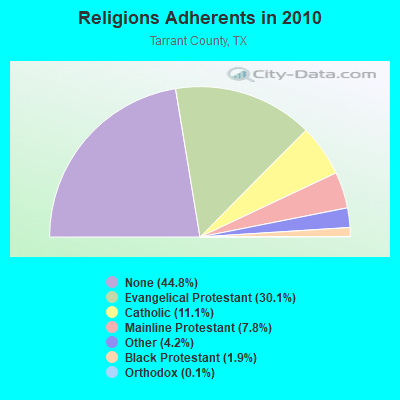
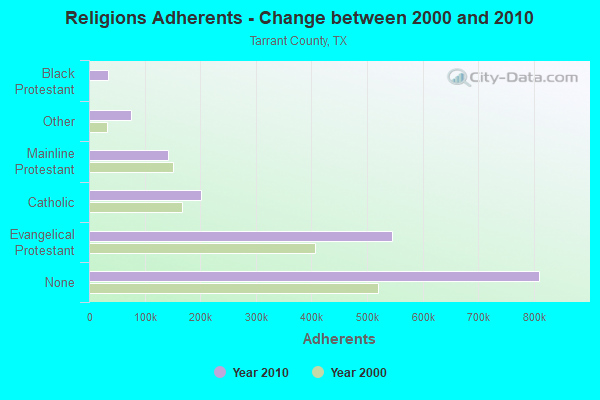
Religion statistics for Blue Mound, TX (based on Tarrant County data)
Religion
Adherents
Congregations
Evangelical Protestant
544,670
1,272
Catholic
200,645
33
Mainline Protestant
141,938
158
Other
75,335
122
Black Protestant
33,665
103
Orthodox
2,596
7
None
810,185
-
Source: Clifford Grammich, Kirk Hadaway, Richard Houseal, Dale E.Jones, Alexei Krindatch, Richie Stanley and Richard H.Taylor. 2012. 2010 U.S.Religion Census: Religious Congregations & Membership Study. Association of Statisticians of American Religious Bodies. Jones, Dale E., et al. 2002. Congregations and Membership in the United States 2000. Nashville, TN: Glenmary Research Center. Graphs represent county-level data
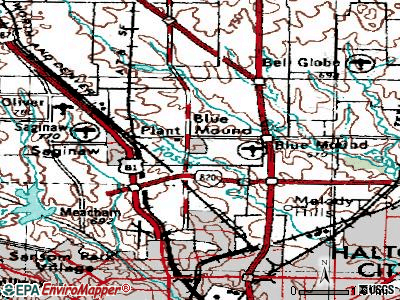
City Hall 1600 Bell Ave (Lat: 32.861250 Lon: -97.342806), Call Sign: KZE521, Licensee ID: L00227533, Assigned Frequencies: 154.055 MHz, Grant Date: 11/29/2001, Expiration Date: 01/07/2012, Cancellation Date: 03/10/2012, Registrant: City Of Blue Mound, 301 Blue Mound Rd., Blue Mound, TX 76131, Phone: (817) 847-5208, Fax: (817) 232-0665, Email:
FCC Registered Amateur Radio Licenses:
6
Call Sign: KC7FAA, Licensee ID: L00140926, Grant Date: 06/01/2004, Expiration Date: 08/11/2014, Cancellation Date: 08/12/2016, Certifier: Mark D Weitzenhoffer, Registrant: Mark D Weitzenhoffer, 2660 Silver Hill Drive, Blue Mound, TX 76131
Call Sign: N5OUY, Licensee ID: L01493356, Grant Date: 05/22/2019, Expiration Date: 07/19/2029, Registrant: David Kent, 836 Globe Ave, Blue Mound, TX 76131-1536
Call Sign: KE5ARG, Licensee ID: L00831379, Grant Date: 03/05/2014, Expiration Date: 03/16/2024, Certifier: Kevin L Moore, Registrant: Kevin L Moore, 916 Round Hill Rd, Blue Mound, TX 76131
Call Sign: KE5ZKA, Licensee ID: L01470046, Grant Date: 02/11/2019, Expiration Date: 02/26/2029, Certifier: Richard W Gish, Registrant: Richard W Gish, 1657 Independence Road, Blue Mound, TX 76131
Call Sign: KE5ZKE, Licensee ID: L01470050, Grant Date: 02/15/2019, Expiration Date: 02/26/2029, Certifier: Andrea E Kinser, Registrant: Andrea E Kinser, 1657 Independence Road, Blue Mound, TX 76131
FAA Registered Aircraft:
1
Aircraft: BELL 206B (Category: Land, Seats: 5, Weight: Up to 12,499 Pounds, Speed: 112 mph), Engine: Turbo-shaft N-Number: 5747L, N5747L, N-5747L, Serial Number: 3079, Airworthiness Date: 08/06/1980, Certificate Issue Date: 03/01/1991 Registrant (Individual): Steve Dba Statzel, 1057 Creek Hollow Ln, Blue Mound, TX 76131, Other Owners: Helicopters Heartland
Home Mortgage Disclosure Act Aggregated Statistics For Year 2009 (Based on 1 partial tract)
A) FHA, FSA/RHS & VA Home Purchase Loans
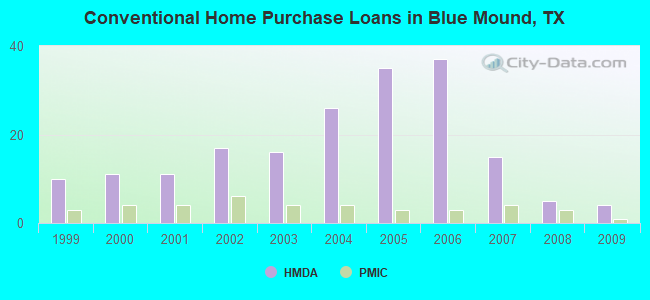
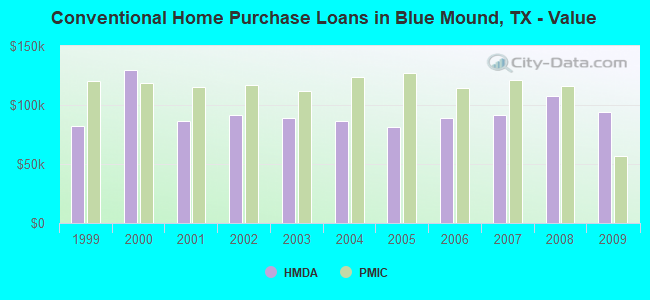
B) Conventional Home Purchase Loans
C) Refinancings
D) Home Improvement Loans
F) Non-occupant Loans on < 5 Family Dwellings (A B C & D)
Number
Average Value
Number
Average Value
Number
Average Value
Number
Average Value
Number
Average Value
LOANS ORIGINATED
14
$119,034
4
$94,395
10
$115,416
1
$38,480
1
$146,040
APPLICATIONS APPROVED, NOT ACCEPTED
1
$159,260
0
$0
1
$121,200
0
$0
0
$0
APPLICATIONS DENIED
23
$135,660
1
$60,980
4
$109,825
2
$25,000
0
$0
APPLICATIONS WITHDRAWN
1
$195,180
0
$0
4
$126,695
0
$0
1
$42,000
FILES CLOSED FOR INCOMPLETENESS
0
$0
0
$0
1
$136,870
0
$0
0
$0
Aggregated Statistics For Year 2008 (Based on 1 partial tract)
A) FHA, FSA/RHS & VA Home Purchase Loans
B) Conventional Home Purchase Loans
C) Refinancings
D) Home Improvement Loans
F) Non-occupant Loans on < 5 Family Dwellings (A B C & D)
Number
Average Value
Number
Average Value
Number
Average Value
Number
Average Value
Number
Average Value
LOANS ORIGINATED
11
$116,931
5
$107,516
6
$97,077
1
$31,450
2
$74,035
APPLICATIONS APPROVED, NOT ACCEPTED
1
$87,940
1
$85,070
1
$89,330
0
$0
0
$0
APPLICATIONS DENIED
9
$139,113
3
$118,823
8
$91,182
4
$41,360
1
$87,310
APPLICATIONS WITHDRAWN
1
$167,680
1
$108,630
2
$122,110
1
$15,030
0
$0
FILES CLOSED FOR INCOMPLETENESS
0
$0
1
$49,360
1
$95,190
0
$0
0
$0
Aggregated Statistics For Year 2007 (Based on 1 partial tract)
A) FHA, FSA/RHS & VA Home Purchase Loans
B) Conventional Home Purchase Loans
C) Refinancings
D) Home Improvement Loans
F) Non-occupant Loans on < 5 Family Dwellings (A B C & D)
Number
Average Value
Number
Average Value
Number
Average Value
Number
Average Value
Number
Average Value
LOANS ORIGINATED
5
$123,720
15
$91,498
7
$87,594
2
$25,745
4
$84,692
APPLICATIONS APPROVED, NOT ACCEPTED
1
$54,470
1
$148,600
2
$80,430
1
$12,150
0
$0
APPLICATIONS DENIED
2
$115,130
5
$117,516
9
$102,869
4
$35,630
1
$71,950
APPLICATIONS WITHDRAWN
1
$83,040
1
$142,310
4
$103,508
0
$0
1
$52,770
FILES CLOSED FOR INCOMPLETENESS
0
$0
1
$63,320
1
$148,070
0
$0
0
$0
Aggregated Statistics For Year 2006 (Based on 1 partial tract)
A) FHA, FSA/RHS & VA Home Purchase Loans
B) Conventional Home Purchase Loans
C) Refinancings
D) Home Improvement Loans
F) Non-occupant Loans on < 5 Family Dwellings (A B C & D)
Number
Average Value
Number
Average Value
Number
Average Value
Number
Average Value
Number
Average Value
LOANS ORIGINATED
7
$131,179
37
$88,878
9
$91,428
2
$29,050
10
$83,404
APPLICATIONS APPROVED, NOT ACCEPTED
0
$0
4
$73,020
1
$109,690
1
$41,680
1
$41,150
APPLICATIONS DENIED
2
$106,065
11
$105,641
8
$104,921
5
$36,030
3
$85,813
APPLICATIONS WITHDRAWN
2
$172,000
6
$93,328
5
$98,796
0
$0
1
$63,110
FILES CLOSED FOR INCOMPLETENESS
0
$0
2
$66,570
4
$92,370
0
$0
0
$0
Aggregated Statistics For Year 2005 (Based on 1 partial tract)
A) FHA, FSA/RHS & VA Home Purchase Loans
B) Conventional Home Purchase Loans
C) Refinancings
D) Home Improvement Loans
F) Non-occupant Loans on < 5 Family Dwellings (A B C & D)
Number
Average Value
Number
Average Value
Number
Average Value
Number
Average Value
Number
Average Value
LOANS ORIGINATED
11
$126,999
35
$81,238
13
$101,393
3
$28,960
7
$68,300
APPLICATIONS APPROVED, NOT ACCEPTED
1
$95,090
4
$103,428
2
$95,995
1
$29,210
0
$0
APPLICATIONS DENIED
2
$128,240
7
$74,970
15
$95,961
3
$40,757
3
$50,530
APPLICATIONS WITHDRAWN
3
$116,940
10
$114,094
11
$121,611
1
$152,010
1
$151,800
FILES CLOSED FOR INCOMPLETENESS
0
$0
1
$58,200
3
$119,783
0
$0
0
$0
Aggregated Statistics For Year 2004 (Based on 1 partial tract)
A) FHA, FSA/RHS & VA Home Purchase Loans
B) Conventional Home Purchase Loans
C) Refinancings
D) Home Improvement Loans
F) Non-occupant Loans on < 5 Family Dwellings (A B C & D)
G) Loans On Manufactured Home Dwelling (A B C & D)
Number
Average Value
Number
Average Value
Number
Average Value
Number
Average Value
Number
Average Value
Number
Average Value
LOANS ORIGINATED
14
$121,631
26
$86,416
17
$97,846
1
$52,340
5
$89,118
0
$0
APPLICATIONS APPROVED, NOT ACCEPTED
2
$122,165
6
$98,480
2
$93,490
0
$0
1
$91,780
0
$0
APPLICATIONS DENIED
3
$147,820
7
$89,071
16
$92,242
4
$24,438
1
$72,490
1
$24,940
APPLICATIONS WITHDRAWN
3
$131,510
4
$115,102
10
$105,726
0
$0
1
$106,920
0
$0
FILES CLOSED FOR INCOMPLETENESS
0
$0
1
$124,190
4
$106,972
0
$0
0
$0
0
$0
Aggregated Statistics For Year 2003 (Based on 1 partial tract)
A) FHA, FSA/RHS & VA Home Purchase Loans
B) Conventional Home Purchase Loans
C) Refinancings
D) Home Improvement Loans
F) Non-occupant Loans on < 5 Family Dwellings (A B C & D)
Number
Average Value
Number
Average Value
Number
Average Value
Number
Average Value
Number
Average Value
LOANS ORIGINATED
10
$121,727
16
$89,084
44
$93,333
2
$21,320
3
$61,367
APPLICATIONS APPROVED, NOT ACCEPTED
0
$0
2
$99,510
6
$87,395
0
$0
0
$0
APPLICATIONS DENIED
2
$105,480
4
$79,338
18
$87,276
2
$24,730
1
$27,400
APPLICATIONS WITHDRAWN
2
$98,980
2
$94,925
15
$99,685
0
$0
0
$0
FILES CLOSED FOR INCOMPLETENESS
0
$0
1
$125,040
3
$96,830
0
$0
0
$0
Aggregated Statistics For Year 2002 (Based on 1 partial tract)
A) FHA, FSA/RHS & VA Home Purchase Loans
B) Conventional Home Purchase Loans
C) Refinancings
D) Home Improvement Loans
F) Non-occupant Loans on < 5 Family Dwellings (A B C & D)
Number
Average Value
Number
Average Value
Number
Average Value
Number
Average Value
Number
Average Value
LOANS ORIGINATED
20
$120,602
17
$91,902
22
$90,329
2
$16,365
1
$92,640
APPLICATIONS APPROVED, NOT ACCEPTED
1
$137,090
2
$55,110
2
$78,775
1
$16,740
0
$0
APPLICATIONS DENIED
3
$108,340
4
$97,380
6
$70,747
4
$16,895
1
$36,460
APPLICATIONS WITHDRAWN
3
$129,307
4
$94,500
7
$87,031
0
$0
0
$0
FILES CLOSED FOR INCOMPLETENESS
0
$0
1
$104,040
2
$102,975
0
$0
0
$0
Aggregated Statistics For Year 2001 (Based on 1 partial tract)
A) FHA, FSA/RHS & VA Home Purchase Loans
B) Conventional Home Purchase Loans
C) Refinancings
D) Home Improvement Loans
F) Non-occupant Loans on < 5 Family Dwellings (A B C & D)
Number
Average Value
Number
Average Value
Number
Average Value
Number
Average Value
Number
Average Value
LOANS ORIGINATED
13
$107,552
11
$86,821
12
$95,824
3
$21,070
1
$43,600
APPLICATIONS APPROVED, NOT ACCEPTED
1
$115,450
2
$70,145
2
$52,075
0
$0
0
$0
APPLICATIONS DENIED
2
$92,475
3
$63,357
4
$63,508
2
$20,680
1
$40,510
APPLICATIONS WITHDRAWN
2
$138,100
2
$99,885
4
$80,990
1
$10,130
0
$0
FILES CLOSED FOR INCOMPLETENESS
0
$0
0
$0
1
$56,070
0
$0
0
$0
Aggregated Statistics For Year 2000 (Based on 1 partial tract)
A) FHA, FSA/RHS & VA Home Purchase Loans
B) Conventional Home Purchase Loans
C) Refinancings
D) Home Improvement Loans
F) Non-occupant Loans on < 5 Family Dwellings (A B C & D)
Number
Average Value
Number
Average Value
Number
Average Value
Number
Average Value
Number
Average Value
LOANS ORIGINATED
10
$111,674
11
$129,810
3
$47,543
3
$15,953
1
$28,040
APPLICATIONS APPROVED, NOT ACCEPTED
1
$59,160
1
$103,830
1
$50,950
1
$13,860
0
$0
APPLICATIONS DENIED
1
$86,560
4
$82,402
2
$72,275
1
$12,580
0
$0
APPLICATIONS WITHDRAWN
1
$136,980
2
$86,080
2
$51,540
0
$0
0
$0
FILES CLOSED FOR INCOMPLETENESS
0
$0
1
$68,440
0
$0
0
$0
0
$0
Aggregated Statistics For Year 1999 (Based on 1 partial tract)
Detailed PMIC statistics for the following Tracts:1140.03
2002 - 2018 National Fire Incident Reporting System (NFIRS) incidents
According to the data from the years 2002 - 2018 the average number of fire incidents per year is 13. The highest number of reported fire incidents - 33 took place in 2011, and the least - 2 in 2002. The data has an increasing trend.
When looking into fire subcategories, the most reports belonged to: Structure Fires (60.9%), and Outside Fires (26.8%).
Fire incident types reported to NFIRS in Blue Mound, TX


 Recent articles from our blog. Our writers, many of them Ph.D. graduates or candidates, create easy-to-read articles on a wide variety of topics.

 (7.0 miles


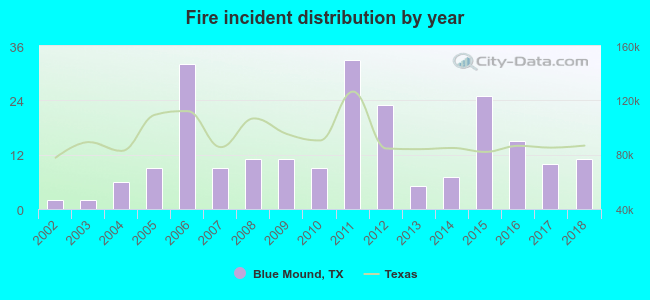 According to the data from the years 2002 - 2018 the average number of fire incidents per year is 13. The highest number of reported fire incidents - 33 took place in 2011, and the least - 2 in 2002. The data has an increasing trend.
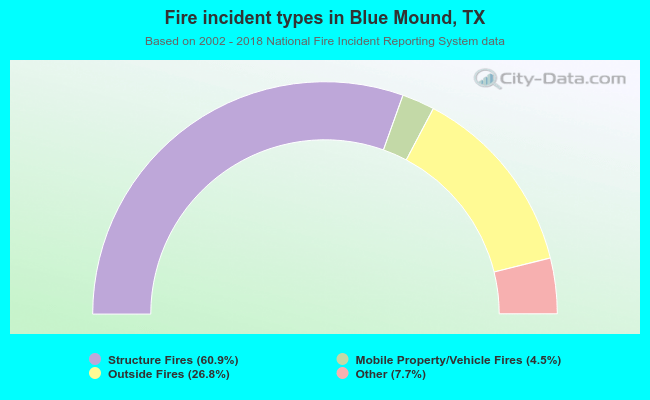 When looking into fire subcategories, the most reports belonged to: Structure Fires (60.9%), and Outside Fires (26.8%).