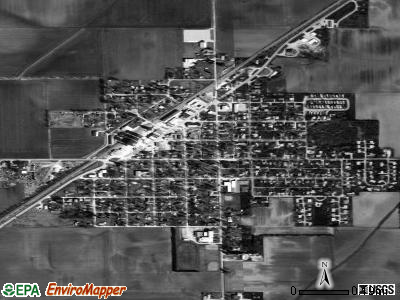
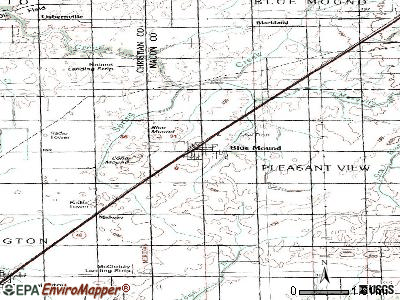
Blue Mound, Illinois
Submit your own pictures of this village and show them to the world
- OSM Map
- General Map
- Google Map
- MSN Map

Population change since 2000: -2.5%
 |
| Males: 488 | |
| Females: 613 |
| Median resident age: | 51.4 years |
| Illinois median age: | 39.1 years |
Zip codes: 62513.
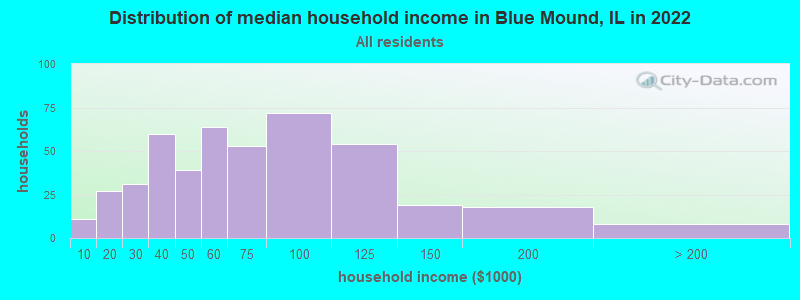
| Blue Mound: | $57,777 |
| IL: | $76,708 |
Estimated per capita income in 2022: $31,828 (it was $20,039 in 2000)
Blue Mound village income, earnings, and wages data
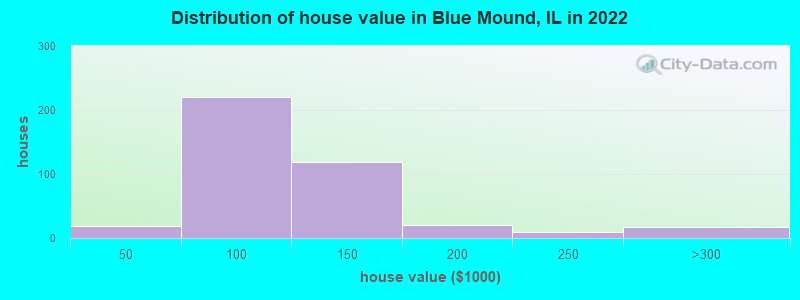
Estimated median house or condo value in 2022: $91,083 (it was $62,300 in 2000)
| Blue Mound: | $91,083 |
| IL: | $251,600 |
Mean prices in 2022: all housing units: $111,465; detached houses: $119,506; mobile homes: $17,070
Median gross rent in 2022: $794.
(6.4% for White Non-Hispanic residents, 26.3% for Black residents, 19.7% for two or more races residents)
Detailed information about poverty and poor residents in Blue Mound, IL
Compare current foreclosures near Blue Mound, IL:
| Photo | Address | Area | Beds / Baths | Price | Details |
|---|---|---|---|---|---|

|
#1
E 2750 North Rd
Blue Mound, IL 62513
|
570 sq. feet
|
- baths 3 beds |
show details | |

|
#2
S Sunnyside Dr
Blue Mound, IL 62513
|
- sq. feet
|
- baths - beds |
show details | |

|
#3
W Mark Ave
Decatur, IL 62526
|
1,781 sq. feet
|
2 baths 3 beds |
$195,000
|
show details |

|
#4
W Dunbar St
Blue Mound, IL 62513
|
- sq. feet
|
- baths - beds |
show details | |

|
#5
S Richmond Rd
Decatur, IL 62521
|
- sq. feet
|
1 baths 3 beds |
$45,800
|
show details |

|
#6
N University Ave
Decatur, IL 62522
|
- sq. feet
|
1 baths 2 beds |
$13,500
|
show details |

|
#7
S Elm St
Stonington, IL 62567
|
1,704 sq. feet
|
2 baths 3 beds |
show details | |

|
#8
N Glendale Ave
Decatur, IL 62521
|
1,543 sq. feet
|
1 baths 2 beds |
show details | |

|
#9
Wedgewood Ct
Decatur, IL 62526
|
4,402 sq. feet
|
4 baths 5 beds |
show details | |

|
#10
Redlick Ct
Warrensburg, IL 62573
|
1,320 sq. feet
|
2 baths 3 beds |
show details |
| Photo | Address | Area | Beds / Baths | Price | Details |
|---|---|---|---|---|---|

|
#11
W Marietta St
Decatur, IL 62522
|
840 sq. feet
|
1 baths 2 beds |
show details | |

|
#12
W Pershing Rd
Decatur, IL 62526
|
- sq. feet
|
- baths 2 beds |
$35,500
|
show details |

|
#13
N Graceland Ave
Decatur, IL 62526
|
1,400 sq. feet
|
3 baths 3 beds |
show details | |

|
#14
N Cherokee St
Taylorville, IL 62568
|
1,088 sq. feet
|
1 baths 3 beds |
show details | |

|
#15
S Haworth Ave
Decatur, IL 62522
|
- sq. feet
|
1 baths 3 beds |
show details | |

|
#16
N Oakland Ave
Decatur, IL 62522
|
1,008 sq. feet
|
1 baths - beds |
show details | |

|
#17
N Union St
Decatur, IL 62522
|
- sq. feet
|
- baths - beds |
show details | |

|
#18
E Center St
Decatur, IL 62526
|
- sq. feet
|
- baths - beds |
show details | |

|
#19
S 19th St
Decatur, IL 62521
|
- sq. feet
|
- baths - beds |
show details | |

|
#20
E William St
Decatur, IL 62521
|
- sq. feet
|
- baths - beds |
show details |
| Photo | Address | Area | Beds / Baths | Price | Details |
|---|---|---|---|---|---|

|
#21
S 19th St
Decatur, IL 62521
|
- sq. feet
|
- baths - beds |
show details | |

|
#22
W Olive St
Decatur, IL 62526
|
- sq. feet
|
- baths - beds |
show details | |

|
#23
N Union St
Decatur, IL 62526
|
- sq. feet
|
- baths - beds |
show details | |

|
#24
E Center St
Decatur, IL 62526
|
- sq. feet
|
- baths - beds |
show details | |

|
#25
N 17th St
Decatur, IL 62521
|
- sq. feet
|
- baths - beds |
show details | |

|
#26
N Union St
Decatur, IL 62526
|
- sq. feet
|
- baths - beds |
show details | |

|
#27
E North St
Decatur, IL 62521
|
- sq. feet
|
- baths - beds |
show details | |

|
#28
N Martin Luther King Jr Dr
Decatur, IL 62521
|
- sq. feet
|
- baths - beds |
show details | |

|
#29
W Peoria Ave
Decatur, IL 62526
|
- sq. feet
|
- baths - beds |
show details | |

|
#30
E Stuart Ave
Decatur, IL 62526
|
- sq. feet
|
- baths - beds |
show details |
| Photo | Address | Area | Beds / Baths | Price | Details |
|---|---|---|---|---|---|

|
#31
N Church St
Decatur, IL 62526
|
- sq. feet
|
- baths - beds |
show details | |

|
#32
N Church St
Decatur, IL 62526
|
- sq. feet
|
- baths - beds |
show details | |

|
#33
S Main St
Taylorville, IL 62568
|
- sq. feet
|
- baths - beds |
show details | |

|
#34
E Center St
Decatur, IL 62526
|
- sq. feet
|
- baths - beds |
show details | |

|
#35
E Center St
Decatur, IL 62526
|
- sq. feet
|
- baths - beds |
show details | |

|
#36
W Market St
Taylorville, IL 62568
|
- sq. feet
|
- baths - beds |
show details | |

|
#37
E Johnson Ave
Decatur, IL 62526
|
- sq. feet
|
- baths - beds |
show details | |

|
#38
E Main St
Decatur, IL 62521
|
- sq. feet
|
- baths - beds |
show details | |

|
#39
W Olive St
Decatur, IL 62526
|
- sq. feet
|
- baths - beds |
show details | |

|
#40
S Country Club Rd Apt 126
Decatur, IL 62521
|
- sq. feet
|
- baths - beds |
show details |
| Photo | Address | Area | Beds / Baths | Price | Details |
|---|---|---|---|---|---|

|
#41
N Church St
Decatur, IL 62526
|
- sq. feet
|
- baths - beds |
show details | |

|
#42
E William St
Decatur, IL 62521
|
- sq. feet
|
- baths - beds |
show details | |

|
#43
W Packard St
Decatur, IL 62522
|
- sq. feet
|
- baths - beds |
show details | |

|
#44
E Whitmer St
Decatur, IL 62521
|
- sq. feet
|
- baths - beds |
show details | |

|
#45
E Whitmer St
Decatur, IL 62521
|
- sq. feet
|
- baths - beds |
show details | |

|
#46
W Marietta St
Decatur, IL 62521
|
- sq. feet
|
- baths - beds |
show details | |

|
#47
N Main St
Decatur, IL 62521
|
- sq. feet
|
- baths - beds |
show details | |

|
#48
N Monroe St
Decatur, IL 62526
|
- sq. feet
|
- baths - beds |
show details | |

|
#49
N College St
Decatur, IL 62526
|
- sq. feet
|
- baths - beds |
show details | |

|
Check over 1 million property listings on Foreclosure.com!
|
browse all offers | |||


- 79486.8%White alone
- 677.3%Two or more races
- 343.7%Hispanic
- 171.9%Black alone
- 70.8%Asian alone
- 10.1%American Indian alone
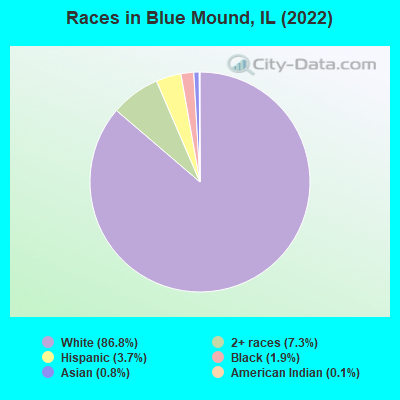
Races in Blue Mound detailed stats: ancestries, foreign born residents, place of birth
Type |
2010 |
2011 |
2012 |
2013 |
2014 |
2019 |
2020 |
|---|---|---|---|---|---|---|---|
| Murders (per 100,000) | 0 (0.0) | 0 (0.0) | 0 (0.0) | 0 (0.0) | 0 (0.0) | 0 (0.0) | 0 (0.0) |
| Rapes (per 100,000) | 0 (0.0) | 1 (86.1) | 0 (0.0) | 0 (0.0) | 0 (0.0) | 0 (0.0) | 1 (94.1) |
| Robberies (per 100,000) | 0 (0.0) | 0 (0.0) | 0 (0.0) | 0 (0.0) | 0 (0.0) | 0 (0.0) | 0 (0.0) |
| Assaults (per 100,000) | 4 (345.4) | 6 (516.8) | 4 (345.4) | 5 (435.9) | 1 (88.3) | 0 (0.0) | 4 (376.3) |
| Burglaries (per 100,000) | 10 (863.6) | 9 (775.2) | 6 (518.1) | 5 (435.9) | 1 (88.3) | 1 (93.2) | 5 (470.4) |
| Thefts (per 100,000) | 7 (604.5) | 17 (1,464) | 21 (1,813) | 11 (959.0) | 9 (795.1) | 4 (372.8) | 18 (1,693) |
| Auto thefts (per 100,000) | 0 (0.0) | 1 (86.1) | 2 (172.7) | 0 (0.0) | 0 (0.0) | 0 (0.0) | 1 (94.1) |
| Arson (per 100,000) | 0 (0.0) | 0 (0.0) | 0 (0.0) | 1 (87.2) | 0 (0.0) | 0 (0.0) | 1 (94.1) |
| City-Data.com crime index | 153.7 | 292.0 | 191.7 | 156.1 | 55.7 | 21.4 | 258.7 |
The City-Data.com crime index weighs serious crimes and violent crimes more heavily. Higher means more crime, U.S. average is 246.1. It adjusts for the number of visitors and daily workers commuting into cities.
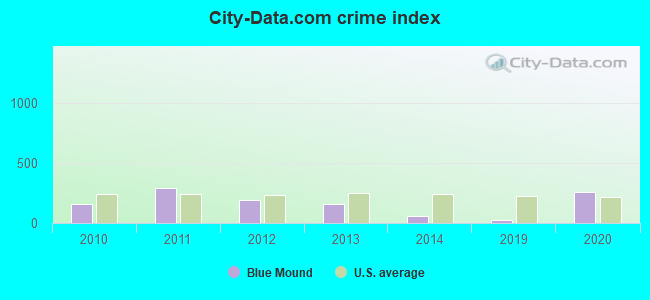
Crime rate in Blue Mound detailed stats: murders, rapes, robberies, assaults, burglaries, thefts, arson
Full-time law enforcement employees in 2019, including police officers: 1 (1 officers - 1 male; 0 female).
| Officers per 1,000 residents here: | 0.93 |
| Illinois average: | 3.06 |
 Recent articles from our blog. Our writers, many of them Ph.D. graduates or candidates, create easy-to-read articles on a wide variety of topics.

 | What are some strange names for illinois towns? (67 replies) |
| Camping (24 replies) |
| Relocating to Decatur Illinois Area (18 replies) |
Latest news from Blue Mound, IL collected exclusively by city-data.com from local newspapers, TV, and radio stations
Ancestries: German (24.5%), English (21.6%), American (16.0%), Lebanese (4.2%), Nigerian (3.9%), Irish (2.9%).
Current Local Time: CST time zone
Incorporated on 05/09/1876
Elevation: 625 feet
Land area: 0.59 square miles.
Population density: 1,852 people per square mile (low).
19 residents are foreign born (1.0% Asia, 0.9% Africa).
| This village: | 2.1% |
| Illinois: | 14.1% |
Median real estate property taxes paid for housing units with mortgages in 2022: $2,420 (2.4%)
Median real estate property taxes paid for housing units with no mortgage in 2022: $2,004 (2.4%)
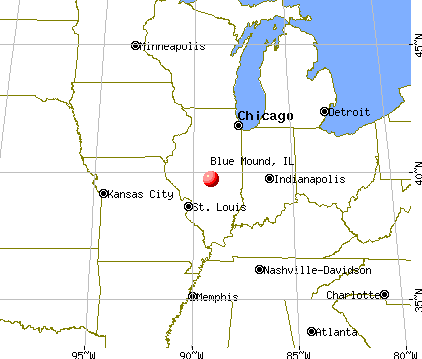
Nearest city with pop. 50,000+: Decatur, IL  (14.1 miles , pop. 81,860).
Nearest city with pop. 200,000+: St. Louis, MO (95.4 miles , pop. 348,189).
Nearest city with pop. 1,000,000+: Chicago, IL (166.2 miles , pop. 2,896,016).
Nearest cities:
), ), ), ), ), Latitude: 39.70 N, Longitude: 89.12 W
Area code: 217
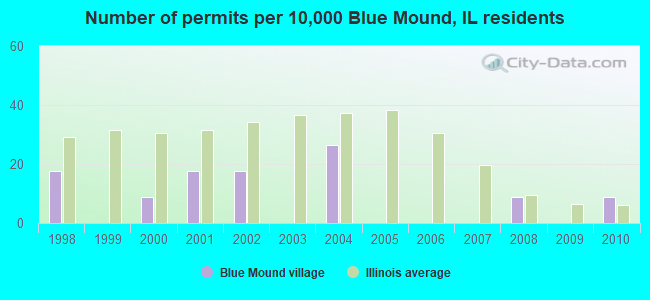
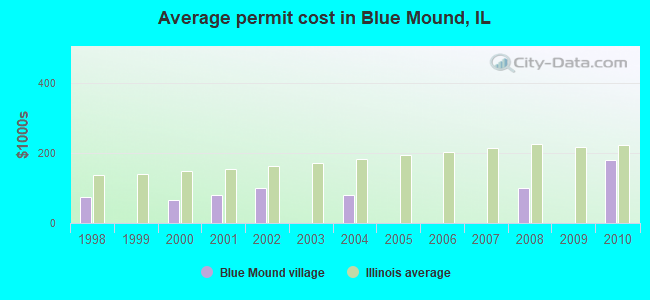
Single-family new house construction building permits:
- 2010: 1 building, cost: $180,000
- 2008: 1 building, cost: $100,000
- 2004: 3 buildings, average cost: $80,000
- 2002: 2 buildings, average cost: $100,000
- 2001: 2 buildings, average cost: $80,000
- 2000: 1 building, cost: $66,000
- 1998: 2 buildings, average cost: $75,000
| Here: | 5.7% |
| Illinois: | 4.2% |
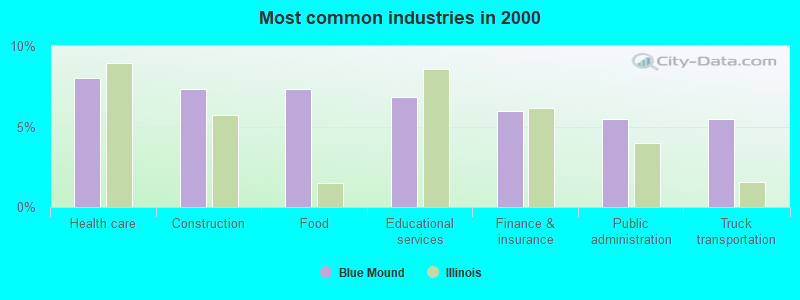
- Health care (8.0%)
- Construction (7.3%)
- Food (7.3%)
- Educational services (6.8%)
- Finance & insurance (6.0%)
- Public administration (5.5%)
- Truck transportation (5.5%)
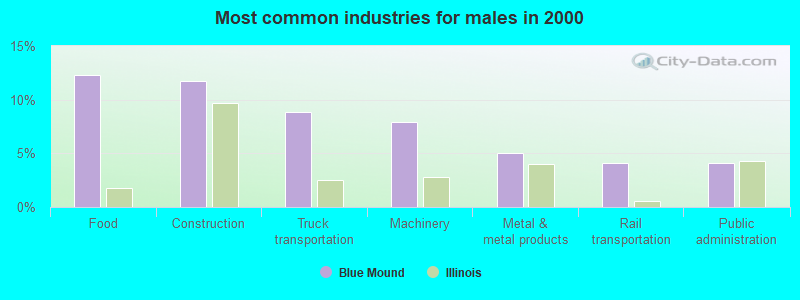
- Food (12.3%)
- Construction (11.7%)
- Truck transportation (8.9%)
- Machinery (7.9%)
- Metal & metal products (5.1%)
- Rail transportation (4.1%)
- Public administration (4.1%)
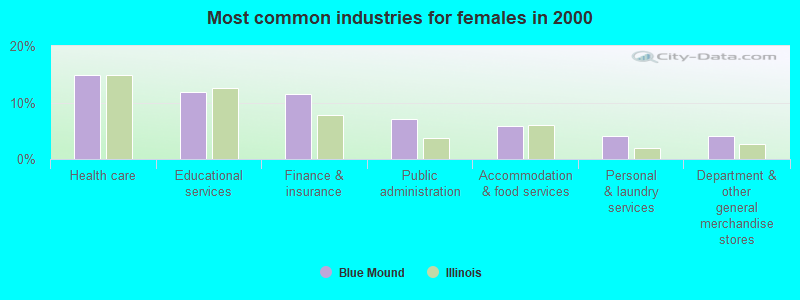
- Health care (14.8%)
- Educational services (11.9%)
- Finance & insurance (11.5%)
- Public administration (7.0%)
- Accommodation & food services (5.9%)
- Personal & laundry services (4.1%)
- Department & other general merchandise stores (4.1%)
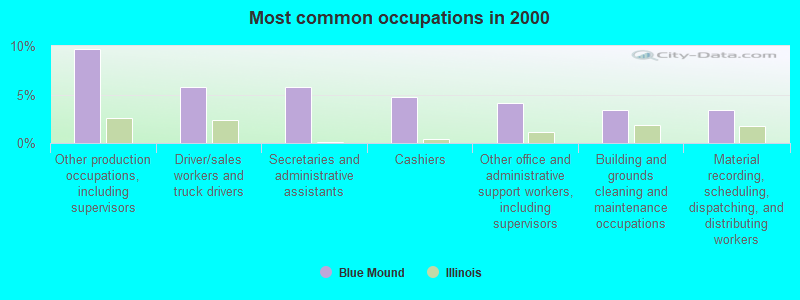
- Other production occupations, including supervisors (9.7%)
- Driver/sales workers and truck drivers (5.8%)
- Secretaries and administrative assistants (5.8%)
- Cashiers (4.8%)
- Other office and administrative support workers, including supervisors (4.1%)
- Building and grounds cleaning and maintenance occupations (3.4%)
- Material recording, scheduling, dispatching, and distributing workers (3.4%)
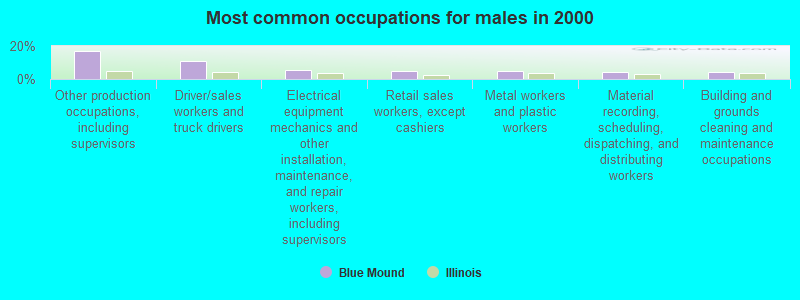
- Other production occupations, including supervisors (17.1%)
- Driver/sales workers and truck drivers (10.8%)
- Electrical equipment mechanics and other installation, maintenance, and repair workers, including supervisors (5.4%)
- Retail sales workers, except cashiers (4.7%)
- Metal workers and plastic workers (4.7%)
- Material recording, scheduling, dispatching, and distributing workers (4.4%)
- Building and grounds cleaning and maintenance occupations (4.1%)
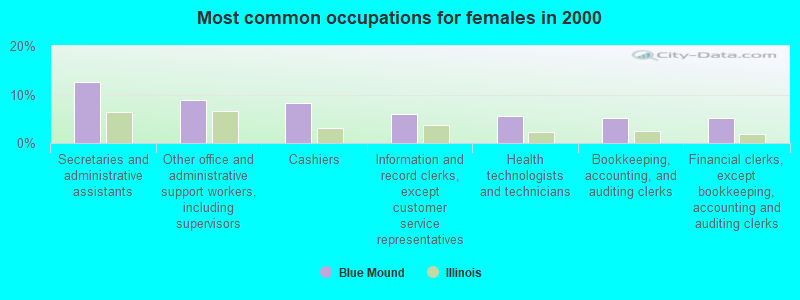
- Secretaries and administrative assistants (12.6%)
- Other office and administrative support workers, including supervisors (8.9%)
- Cashiers (8.1%)
- Information and record clerks, except customer service representatives (5.9%)
- Health technologists and technicians (5.6%)
- Bookkeeping, accounting, and auditing clerks (5.2%)
- Financial clerks, except bookkeeping, accounting and auditing clerks (5.2%)
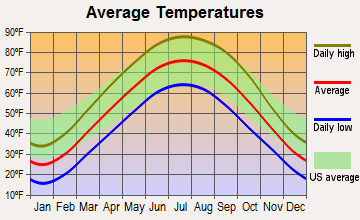
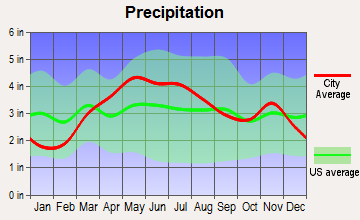
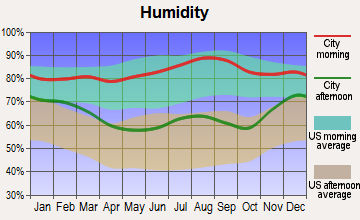
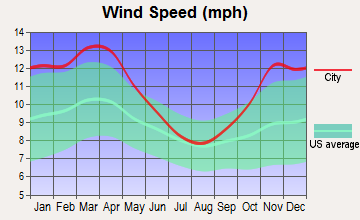
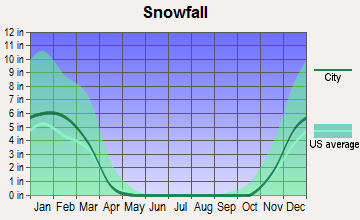
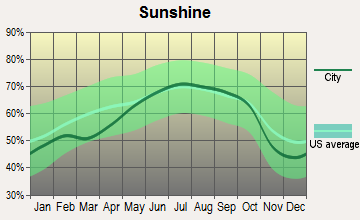
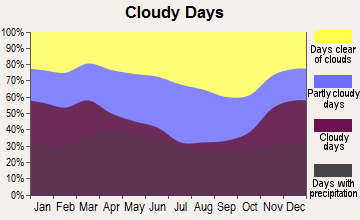
Average climate in Blue Mound, Illinois
Based on data reported by over 4,000 weather stations
|
|


(lower is better)
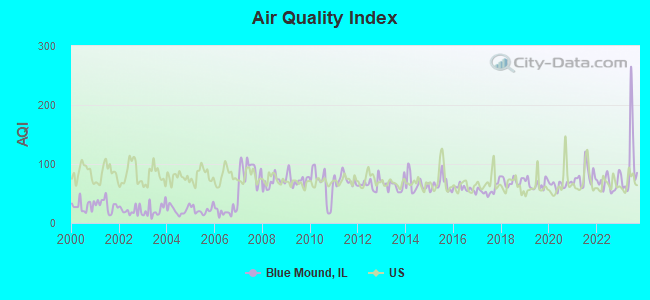
Air Quality Index (AQI) level in 2023 was 100. This is worse than average.
| City: | 100 |
| U.S.: | 73 |
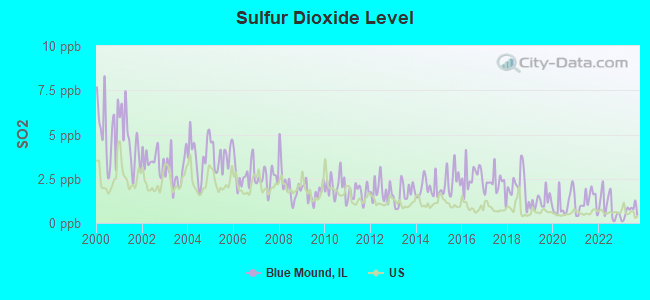
Sulfur Dioxide (SO2) [ppb] level in 2023 was 0.647. This is significantly better than average. Closest monitor was 13.3 miles away from the city center.
| City: | 0.647 |
| U.S.: | 1.515 |
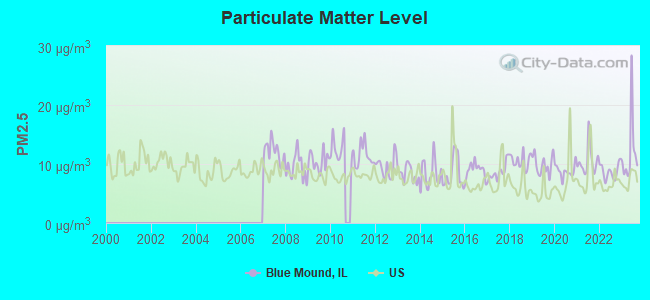
Particulate Matter (PM2.5) [µg/m3] level in 2023 was 11.9. This is significantly worse than average. Closest monitor was 15.6 miles away from the city center.
| City: | 11.9 |
| U.S.: | 8.1 |
Tornado activity:
Blue Mound-area historical tornado activity is slightly above Illinois state average. It is 89% greater than the overall U.S. average.
On 3/20/1976, a category F4 (max. wind speeds 207-260 mph) tornado 18.5 miles away from the Blue Mound village center injured 18 people and caused between $500,000 and $5,000,000 in damages.
On 4/3/1974, a category F3 (max. wind speeds 158-206 mph) tornado 1.5 miles away from the village center killed one person and injured 26 people and caused between $500,000 and $5,000,000 in damages.
Earthquake activity:
Blue Mound-area historical earthquake activity is significantly above Illinois state average. It is 197% greater than the overall U.S. average.On 4/18/2008 at 09:36:59, a magnitude 5.4 (5.1 MB, 4.8 MS, 5.4 MW, 5.2 MW, Class: Moderate, Intensity: VI - VII) earthquake occurred 108.9 miles away from Blue Mound center
On 4/18/2008 at 09:36:59, a magnitude 5.2 (5.2 MW, Depth: 8.9 mi) earthquake occurred 108.9 miles away from Blue Mound center
On 6/10/1987 at 23:48:54, a magnitude 5.1 (4.9 MB, 4.4 MS, 4.6 MS, 5.1 LG) earthquake occurred 89.9 miles away from the city center
On 6/18/2002 at 17:37:15, a magnitude 5.0 (4.3 MB, 4.6 MW, 5.0 LG) earthquake occurred 138.8 miles away from Blue Mound center
On 4/18/2008 at 15:14:16, a magnitude 4.8 (4.5 MB, 4.8 MW, 4.6 MW, Class: Light, Intensity: IV - V) earthquake occurred 108.9 miles away from the city center
On 4/3/1974 at 23:05:02, a magnitude 4.7 (4.5 MB, 4.7 LG) earthquake occurred 94.4 miles away from Blue Mound center
Magnitude types: regional Lg-wave magnitude (LG), body-wave magnitude (MB), surface-wave magnitude (MS), moment magnitude (MW)
Natural disasters:
The number of natural disasters in Macon County (9) is smaller than the US average (15).Major Disasters (Presidential) Declared: 6
Emergencies Declared: 2
Causes of natural disasters: Storms: 5, Floods: 3, Tornadoes: 3, Hurricane: 1, Snow: 1, Winter Storm: 1, Other: 1 (Note: some incidents may be assigned to more than one category).
Hospitals and medical centers near Blue Mound:
- MOWEAQUA NRSG AND RETIREMENT CTR (Nursing Home, about 8 miles away; MOWEAQUA, IL)
- FAIR HAVENS CHRISTIAN HOME (Nursing Home, about 12 miles away; DECATUR, IL)
- DECATUR REHAB AND HEALTH CARE CENTER (Nursing Home, about 12 miles away; DECATUR, IL)
- IMBODEN CREEK LIVING CENTER (Nursing Home, about 12 miles away; DECATUR, IL)
- WHITESTAR HOME HEALTH AGENCY, INC (Home Health Center, about 13 miles away; DECATUR, IL)
- SOUTHSIDE MANOR (Hospital, about 14 miles away; DECATUR, IL)
- NORTH PLAZA NURSING CENTER (Nursing Home, about 14 miles away; DECATUR, IL)
Airports located in Blue Mound:
- Cribbet Airport (1IS3) (Runways: 1)
- Mc Coy Airport (3IS1) (Runways: 1)
- Noland Rla Airport (3IS3) (Runways: 1)
Colleges/universities with over 2000 students nearest to Blue Mound:
- Millikin University (about 13 miles; Decatur, IL; Full-time enrollment: 2,419)
- Richland Community College (about 18 miles; Decatur, IL; FT enrollment: 2,434)
- Lincoln Land Community College (about 27 miles; Springfield, IL; FT enrollment: 5,460)
- University of Illinois at Springfield (about 27 miles; Springfield, IL; FT enrollment: 3,748)
- Lake Land College (about 44 miles; Mattoon, IL; FT enrollment: 7,499)
- Eastern Illinois University (about 53 miles; Charleston, IL; FT enrollment: 9,414)
- Parkland College (about 54 miles; Champaign, IL; FT enrollment: 7,326)
Public elementary/middle schools in Blue Mound:
- MERIDIAN INTERMEDIATE SCHOOL (Students: 260, Location: 100 LINCOLN ST, Grades: PK-5)
- MERIDIAN MIDDLE SCHOOL (Location: 509 S LEWIS ST, Grades: 6-8)
Points of interest:
Notable location: Blue Mound Community Rural Fire Protection District (A). Display/hide its location on the map
Church in Blue Mound: First Christian Church (A). Display/hide its location on the map
Birthplace of: Heather Mizeur - Politician.
Drinking water stations with addresses in Blue Mound and their reported violations in the past:
BLUE MOUND (Population served: 1,300, Groundwater):Past monitoring violations:
- Lead Consumer Notice - In JAN-02-2011, Contaminant: Lead and Copper Rule. Follow-up actions: St Violation/Reminder Notice (JAN-14-2011), St Formal NOV issued (MAR-09-2011), St Compliance achieved (MAY-09-2011)
- Monitoring and Reporting (DBP) - Between JAN-2008 and MAR-2008, Contaminant: Chlorine. Follow-up actions: St Compliance achieved (FEB-06-2008), St Public Notif requested (FEB-13-2008), St Violation/Reminder Notice (FEB-13-2008), St Public Notif received (APR-15-2009)
- One minor monitoring violation
| This village: | 2.5 people |
| Illinois: | 2.6 people |
| This village: | 67.6% |
| Whole state: | 65.8% |
| This village: | 6.7% |
| Whole state: | 6.3% |
Likely homosexual households (counted as self-reported same-sex unmarried-partner households)
- Lesbian couples: 0.2% of all households
- Gay men: 0.0% of all households
Banks with branches in Blue Mound (2011 data):
- The State Bank of Blue Mound: The State Bank Of Blue Mound at 202 North Saint Marie Street, branch established on 1912/10/12. Info updated 2010/06/02: Bank assets: $36.6 mil, Deposits: $33.2 mil, local headquarters, positive income, Agricultural Specialization, 1 total offices, Holding Company: Blue Mound Bancshares, Inc.
For population 15 years and over in Blue Mound:
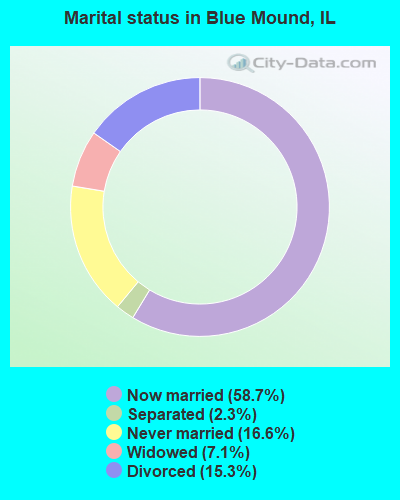
- Never married: 16.6%
- Now married: 58.7%
- Separated: 2.3%
- Widowed: 7.1%
- Divorced: 15.3%
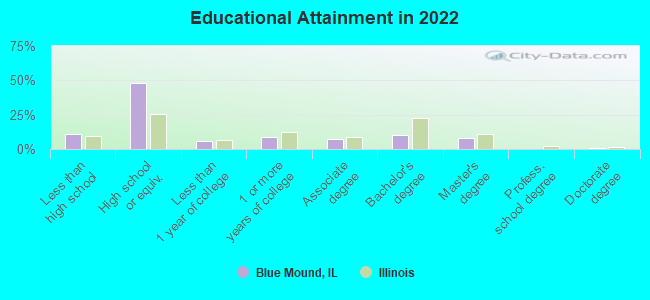
For population 25 years and over in Blue Mound:
- High school or higher: 86.1%
- Bachelor's degree or higher: 18.3%
- Graduate or professional degree: 8.0%
- Unemployed: 2.0%
- Mean travel time to work (commute): 21.1 minutes
| Here: | 9.4 |
| Illinois average: | 12.5 |
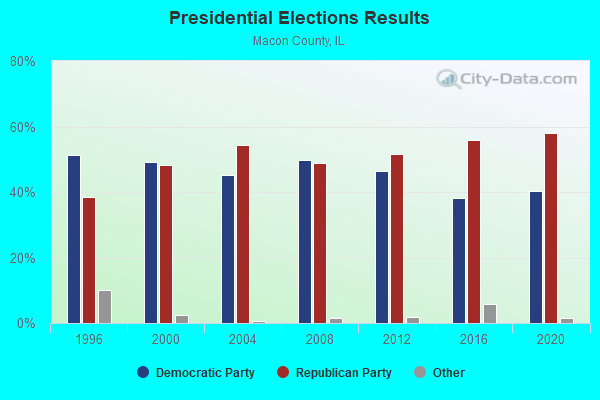
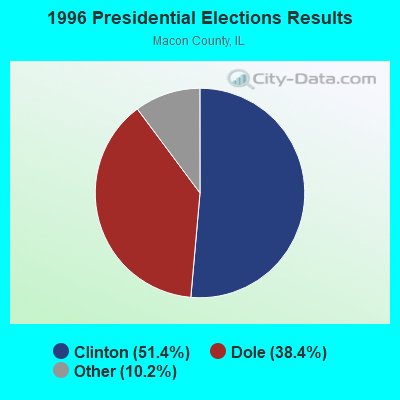
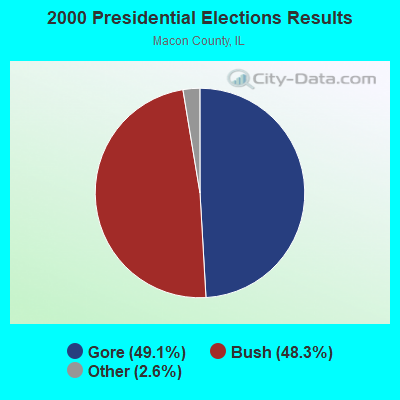
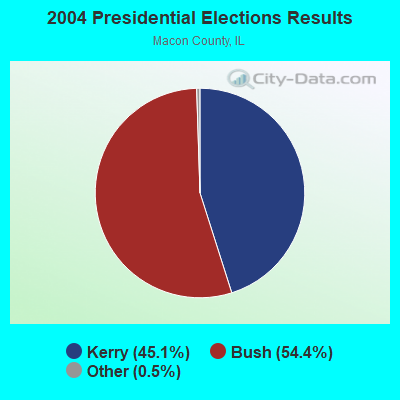
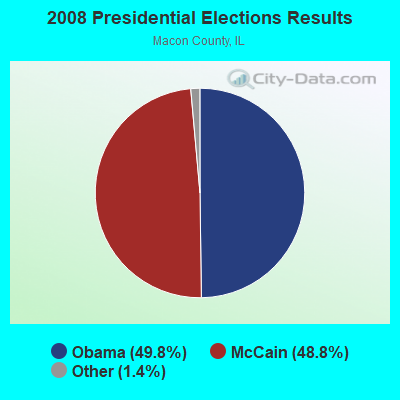
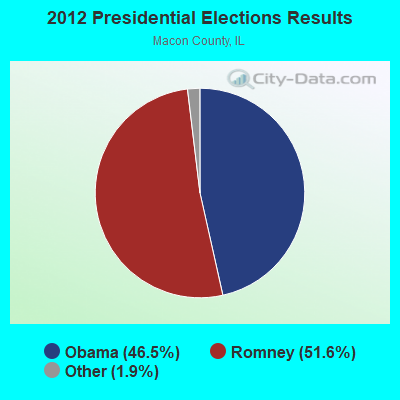


Graphs represent county-level data. Detailed 2008 Election Results
Religion statistics for Blue Mound, IL (based on Macon County data)
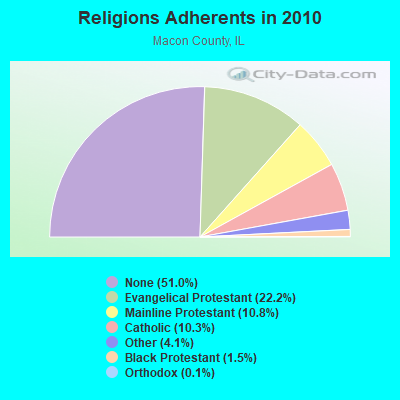
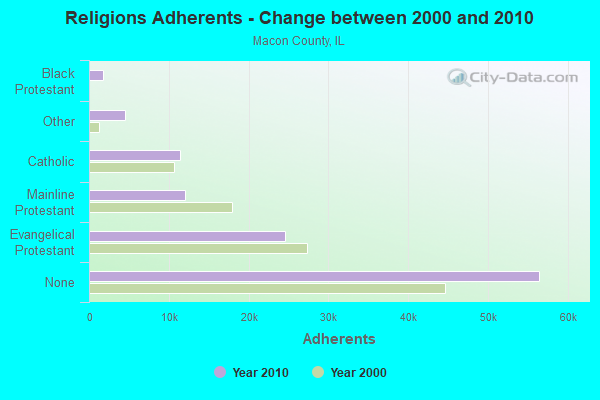
| Religion | Adherents | Congregations |
|---|---|---|
| Evangelical Protestant | 24,556 | 92 |
| Mainline Protestant | 11,982 | 41 |
| Catholic | 11,451 | 5 |
| Other | 4,490 | 11 |
| Black Protestant | 1,699 | 14 |
| Orthodox | 125 | 1 |
| None | 56,465 | - |
Food Environment Statistics:
| Here: | 1.20 / 10,000 pop. |
| State: | 2.24 / 10,000 pop. |
| Macon County: | 0.28 / 10,000 pop. |
| Illinois: | 0.08 / 10,000 pop. |
| Macon County: | 0.92 / 10,000 pop. |
| Illinois: | 0.75 / 10,000 pop. |
| Macon County: | 3.59 / 10,000 pop. |
| Illinois: | 2.61 / 10,000 pop. |
| Here: | 5.71 / 10,000 pop. |
| Illinois: | 6.86 / 10,000 pop. |
| This county: | 10.2% |
| Illinois: | 8.3% |
| This county: | 28.7% |
| Illinois: | 25.2% |
| This county: | 12.4% |
| Illinois: | 14.5% |
Health and Nutrition:
| Blue Mound: | 49.6% |
| Illinois: | 49.5% |
| Here: | 24.9% |
| Illinois: | 47.2% |
| Blue Mound: | 26.9 |
| Illinois: | 28.6 |
| Blue Mound: | 48.0% |
| Illinois: | 20.5% |
| This city: | 23.3% |
| Illinois: | 10.8% |
| Blue Mound: | 6.6 |
| Illinois: | 6.8 |
| This city: | 62.5% |
| Illinois: | 33.4% |
| Blue Mound: | 49.6% |
| Illinois: | 56.4% |
| This city: | 79.7% |
| State: | 79.9% |
More about Health and Nutrition of Blue Mound, IL Residents
| Local government employment and payroll (March 2022) | |||||
| Function | Full-time employees | Monthly full-time payroll | Average yearly full-time wage | Part-time employees | Monthly part-time payroll |
|---|---|---|---|---|---|
| Police Protection - Officers | 5 | $14,126 | $33,902 | 1 | $2,042 |
| Streets and Highways | 1 | $6,596 | $79,152 | 0 | $0 |
| Other and Unallocable | 1 | $2,498 | $29,976 | 1 | $2,397 |
| Local Libraries | 1 | $2,490 | $29,880 | 1 | $650 |
| Financial Administration | 1 | $3,023 | $36,276 | 0 | $0 |
| Firefighters | 0 | $0 | 34 | $1,030 | |
| Other Government Administration | 0 | $0 | 11 | $2,546 | |
| Water Supply | 0 | $0 | 1 | $665 | |
| Totals for Government | 9 | $28,733 | $38,311 | 49 | $9,330 |
Blue Mound government finances - Expenditure in 2017 (per resident):
- Current Operations - Financial Administration: $118,000 ($107.18)
Police Protection: $107,000 ($97.18)
Water Utilities: $103,000 ($93.55)
Regular Highways: $89,000 ($80.84)
Sewerage: $83,000 ($75.39)
General - Other: $30,000 ($27.25)
- General - Interest on Debt: $8,000 ($7.27)
- Other Capital Outlay - Police Protection: $41,000 ($37.24)
Sewerage: $18,000 ($16.35)
- Total Salaries and Wages: $174,000 ($158.04)
Blue Mound government finances - Revenue in 2017 (per resident):
- Charges - Sewerage: $133,000 ($120.80)
- Miscellaneous - General Revenue - Other: $10,000 ($9.08)
Fines and Forfeits: $3,000 ($2.72)
Interest Earnings: $1,000 ($0.91)
- Revenue - Water Utilities: $153,000 ($138.96)
- State Intergovernmental - General Local Government Support: $182,000 ($165.30)
Highways: $29,000 ($26.34)
- Tax - Property: $130,000 ($118.07)
Public Utilities Sales: $37,000 ($33.61)
Other Selective Sales: $11,000 ($9.99)
Other License: $3,000 ($2.72)
Blue Mound government finances - Debt in 2017 (per resident):
- Long Term Debt - Beginning Outstanding - Unspecified Public Purpose: $123,000 ($111.72)
Outstanding Unspecified Public Purpose: $64,000 ($58.13)
Retired Unspecified Public Purpose: $59,000 ($53.59)
Blue Mound government finances - Cash and Securities in 2017 (per resident):
- Other Funds - Cash and Securities: $213,000 ($193.46)
Strongest AM radio stations in Blue Mound:
- WDZ (1050 AM; 1 kW; DECATUR, IL; Owner: NM LICENSING, LLC)
- KXEN (1010 AM; 50 kW; FESTUS-ST. LOUIS, MO; Owner: BDJ RADIO ENTERPRISES, LLC)
- KMOX (1120 AM; 50 kW; ST. LOUIS, MO; Owner: INFINITY BROADCASTING OPERATIONS, INC.)
- WIHM (1410 AM; 1 kW; TAYLORVILLE, IL; Owner: COVENANT NETWORK)
- WSOY (1340 AM; 1 kW; DECATUR, IL; Owner: NM LICENSING, LLC)
- WILL (580 AM; 5 kW; URBANA, IL; Owner: UNIV. OF ILLINOIS BOARD OF TRUSTEES)
- WSCR (670 AM; 50 kW; CHICAGO, IL; Owner: INFINITY BROADCASTING OPERATIONS, INC.)
- WLS (890 AM; 50 kW; CHICAGO, IL; Owner: WLS, INC.)
- WLBH (1170 AM; daytime; 5 kW; MATTOON, IL; Owner: MATTOON BROADCASTING COMPANY)
- WGN (720 AM; 50 kW; CHICAGO, IL; Owner: WGN CONTINENTAL BROADCASTING CO.)
- WBBM (780 AM; 50 kW; CHICAGO, IL; Owner: INFINITY BROADCASTING OPERATIONS, INC.)
- WYLL (1160 AM; 50 kW; CHICAGO, IL; Owner: SCA LICENSE CORPORATION)
- WIBC (1070 AM; 50 kW; INDIANAPOLIS, IN; Owner: EMMIS RADIO LICENSE CORPORATION)
Strongest FM radio stations in Blue Mound:
- WDZQ (95.1 FM; DECATUR, IL; Owner: NM LICENSING, LLC)
- WXFM-FM (99.3 FM; MOUNT ZION, IL; Owner: TECHNICOM, INC.)
- WYDS (93.1 FM; DECATUR, IL; Owner: WEJT, INC.)
- WZUS (100.9 FM; MACON, IL; Owner: THE CROMWELL GROUP, INC. OF ILLINOIS)
- WNLD (88.1 FM; DECATUR, IL; Owner: ILLINOIS BIBLE INSTITUTE)
- WSOY-FM (102.9 FM; DECATUR, IL; Owner: NM LICENSING, LLC)
- WEJT (105.1 FM; SHELBYVILLE, IL; Owner: THE CROMWELL GROUP, INC. OF ILLINOIS)
- WUIS (91.9 FM; SPRINGFIELD, IL; Owner: UNIVERSITY OF IL AT SPRINGFIELD)
- WDBR (103.7 FM; SPRINGFIELD, IL; Owner: SAGA COMMUNICATIONS OF ILLINOIS, LLC)
- WDKR (107.3 FM; MAROA, IL; Owner: WDKR, INC.)
- W242AE (96.3 FM; TAYLORVILLE, IL; Owner: ILLINOIS BIBLE INSTITUTE, INC.)
- WQLZ (92.7 FM; TAYLORVILLE, IL; Owner: LONG NINE, INC.)
- WILL-FM (90.9 FM; URBANA, IL; Owner: UNIV. OF ILLINOIS BOARD OF TRUSTEES)
- WZNX (106.7 FM; SULLIVAN, IL; Owner: WSHY, INC.)
- WTIM-FM (97.3 FM; TAYLORVILLE, IL; Owner: MILLER COMMUNICATIONS INC)
- WSCT (90.5 FM; SPRINGFIELD, IL; Owner: ILLINOIS BIBLE INSTITUTE)
- WMKR (94.3 FM; PANA, IL; Owner: MILLER COMMUNICATIONS, INC.)
- W205BC (88.9 FM; TAYLORVILLE, IL; Owner: BIBLE BROADCASTING NETWORK, INC.)
- WMHX (93.9 FM; LINCOLN, IL; Owner: SAGA COMMUNICATIONS OF ILLINOIS, LLC)
- WFMB-FM (104.5 FM; SPRINGFIELD, IL; Owner: CAPSTAR TX LIMITED PARTNERSHIP)
TV broadcast stations around Blue Mound:
- WRSP-TV (Channel 55; SPRINGFIELD, IL; Owner: SPRINGFIELD BROADCASTING PARTNERS)
- WICS (Channel 20; SPRINGFIELD, IL; Owner: WICS LICENSEE, LLC)
- WBUI (Channel 23; DECATUR, IL; Owner: ACME TV LICENSES OF ILLINOIS, LLC)
- W29BG (Channel 29; DECATUR, IL; Owner: TRINITY BROADCASTING NETWORK, INC.)
- WAND (Channel 17; DECATUR, IL; Owner: WAND(TV) PARTNERSHIP)
- WCIA (Channel 3; CHAMPAIGN, IL; Owner: NEXSTAR BROADCASTING OF CHAMPAIGN, L.L.C.)
- WCFN (Channel 49; SPRINGFIELD, IL; Owner: NEXSTAR BROADCASTING OF CHAMPAIGN, L.L.C.)
- WILL-TV (Channel 12; URBANA, IL; Owner: UNIV. OF ILLINOIS BD. OF TRUSTEES)
- W08DP (Channel 8; SPRINGFIELD, IL; Owner: W. CENTRAL ILLINOIS EDUC'L TELECOMM. CORPORATION)
- W28BE (Channel 28; SPRINGFIELD, IL; Owner: THE MARIAN CENTER)
- W33AY (Channel 33; SPRINGFIELD, IL; Owner: VENTANA TELEVISION, INC.)
Blue Mound fatal accident list:
Mar 10, 2015 07:24 PM, Sr-48, Niles St, Lat: 39.700372, Lon: -89.123881, Vehicles: 1, Persons: 1, Fatalities: 1, Drunk persons involved: 1
Jul 16, 1983 05:45 AM, Lewis St, Vehicles: 1, Persons: 1, Fatalities: 1, Drunk persons involved: 1
- National Bridge Inventory (NBI) Statistics
- 20Number of bridges
- 112ft / 34.4mTotal length
- $427,000Total costs
- 11,915Total average daily traffic
- 1,533Total average daily truck traffic
- 13,671Total future (year 2032) average daily traffic
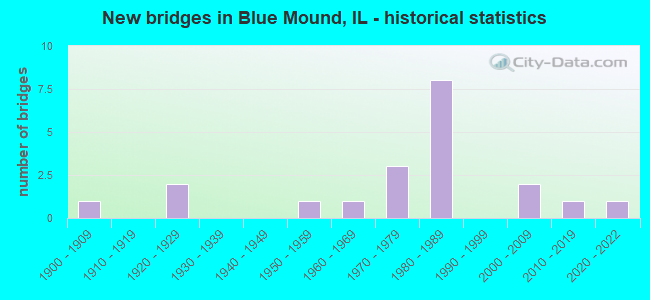
- New bridges - historical statistics
- 11900-1909
- 21920-1929
- 11950-1959
- 11960-1969
- 31970-1979
- 81980-1989
- 22000-2009
- 12010-2019
- 12020-2022
FCC Registered Cell Phone Towers:
1 (See the full list of FCC Registered Cell Phone Towers in Blue Mound)FCC Registered Antenna Towers:
16 (See the full list of FCC Registered Antenna Towers)FCC Registered Broadcast Land Mobile Towers:
5- 324 N Lewis (Lat: 39.701139 Lon: -89.121750), Structure height: 15 m, Call Sign: WQK315,
Assigned Frequencies: 154.145 MHz, Grant Date: 05/27/2005, Expiration Date: 07/06/2015, Cancellation Date: 09/19/2015, Registrant: Business Radio Licensing, 30521 Golden Lantern, Suite E # 501, Laguna Niguel, CA 92677-5993, Phone: (949) 348-8510, Fax: (949) 348-8514, Email:
- Rte 48 And Lincoln Ave (Lat: 39.698639 Lon: -89.113694), Call Sign: WGQ994, Licensee ID: L00072951,
Assigned Frequencies: 156.120 MHz, Grant Date: 08/14/2002, Expiration Date: 08/19/2012, Cancellation Date: 10/20/2012, Registrant: Pleasant View, Township Of, Blue Mound, IL 62513, Phone: (217) 692-2753
- 3/4 Mi N Of Rd 14 3 Mi W (Lat: 39.706694 Lon: -89.176472), Call Sign: KTO583, Licensee ID: L00010909,
Assigned Frequencies: 49.2400 MHz, Grant Date: 01/31/2013, Expiration Date: 03/21/2023, Cancellation Date: 05/27/2023, Registrant: Explorer Pipeline Co, Tulsa, OK 74101, Phone: (918) 493-5100
- 1/4 Block W Of Rt 48 On Lewis St (Lat: 39.701139 Lon: -89.120639), Call Sign: KZS581, Licensee ID: L00025941,
Assigned Frequencies: 153.005 MHz, Grant Date: 12/30/1999, Expiration Date: 01/30/2005, Cancellation Date: 04/02/2005, Registrant: Medco Fertilizer Inc, Blue Mound, IL 62513, Phone: (217) 692-2719
- 1.5 Mi S & 2 Mi W Of Rt 1 (Lat: 39.672250 Lon: -89.159806), Call Sign: KSF218,
Assigned Frequencies: 158.130 MHz, Grant Date: 01/10/2003, Expiration Date: 04/07/2013, Cancellation Date: 12/27/2012, Registrant: Lukas, Nace, Gutierrez & Sachs, LLP, 8300 Greensboro Drive, Suite 1200, Mclean, VA 22102, Phone: (703) 584-8676, Fax: (703) 584-8694, Email:
FCC Registered Microwave Towers:
7- Various Locations (Lat: 39.690583 Lon: -89.065056), Structure height: 6.1 m, Call Sign: WPOP385,
Assigned Frequencies: 928.481 MHz, 952.481 MHz, Grant Date: 08/06/1998, Expiration Date: 08/06/2008, Cancellation Date: 01/19/2006, Certifier: Philip A Canfield, Registrant: Wilkinson Barker Knauer, LLP, 2300 N Street, Suite 700, Washington, DC 20037, Phone: (202) 783-4141, Fax: (202) 783-5851, Email:
- 8137400010176098, Lat: 39.765833 Lon: -89.103750, Type: Mast, Structure height: 6.8 m, Call Sign: WQLX341,
Assigned Frequencies: 3650.00 MHz, Grant Date: 05/18/2010, Expiration Date: 02/14/2021, Cancellation Date: 03/09/2021, Certifier: Bret Westwood, Registrant: Rise Broadband, 61 Inverness Drive East Suite 250, Englewood, CO 80112, Phone: (815) 544-1168, Fax: (815) 380-6512, Email:
- BLMF365A0, Lat: 39.700167 Lon: -89.125028, Type: Building, Structure height: 25 m, Call Sign: WQLX341,
Assigned Frequencies: 3650.00 MHz, Grant Date: 05/18/2010, Expiration Date: 02/14/2021, Cancellation Date: 03/09/2021, Certifier: Bret Westwood, Registrant: Rise Broadband, 61 Inverness Drive East Suite 250, Englewood, CO 80112, Phone: (815) 544-1168, Fax: (815) 380-6512, Email:
- BLMF365A90, Lat: 39.700167 Lon: -89.125028, Type: Building, Structure height: 25 m, Call Sign: WQLX341,
Assigned Frequencies: 3650.00 MHz, Grant Date: 05/18/2010, Expiration Date: 02/14/2021, Cancellation Date: 03/09/2021, Certifier: Bret Westwood, Registrant: Rise Broadband, 61 Inverness Drive East Suite 250, Englewood, CO 80112, Phone: (815) 544-1168, Fax: (815) 380-6512, Email:
- BLMF365A180, Lat: 39.700167 Lon: -89.125028, Type: Building, Structure height: 25 m, Call Sign: WQLX341,
Assigned Frequencies: 3650.00 MHz, Grant Date: 05/18/2010, Expiration Date: 02/14/2021, Cancellation Date: 03/09/2021, Certifier: Bret Westwood, Registrant: Rise Broadband, 61 Inverness Drive East Suite 250, Englewood, CO 80112, Phone: (815) 544-1168, Fax: (815) 380-6512, Email:
- BLMF365A270, Lat: 39.700167 Lon: -89.125028, Type: Building, Structure height: 25 m, Call Sign: WQLX341,
Assigned Frequencies: 3650.00 MHz, Grant Date: 05/18/2010, Expiration Date: 02/14/2021, Cancellation Date: 03/09/2021, Certifier: Bret Westwood, Registrant: Rise Broadband, 61 Inverness Drive East Suite 250, Englewood, CO 80112, Phone: (815) 544-1168, Fax: (815) 380-6512, Email:
- BLUE MOUND GE, 309 Railroad Ave (Lat: 39.700000 Lon: -89.124889), Type: Silo, Structure height: 74 m, Overall height: 76 m, Call Sign: WQNA306,
Assigned Frequencies: 11565.0 MHz, 11485.0 MHz, 11645.0 MHz, 11565.0 MHz, 11485.0 MHz, 11645.0 MHz, 11565.0 MHz, 11485.0 MHz, 11645.0 MHz, 11565.0 MHz... (+19 more), Grant Date: 11/04/2020, Expiration Date: 11/22/2030, Certifier: James E Coleman, Registrant: Micronet Communications, Inc., 812 Lexington Dr, Plano, TX 75075, Phone: (972) 422-7200, Email:
FCC Registered Amateur Radio Licenses:
8 (See the full list of FCC Registered Amateur Radio Licenses in Blue Mound)FAA Registered Aircraft:
5- Aircraft: CESSNA 120 (Category: Land, Seats: 2, Weight: Up to 12,499 Pounds, Speed: 90 mph), Engine: CONT MOTOR C85 SERIES (85 HP) (Reciprocating)
N-Number: 1985V, N1985V, N-1985V, Serial Number: 13994, Year manufactured: 1947, Airworthiness Date: 03/24/1956, Certificate Issue Date: 11/04/1998
Registrant (Partnership): William H Jr Miller, 318 W Aholt St, Blue Mound, IL 62513, Other Owners: Linda K Miller - Aircraft: CESSNA 172I (Category: Land, Seats: 4, Weight: Up to 12,499 Pounds, Speed: 105 mph), Engine: LYCOMING 0-320 SERIES (180 HP) (Reciprocating)
N-Number: 35744, N35744, N-35744, Serial Number: 17256947, Year manufactured: 1968, Airworthiness Date: 09/13/1968, Certificate Issue Date: 05/15/1984
Registrant (Corporation): Noland Farms Inc, 7954 Meridian, Blue Mound, IL 62513 - Aircraft: PIPER PA-15 (Category: Land, Seats: 2, Weight: Up to 12,499 Pounds, Speed: 75 mph), Engine: CONT MOTOR C85 SERIES (85 HP) (Reciprocating)
N-Number: 4161H, N4161H, N-4161H, Serial Number: 15-43, Year manufactured: 1948, Airworthiness Date: 07/25/1958, Certificate Issue Date: 11/09/2016
Registrant (Individual): Wilma L Anderson, 8188 Pleasant View Rd, Blue Mound, IL 62513 - Aircraft: PIPER PA-28-140 (Category: Land, Seats: 4, Weight: Up to 12,499 Pounds, Speed: 107 mph), Engine: LYCOMING 0-320 SERIES (180 HP) (Reciprocating)
N-Number: 631FL, N631FL, N-631FL, Serial Number: 28-7125526, Year manufactured: 1971, Airworthiness Date: 06/07/1971, Certificate Issue Date: 08/02/1979
Registrant (Individual): William H Miller, 318 W Aholt St, Blue Mound, IL 62513 - Aircraft: CESSNA TR182 (Category: Land, Seats: 4, Weight: Up to 12,499 Pounds), Engine: LYCOMING 0-540 SERIES (250 HP) (Reciprocating)
N-Number: 737LM, N737LM, N-737LM, Serial Number: R18200845, Year manufactured: 1978, Airworthiness Date: 01/22/1979, Certificate Issue Date: 06/25/2019
Registrant (Individual): James R Mccoy, 1728 E 2400 North Rd, Blue Mound, IL 62513
| Home Mortgage Disclosure Act Aggregated Statistics For Year 2003 (Based on 1 partial tract) | ||
| C) Refinancings | ||
|---|---|---|
| Number | Average Value | |
| LOANS ORIGINATED | 1 | $64,030 |
| APPLICATIONS APPROVED, NOT ACCEPTED | 0 | $0 |
| APPLICATIONS DENIED | 0 | $0 |
| APPLICATIONS WITHDRAWN | 0 | $0 |
| FILES CLOSED FOR INCOMPLETENESS | 0 | $0 |
Detailed HMDA statistics for the following Tracts: 0027.00
2002 - 2018 National Fire Incident Reporting System (NFIRS) incidents
- Fire incident types reported to NFIRS in Blue Mound, IL
- 11757.1%Structure Fires
- 5526.8%Outside Fires
- 2713.2%Mobile Property/Vehicle Fires
- 62.9%Other
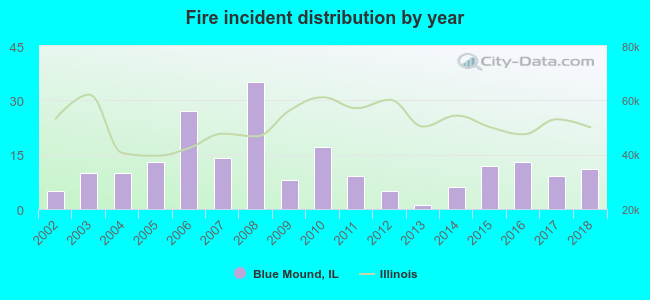 According to the data from the years 2002 - 2018 the average number of fire incidents per year is 12. The highest number of fire incidents - 35 took place in 2008, and the least - 1 in 2013. The data has an increasing trend.
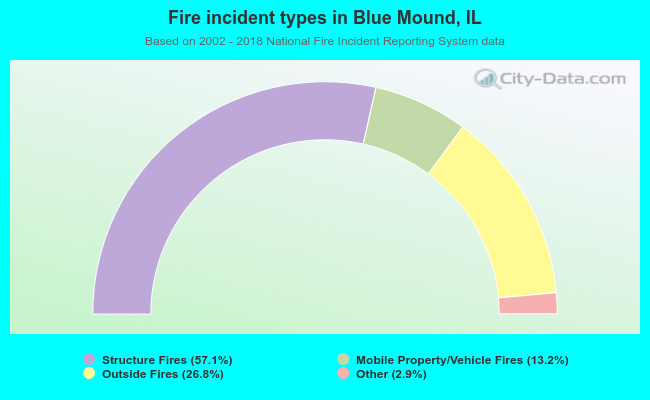 When looking into fire subcategories, the most incidents belonged to: Structure Fires (57.1%), and Outside Fires (26.8%).
| Most common first names in Blue Mound, IL among deceased individuals | ||
| Name | Count | Lived (average) |
|---|---|---|
| John | 21 | 72.8 years |
| James | 17 | 68.9 years |
| William | 14 | 77.5 years |
| Charles | 13 | 76.9 years |
| Robert | 9 | 76.1 years |
| George | 9 | 79.2 years |
| Mary | 8 | 80.1 years |
| Ruth | 6 | 81.8 years |
| Ethel | 6 | 88.2 years |
| Helen | 6 | 82.8 years |
| Most common last names in Blue Mound, IL among deceased individuals | ||
| Last name | Count | Lived (average) |
|---|---|---|
| Brown | 13 | 78.4 years |
| Damery | 12 | 81.8 years |
| Gorden | 10 | 86.7 years |
| Albers | 7 | 86.6 years |
| Pistorius | 7 | 81.7 years |
| Butcher | 6 | 81.7 years |
| Tucker | 6 | 69.7 years |
| Kreher | 6 | 85.3 years |
| Elder | 6 | 81.3 years |
| Beckett | 5 | 72.2 years |
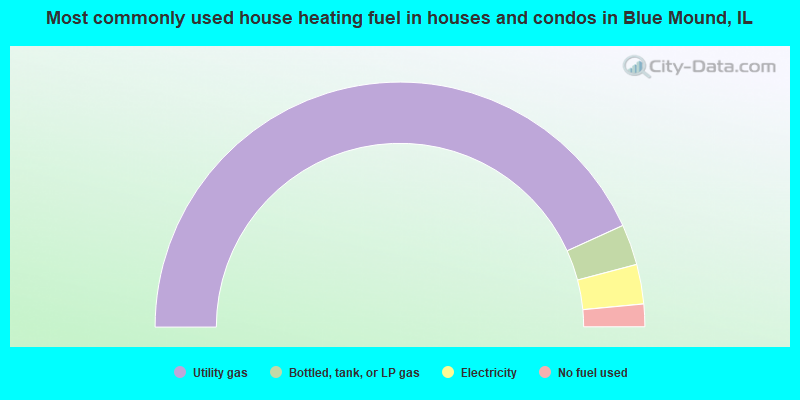
- 86.4%Utility gas
- 5.4%Bottled, tank, or LP gas
- 5.2%Electricity
- 3.0%No fuel used
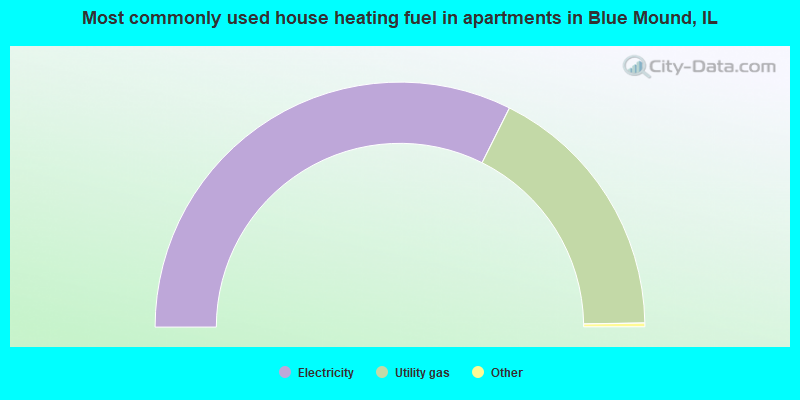
- 65.1%Electricity
- 34.9%Utility gas
Blue Mound compared to Illinois state average:
- Median house value significantly below state average.
- Unemployed percentage significantly below state average.
- Black race population percentage significantly below state average.
- Hispanic race population percentage significantly below state average.
- Foreign-born population percentage significantly below state average.
- Length of stay since moving in significantly below state average.
- House age above state average.

|
Total of 1 patent application in 2008-2024.