Bayview-Montalvin, California
Submit your own pictures of this place and show them to the world
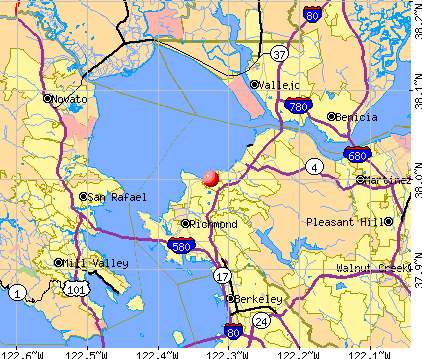
- OSM Map
- General Map
- Google Map
- MSN Map
| Males: 2,600 | |
| Females: 2,705 |
| Median resident age: | 34.4 years |
| California median age: | 33.3 years |
Zip codes: 94806.
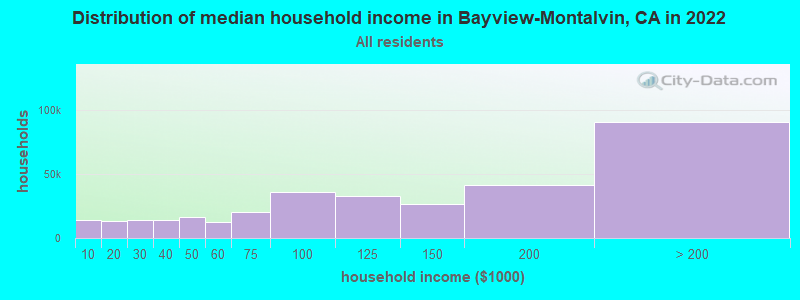
| Bayview-Montalvin: | $95,691 |
| CA: | $91,551 |
Estimated per capita income in 2022: $31,370 (it was $16,056 in 2000)
Bayview-Montalvin CDP income, earnings, and wages data
Estimated median house or condo value in 2022: $503,174 (it was $147,500 in 2000)
| Bayview-Montalvin: | $503,174 |
| CA: | $715,900 |
Mean prices in 2022: all housing units: over $1,000,000; detached houses: over $1,000,000; townhouses or other attached units: $865,348; in 2-unit structures: $602,949; in 3-to-4-unit structures: $772,223; in 5-or-more-unit structures: $695,046; mobile homes: $193,193; occupied boats, rvs, vans, etc.: $261,954
Bayview-Montalvin, CA residents, houses, and apartments details
Detailed information about poverty and poor residents in Bayview-Montalvin, CA


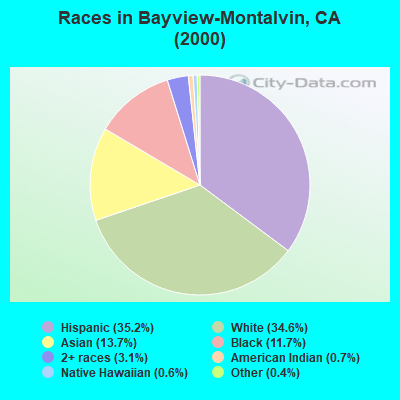
- 1,76135.2%Hispanic
- 1,73334.6%White alone
- 68413.7%Asian alone
- 58611.7%Black alone
- 1543.1%Two or more races
- 340.7%American Indian alone
- 320.6%Native Hawaiian and Other
Pacific Islander alone - 200.4%Other race alone
 Recent articles from our blog. Our writers, many of them Ph.D. graduates or candidates, create easy-to-read articles on a wide variety of topics.

Ancestries: Irish (7.9%), German (7.3%), English (6.4%), Italian (3.5%), United States (3.0%), Portuguese (1.4%).
Current Local Time: PST time zone
Land area: 0.64 square miles.
Population density: 8,317 people per square mile (high).
1,415 residents are foreign born (18.1% Latin America, 8.2% Asia).
| This place: | 28.3% |
| California: | 26.2% |
| Bayview-Montalvin CDP: | 0.8% ($1,138) |
| California: | 0.8% ($1,564) |
Nearest city with pop. 50,000+: West Contra Costa, CA (3.2 miles  , pop. 236,008).
Nearest city with pop. 1,000,000+: Los Angeles, CA (349.3 miles , pop. 3,694,820).
Nearest cities:
), ), ), ), Latitude: 38.00 N, Longitude: 122.33 W
| Here: | 4.5% |
| California: | 5.1% |
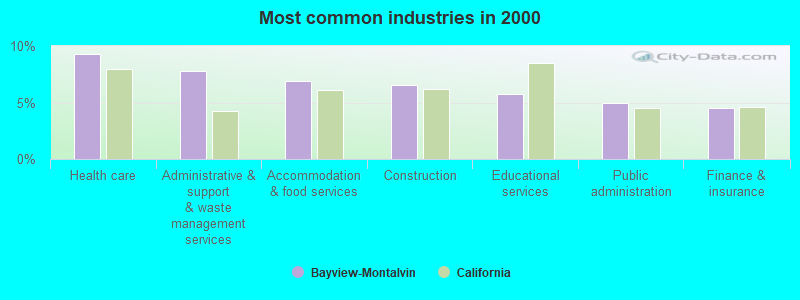
- Health care (9.3%)
- Administrative & support & waste management services (7.8%)
- Accommodation & food services (6.9%)
- Construction (6.5%)
- Educational services (5.8%)
- Public administration (5.0%)
- Finance & insurance (4.5%)
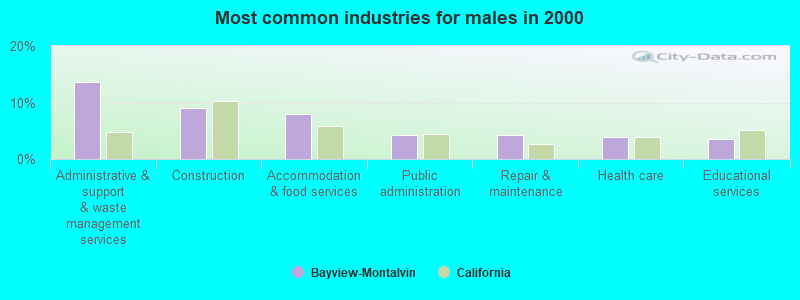
- Administrative & support & waste management services (13.6%)
- Construction (9.0%)
- Accommodation & food services (7.9%)
- Public administration (4.3%)
- Repair & maintenance (4.2%)
- Health care (3.8%)
- Educational services (3.5%)
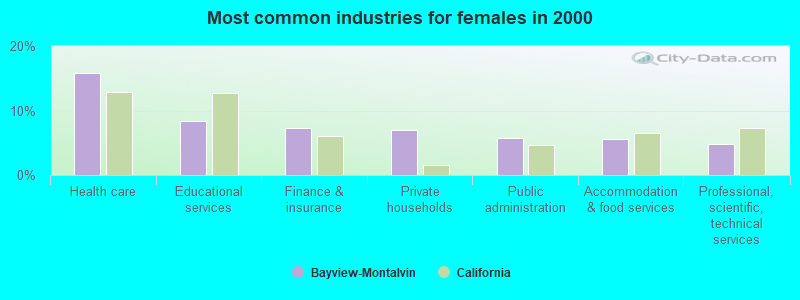
- Health care (15.9%)
- Educational services (8.4%)
- Finance & insurance (7.2%)
- Private households (7.0%)
- Public administration (5.7%)
- Accommodation & food services (5.6%)
- Professional, scientific, technical services (4.8%)
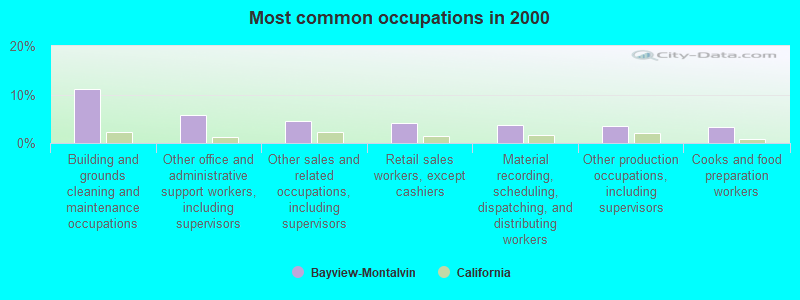
- Building and grounds cleaning and maintenance occupations (11.1%)
- Other office and administrative support workers, including supervisors (5.7%)
- Other sales and related occupations, including supervisors (4.6%)
- Retail sales workers, except cashiers (4.0%)
- Material recording, scheduling, dispatching, and distributing workers (3.7%)
- Other production occupations, including supervisors (3.5%)
- Cooks and food preparation workers (3.3%)
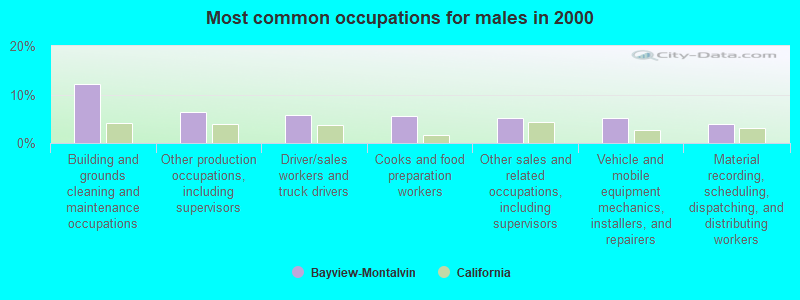
- Building and grounds cleaning and maintenance occupations (12.2%)
- Other production occupations, including supervisors (6.5%)
- Driver/sales workers and truck drivers (5.8%)
- Cooks and food preparation workers (5.5%)
- Other sales and related occupations, including supervisors (5.2%)
- Vehicle and mobile equipment mechanics, installers, and repairers (5.1%)
- Material recording, scheduling, dispatching, and distributing workers (3.9%)
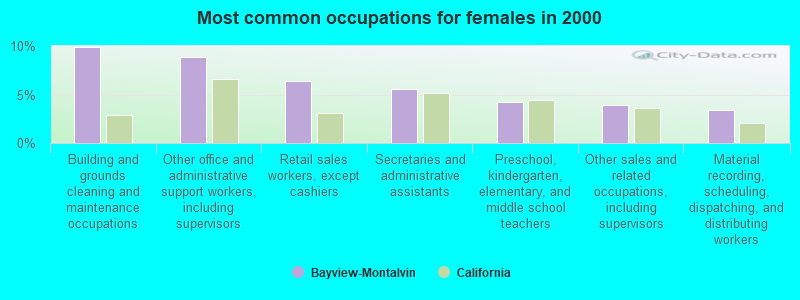
- Building and grounds cleaning and maintenance occupations (9.9%)
- Other office and administrative support workers, including supervisors (8.9%)
- Retail sales workers, except cashiers (6.4%)
- Secretaries and administrative assistants (5.6%)
- Preschool, kindergarten, elementary, and middle school teachers (4.2%)
- Other sales and related occupations, including supervisors (4.0%)
- Material recording, scheduling, dispatching, and distributing workers (3.4%)
Average climate in Bayview-Montalvin, California
Based on data reported by over 4,000 weather stations


(lower is better)
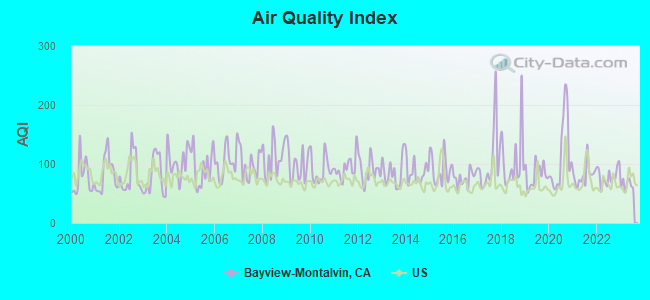
Air Quality Index (AQI) level in 2023 was 64.9. This is about average.
| City: | 64.9 |
| U.S.: | 72.6 |
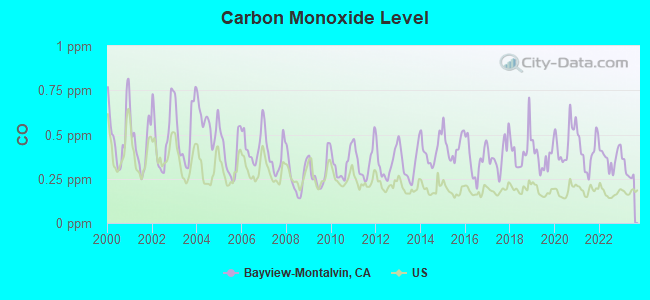
Carbon Monoxide (CO) [ppm] level in 2023 was 0.294. This is about average. Closest monitor was 2.7 miles away from the city center.
| City: | 0.294 |
| U.S.: | 0.251 |
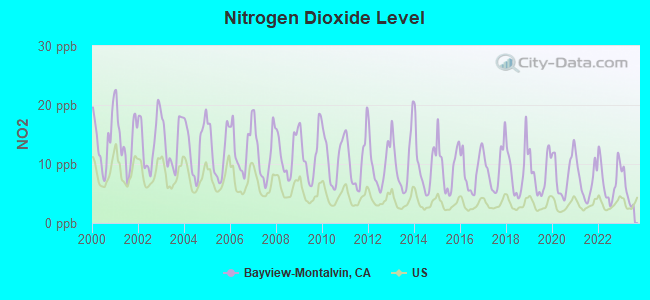
Nitrogen Dioxide (NO2) [ppb] level in 2023 was 5.48. This is about average. Closest monitor was 2.7 miles away from the city center.
| City: | 5.48 |
| U.S.: | 5.11 |
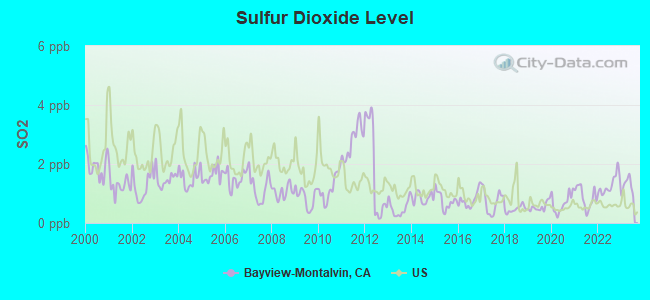
Sulfur Dioxide (SO2) [ppb] level in 2023 was 1.26. This is better than average. Closest monitor was 2.7 miles away from the city center.
| City: | 1.26 |
| U.S.: | 1.51 |
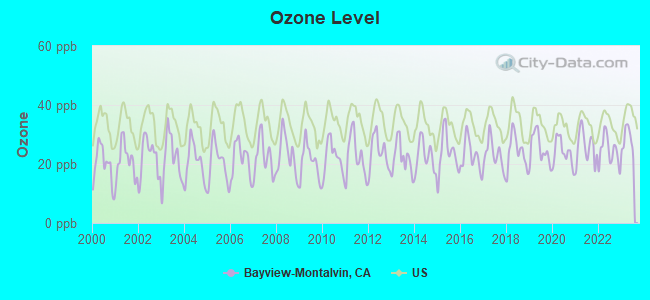
Ozone [ppb] level in 2023 was 28.2. This is about average. Closest monitor was 2.7 miles away from the city center.
| City: | 28.2 |
| U.S.: | 33.3 |
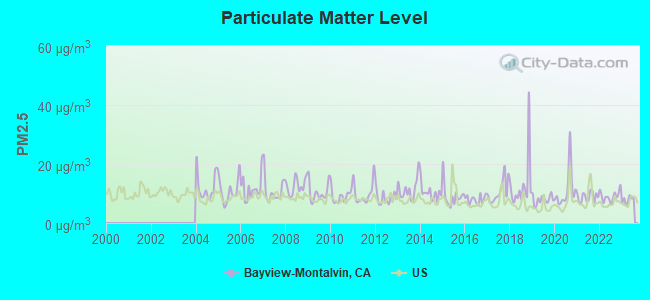
Particulate Matter (PM2.5) [µg/m3] level in 2023 was 7.81. This is about average. Closest monitor was 3.3 miles away from the city center.
| City: | 7.81 |
| U.S.: | 8.11 |
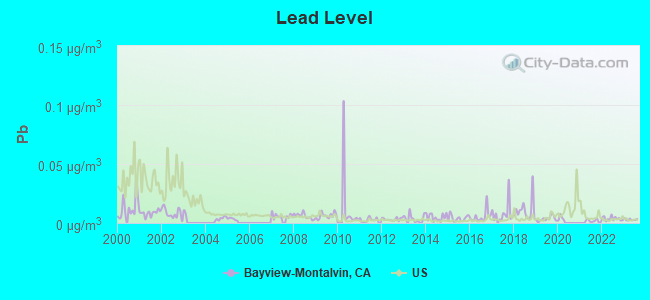
Lead (Pb) [µg/m3] level in 2023 was 0.00290. This is significantly better than average. Closest monitor was 2.7 miles away from the city center.
| City: | 0.00290 |
| U.S.: | 0.00931 |
Earthquake activity:
Bayview-Montalvin-area historical earthquake activity is significantly above California state average. It is 7524% greater than the overall U.S. average.On 4/18/1906 at 13:12:21, a magnitude 7.9 (7.9 UK, Class: Major, Intensity: VIII - XII) earthquake occurred 36.8 miles away from Bayview-Montalvin center, causing $524,000,000 total damage
On 10/18/1989 at 00:04:15, a magnitude 7.1 (6.5 MB, 7.1 MS, 6.9 MW, 7.0 ML) earthquake occurred 68.7 miles away from Bayview-Montalvin center, causing 62 deaths (62 shaking deaths) and 3757 injuries, causing $1,305,032,704 total damage
On 11/4/1927 at 13:51:53, a magnitude 7.5 (7.5 UK) earthquake occurred 225.2 miles away from the city center
On 1/31/1922 at 13:17:28, a magnitude 7.6 (7.6 UK) earthquake occurred 254.2 miles away from the city center
On 7/21/1952 at 11:52:14, a magnitude 7.7 (7.7 UK) earthquake occurred 277.9 miles away from the city center, causing $50,000,000 total damage
On 4/25/1992 at 18:06:04, a magnitude 7.2 (6.3 MB, 7.1 MS, 7.2 MW, 7.1 MW, Depth: 9.4 mi) earthquake occurred 187.4 miles away from Bayview-Montalvin center, causing $75,000,000 total damage
Magnitude types: body-wave magnitude (MB), local magnitude (ML), surface-wave magnitude (MS), moment magnitude (MW)
Natural disasters:
The number of natural disasters in Contra Costa County (18) is near the US average (15).Major Disasters (Presidential) Declared: 11
Emergencies Declared: 3
Causes of natural disasters: Floods: 13, Storms: 7, Winter Storms: 7, Mudslides: 5, Landslides: 4, Drought: 1, Earthquake: 1, Hurricane: 1, Tornado: 1, Wind: 1, Other: 1 (Note: some incidents may be assigned to more than one category).
Hospitals and medical centers near Bayview-Montalvin:
- DOCTORS MEDICAL CENTER PINOLE CAMPUS (Hospital, about 2 miles away; PINOLE, CA)
- DOCTORS MED CTR PINOLE CAMPUS DP SNF (Nursing Home, about 2 miles away; PINOLE, CA)
- SAN PABLO DIALYSIS CENTER (Dialysis Facility, about 3 miles away; SAN PABLO, CA)
- GREENRIDGE SENIOR CARE (Nursing Home, about 4 miles away; RICHMOND, CA)
- CREEKSIDE HEALTHCARE CTR (Nursing Home, about 4 miles away; SAN PABLO, CA)
- VALE HEALTH CARE CENTER (Nursing Home, about 4 miles away; SAN PABLO, CA)
- BAYCREST NURSING CENTER (Nursing Home, about 4 miles away; SAN PABLO, CA)
Amtrak stations near Bayview-Montalvin:
- 5 miles: RICHMOND (16TH ST. & MACDONALD AVE.) . Services: fully wheelchair accessible, enclosed waiting area, public restrooms, public payphones, free short-term parking, call for taxi service, public transit connection.
- 10 miles: BERKELEY (3RD ST. & UNIVERSITY AVE.) . Services: partially wheelchair accessible, public payphones, free short-term parking, free long-term parking, call for taxi service, public transit connection.
- 11 miles: MARTINEZ (401 FERRY ST.) . Services: ticket office, fully wheelchair accessible, enclosed waiting area, public restrooms, public payphones, full-service food facilities, free short-term parking, free long-term parking, call for taxi service, public transit connection.
Colleges/universities with over 2000 students nearest to Bayview-Montalvin:
- Contra Costa College (about 3 miles; San Pablo, CA; Full-time enrollment: 4,249)
- Berkeley City College (about 10 miles; Berkeley, CA; FT enrollment: 3,146)
- University of California-Berkeley (about 10 miles; Berkeley, CA; FT enrollment: 37,127)
- College of Marin (about 13 miles; Kentfield, CA; FT enrollment: 4,489)
- Diablo Valley College (about 15 miles; Pleasant Hill, CA; FT enrollment: 13,015)
- Laney College (about 15 miles; Oakland, CA; FT enrollment: 5,668)
- Academy of Art University (about 16 miles; San Francisco, CA; FT enrollment: 12,352)
Points of interest:
Creek: Garrity Creek (A). Display/hide its location on the map
Parks in Bayview-Montalvin include: Montara Bay Park (1), Pinole Shores Park (2). Display/hide their locations on the map
| This place: | 3.4 people |
| California: | 2.9 people |
| This place: | 79.7% |
| Whole state: | 69.4% |
| This place: | 5.7% |
| Whole state: | 5.9% |
Likely homosexual households (counted as self-reported same-sex unmarried-partner households)
- Lesbian couples: 0.5% of all households
- Gay men: 0.3% of all households
| This place: | 11.7% |
| Whole state: | 14.2% |
| This place: | 4.1% |
| Whole state: | 6.3% |
For population 15 years and over in Bayview-Montalvin:
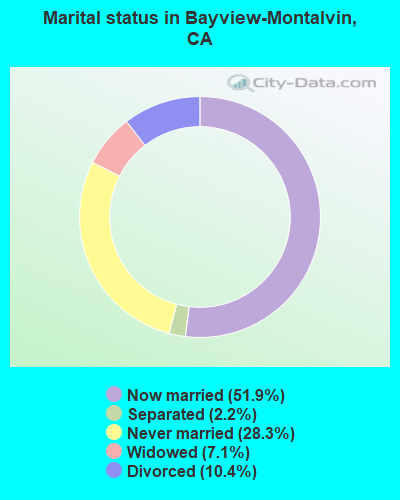
- Never married: 28.3%
- Now married: 51.9%
- Separated: 2.2%
- Widowed: 7.1%
- Divorced: 10.4%
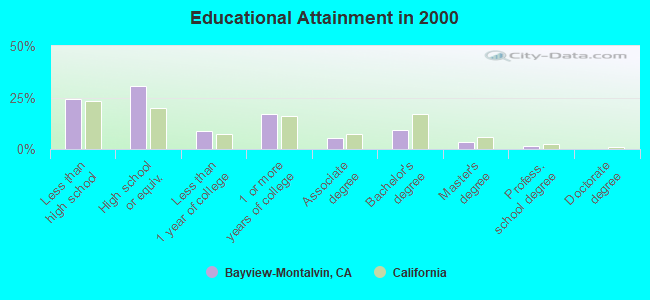
For population 25 years and over in Bayview-Montalvin:
- High school or higher: 75.6%
- Bachelor's degree or higher: 14.1%
- Graduate or professional degree: 4.9%
- Unemployed: 8.8%
- Mean travel time to work (commute): 37.1 minutes
| Here: | 15.3 |
| California average: | 16.1 |


Graphs represent county-level data. Detailed 2008 Election Results
Religion statistics for Bayview-Montalvin, CA (based on Contra Costa County data)


| Religion | Adherents | Congregations |
|---|---|---|
| Catholic | 228,400 | 34 |
| Evangelical Protestant | 81,120 | 352 |
| Other | 48,553 | 123 |
| Mainline Protestant | 32,693 | 101 |
| Black Protestant | 10,395 | 34 |
| Orthodox | 2,435 | 8 |
| None | 645,429 | - |
Food Environment Statistics:
| This county: | 1.78 / 10,000 pop. |
| California: | 2.14 / 10,000 pop. |
| Here: | 0.05 / 10,000 pop. |
| State: | 0.04 / 10,000 pop. |
| This county: | 0.51 / 10,000 pop. |
| State: | 0.62 / 10,000 pop. |
| Contra Costa County: | 1.75 / 10,000 pop. |
| California: | 1.49 / 10,000 pop. |
| Here: | 6.73 / 10,000 pop. |
| State: | 7.42 / 10,000 pop. |
| Here: | 7.1% |
| California: | 7.3% |
| Contra Costa County: | 22.2% |
| California: | 21.3% |
| Contra Costa County: | 16.8% |
| State: | 17.9% |
6.37% of this county's 2021 resident taxpayers lived in other counties in 2020 ($134,084 average adjusted gross income)
| Here: | 6.37% |
| California average: | 5.19% |
0.01% of residents moved from foreign countries ($98 average AGI)
Contra Costa County: 0.01% California average: 0.03%
Top counties from which taxpayers relocated into this county between 2020 and 2021:
| from Alameda County, CA | |
| from San Francisco County, CA | |
| from Santa Clara County, CA |
7.09% of this county's 2020 resident taxpayers moved to other counties in 2021 ($123,334 average adjusted gross income)
| Here: | 7.09% |
| California average: | 6.14% |
0.01% of residents moved to foreign countries ($92 average AGI)
Contra Costa County: 0.01% California average: 0.02%
Top counties to which taxpayers relocated from this county between 2020 and 2021:
| to Alameda County, CA | |
| to Solano County, CA | |
| to San Francisco County, CA |
Strongest AM radio stations in Bayview-Montalvin:
- KNEW (910 AM; 20 kW; OAKLAND, CA; Owner: AMFM RADIO LICENSES, L.L.C.)
- KTRB (860 AM; 50 kW; MODESTO, CA; Owner: PAPPAS RADIO OF CALIFORNIA, A CALIFORNIA LIMITED PARTNERSHIP)
- KCBS (740 AM; 50 kW; SAN FRANCISCO, CA; Owner: INFINITY BROADCASTING OPERATIONS, INC.)
- KIQI (1010 AM; 35 kW; SAN FRANCISCO, CA; Owner: RADIO UNICA OF SAN FRANCISCO LICENSE CORP.)
- KDYA (1190 AM; 10 kW; VALLEJO, CA; Owner: BAYBRIDGE COMMUNICATIONS, L.L.C.)
- KDIA (1640 AM; 10 kW; VALLEJO, CA; Owner: BAYBRIDGE COMMUNICATIONS, L.L.C.)
- KTCT (1050 AM; 50 kW; SAN MATEO, CA; Owner: SUSQUEHANNA RADIO CORP.)
- KNBR (680 AM; 50 kW; SAN FRANCISCO, CA; Owner: KNBR LICO, INC.)
- KFRC (610 AM; 5 kW; SAN FRANCISCO, CA; Owner: INFINITY BROADCASTING CORPORATION OF LOS ANGELES)
- KFAX (1100 AM; 50 kW; SAN FRANCISCO, CA; Owner: GOLDEN GATE BROADCASTING CO, INC.)
- KGO (810 AM; 50 kW; SAN FRANCISCO, CA; Owner: KGO-AM RADIO, INC.)
- KABL (960 AM; 5 kW; OAKLAND, CA; Owner: AMFM RADIO LICENSES, L.L.C.)
- KMZT (1510 AM; 8 kW; SAN RAFAEL, CA; Owner: MOUNT WILSON FM BROADCASTERS, INC.)
Strongest FM radio stations in Bayview-Montalvin:
- K249DJ (97.7 FM; SAN PABLO, CA; Owner: EL CERRITO HIGH SCHOOL)
- KSFB-FM (100.7 FM; SAN RAFAEL, CA; Owner: GOLDEN GATE BROADCASTING COMPANY, INC.)
- KKSF-FM1 (103.7 FM; PLEASANTON, ETC., CA; Owner: AMFM RADIO LICENSES, L.L.C.)
- KLLC (97.3 FM; SAN FRANCISCO, CA; Owner: INFINITY BROADCASTING OPERATIONS, INC.)
- KBLX-FM2 (102.9 FM; PLEASANTON, CA; Owner: ICBC BROADCAST HOLDINGS -CA, INC.)
- KSOL-FM3 (98.9 FM; PLEASANTON, CA; Owner: TMS LICENSE CALIFORNIA, INC)
- KFRC-FM3 (99.7 FM; WALNUT CREEK, CA; Owner: INFINITY KFRC-FM, INC.)
- KZBR-FM1 (95.7 FM; WALNUT CREEK, CA; Owner: BONNEVILLE HOLDING COMPANY)
- KISQ-FM3 (98.1 FM; CONCORD, CA; Owner: AMFM RADIO LICENSES, L.L.C.)
- KDFC-FM (102.1 FM; SAN FRANCISCO, CA; Owner: BONNEVILLE HOLDING COMPANY)
- KMEL-FM1 (106.1 FM; CONCORD, CA; Owner: AMFM RADIO LICENSES, L.L.C.)
- KALX (90.7 FM; BERKELEY, CA; Owner: UNIVERSITY OF CALIFORNIA)
- KDFC-FM1 (102.1 FM; LAFAYETTE, CA; Owner: BONNEVILLE HOLDING COMPANY)
- KOIT-FM2 (96.5 FM; MARTINEZ, ETC., CA; Owner: BONNEVILLE HOLDING CO. C/O KOIT(FM))
- KIOI-FM1 (101.3 FM; WALNUT CREEK, CA; Owner: AMFM RADIO LICENSES, L.L.C.)
- KOIT-FM (96.5 FM; SAN FRANCISCO, CA; Owner: BONNEVILLE HOLDING COMPANY)
- KKSF (103.7 FM; SAN FRANCISCO, CA; Owner: AMFM RADIO LICENSES, L.L.C.)
- KFJO (92.1 FM; WALNUT CREEK, CA; Owner: CHASE RADIO PROPERTIES, L.L.C.)
- KFOG (104.5 FM; SAN FRANCISCO, CA; Owner: KFFG LICO, INC)
- KISQ (98.1 FM; SAN FRANCISCO, CA; Owner: AMFM RADIO LICENSES, L.L.C.)
TV broadcast stations around Bayview-Montalvin:
- KQED (Channel 9; SAN FRANCISCO, CA; Owner: KQED, INC.)
- KGO-TV (Channel 7; SAN FRANCISCO, CA; Owner: KGO TELEVISION, INC.)
- KPIX-TV (Channel 5; SAN FRANCISCO, CA; Owner: CBS BROADCASTING INC.)
- KTVU (Channel 2; OAKLAND, CA; Owner: KTVU PARTNERSHIP)
- KRON-TV (Channel 4; SAN FRANCISCO, CA; Owner: YOUNG BROADCASTING OF SAN FRANCISCO, INC.)
- KMTP-TV (Channel 32; SAN FRANCISCO, CA; Owner: MINORITY TELEVISION PROJECT)
- KBHK-TV (Channel 44; SAN FRANCISCO, CA; Owner: VIACOM TELEVISION STATIONS GROUP OF SAN FRANCISCO INC.)
- KBWB (Channel 20; SAN FRANCISCO, CA; Owner: KBWB LICENSE, INC.)
- KFSF (Channel 66; VALLEJO, CA; Owner: TELEFUTURA SAN FRANCISCO LLC)
- KCNS (Channel 38; SAN FRANCISCO, CA; Owner: WRAY, INC.)
- KSPX (Channel 29; SACRAMENTO, CA; Owner: PAXSON SACRAMENTO LICENSE, INC.)
- KOVR (Channel 13; STOCKTON, CA; Owner: SCI - SACRAMENTO LICENSEE, LLC)
- KXTV (Channel 10; SACRAMENTO, CA; Owner: KXTV, INC.)
- KCRA-TV (Channel 3; SACRAMENTO, CA; Owner: KCRA HEARST-ARGYLE TELEVISION, INC.)
- KTXL (Channel 40; SACRAMENTO, CA; Owner: CHANNEL 40, INC.)
- KUVS (Channel 19; MODESTO, CA; Owner: KUVS LICENSE PARTNERSHIP, G.P.)
- KQCA (Channel 58; STOCKTON, CA; Owner: KCRA HEARST-ARGYLE TELEVISION, INC.)
- KVIE (Channel 6; SACRAMENTO, CA; Owner: KVIE, INC.)
- KTNC-TV (Channel 42; CONCORD, CA; Owner: KTNC LICENSE, LLC)
- KCSM-TV (Channel 60; SAN MATEO, CA; Owner: SAN MATEO COUNTY COMMUNITY COLLEGE DISTRICT)
- KMAX-TV (Channel 31; SACRAMENTO, CA; Owner: UPN STATIONS GROUP INC.)
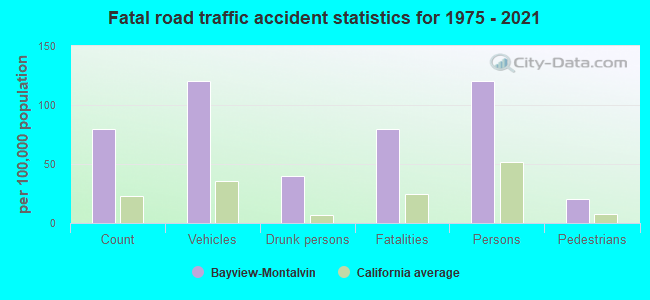
Bayview-Montalvin fatal accident list:
Dec 7, 2018 05:05 AM, Montalvin Dr, Lettia Rd, Lat: 37.998606, Lon: -122.335600, Vehicles: 1, Persons: 1, Pedestrians: 1, Fatalities: 1
Nov 23, 2013 01:30 PM, Cr-Sheryl Drive, Lat: 37.995903, Lon: -122.333400, Vehicles: 1, Persons: 2, Fatalities: 1
Mar 24, 2012 06:54 PM, Cr-San Pablo Ave, Tara Hills Dr., Lat: 37.999772, Lon: -122.326531, Vehicles: 1, Persons: 2, Fatalities: 1, Drunk persons involved: 1
- National Bridge Inventory (NBI) Statistics
- 1Number of bridges
- 13ft / 4.2mTotal length
- $1,874,000Total costs
- 3,124Total average daily traffic
- 62Total average daily truck traffic
- 5,063Total future (year 2037) average daily traffic
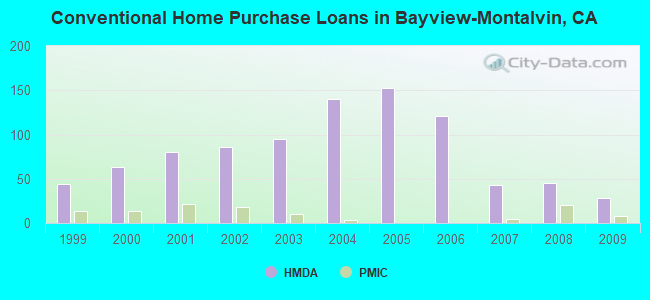
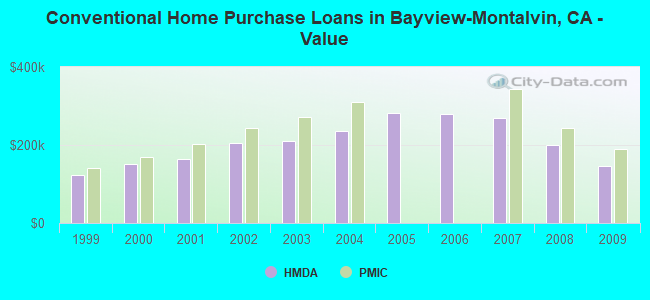
| Home Mortgage Disclosure Act Aggregated Statistics For Year 2009 (Based on 1 full tract) | ||||||||||||
| A) FHA, FSA/RHS & VA Home Purchase Loans | B) Conventional Home Purchase Loans | C) Refinancings | D) Home Improvement Loans | F) Non-occupant Loans on < 5 Family Dwellings (A B C & D) | G) Loans On Manufactured Home Dwelling (A B C & D) | |||||||
|---|---|---|---|---|---|---|---|---|---|---|---|---|
| Number | Average Value | Number | Average Value | Number | Average Value | Number | Average Value | Number | Average Value | Number | Average Value | |
| LOANS ORIGINATED | 23 | $203,970 | 28 | $147,136 | 19 | $194,335 | 1 | $71,560 | 10 | $143,592 | 1 | $78,240 |
| APPLICATIONS APPROVED, NOT ACCEPTED | 5 | $242,532 | 10 | $148,649 | 5 | $214,672 | 0 | $0 | 1 | $184,140 | 1 | $43,890 |
| APPLICATIONS DENIED | 2 | $181,755 | 8 | $117,235 | 31 | $220,335 | 4 | $31,008 | 1 | $23,850 | 1 | $49,610 |
| APPLICATIONS WITHDRAWN | 4 | $190,342 | 3 | $145,977 | 6 | $177,145 | 0 | $0 | 1 | $95,410 | 0 | $0 |
| FILES CLOSED FOR INCOMPLETENESS | 0 | $0 | 3 | $86,187 | 6 | $200,202 | 0 | $0 | 2 | $71,555 | 0 | $0 |
Detailed HMDA statistics for the following Tracts: 3640.01
| Private Mortgage Insurance Companies Aggregated Statistics For Year 2009 (Based on 1 full tract) | ||||
| A) Conventional Home Purchase Loans | B) Refinancings | |||
|---|---|---|---|---|
| Number | Average Value | Number | Average Value | |
| LOANS ORIGINATED | 8 | $190,939 | 1 | $252,840 |
| APPLICATIONS APPROVED, NOT ACCEPTED | 8 | $213,958 | 0 | $0 |
| APPLICATIONS DENIED | 2 | $174,125 | 0 | $0 |
| APPLICATIONS WITHDRAWN | 2 | $180,325 | 0 | $0 |
| FILES CLOSED FOR INCOMPLETENESS | 1 | $228,030 | 0 | $0 |
Detailed PMIC statistics for the following Tracts: 3640.01
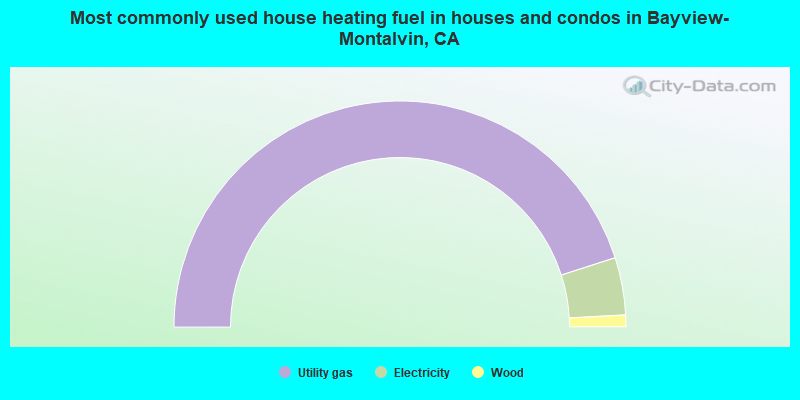
- 90.2%Utility gas
- 8.2%Electricity
- 1.7%Wood
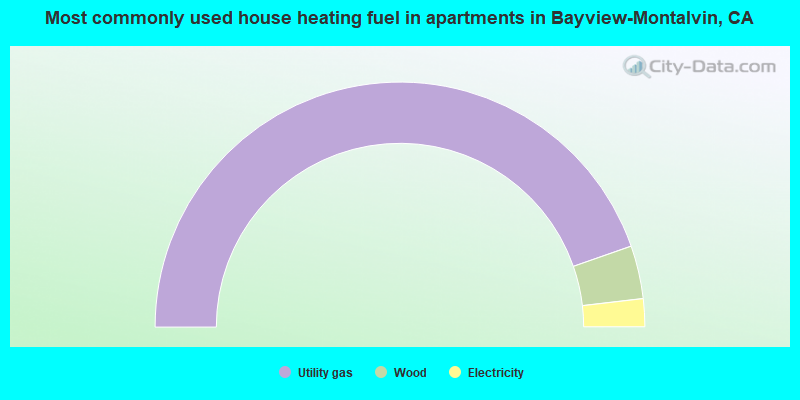
- 89.3%Utility gas
- 7.0%Wood
- 3.7%Electricity
Bayview-Montalvin compared to California state average:
- Unemployed percentage below state average.
- Black race population percentage above state average.
- Renting percentage significantly below state average.
- Length of stay since moving in significantly above state average.
- Number of rooms per house significantly below state average.
- House age significantly below state average.
- Percentage of population with a bachelor's degree or higher below state average.
Bayview-Montalvin on our top lists:
- #2 on the list of "Top 101 cities with largest percentage of females in industries: private households (population 5,000+)"
- #4 on the list of "Top 101 cities with the most residents born in Other Central America (population 500+)"
- #7 on the list of "Top 101 cities with largest percentage of males in occupations: cooks and food preparation workers (population 5,000+)"
- #10 on the list of "Top 101 cities with largest percentage of females in occupations: supervisors of construction and extraction workers (population 5,000+)"
- #12 on the list of "Top 101 cities with largest percentage of males in industries: sporting goods, camera, and hobby and toy stores (population 5,000+)"
- #15 on the list of "Top 101 cities with largest percentage of females in occupations: electrical equipment mechanics and other installation, maintenance, and repair occupations including supervisors (population 5,000+)"
- #19 on the list of "Top 101 cities with largest percentage of males in industries: petroleum and coal products (population 5,000+)"
- #20 on the list of "Top 101 cities with largest percentage of females in industries: sewing, needlework, and piece goods stores (population 5,000+)"
- #24 on the list of "Top 100 most racially diverse cities (pop. 5,000+)"
- #24 on the list of "Top 101 cities with largest percentage of males in industries: paper and paper products merchant wholesalers (population 5,000+)"
- #30 on the list of "Top 101 cities with largest percentage of females in industries: used merchandise, gift, novelty, and souvenir, and other miscellaneous stores (population 5,000+)"
- #31 on the list of "Top 101 cities with largest percentage of males in occupations: other protective service workers including supervisors (population 5,000+)"
- #33 on the list of "Top 101 cities with the most residents born in Nicaragua (population 500+)"
- #34 on the list of "Top 101 cities with largest percentage of males in industries: book stores and news dealers (population 5,000+)"
- #40 on the list of "Top 101 cities with largest percentage of males in occupations: other food preparation and serving workers including supervisors (population 5,000+)"
- #42 on the list of "Top 101 cities with largest percentage of females in industries: broadcasting and telecommunications (population 5,000+)"
- #43 on the list of "Top 101 cities with largest percentage of females in industries: miscellaneous nondurable goods merchant wholesalers (population 5,000+)"
- #44 on the list of "Top 101 cities with largest percentage of females in occupations: retail sales workers except cashiers (population 5,000+)"
- #49 on the list of "Top 101 cities with the most cars per house, population 5,000+"
- #56 on the list of "Top 101 cities with largest percentage of females in industries: groceries and related products merchant wholesalers (population 5,000+)"
- #10 on the list of "Top 101 counties with the largest increase in the number of infant deaths per 1000 residents 2000-2006 to 2007-2013 (pop. 50,000+)"
- #15 on the list of "Top 101 counties with the lowest Sulfur Oxides Annual air pollution readings in 2012 (µg/m3)"
- #17 on the list of "Top 101 counties with the highest Nitrogen Dioxide air pollution readings in 2012 (ppm)"
- #31 on the list of "Top 101 counties with the highest percentage of residents that drank alcohol in the past 30 days"
- #34 on the list of "Top 101 counties with the highest surface withdrawal of fresh water for public supply (pop. 50,000+)"