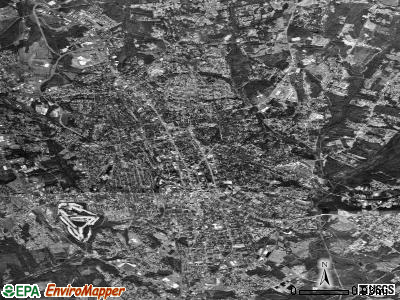
Anderson, South Carolina
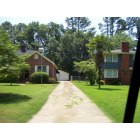
Anderson: In a neighborhood in Anderson SC

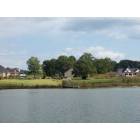
Anderson: Sunset at Lake Hartwell
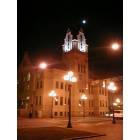
Anderson: Old City Hall after sundown. User comment: This is NOT City Hall, it is the Historic Court House.
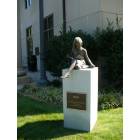
Anderson: in front of downtown library
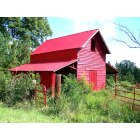
Anderson: The Red Barn
Anderson: Palm trees in Anderson SC
Anderson
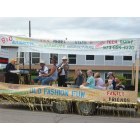
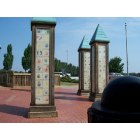
Anderson: TYPICAL AMERICANA IN ANDERSON, SOUTH CAROLINA.
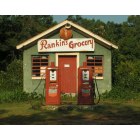
Anderson: Old Time Grocery
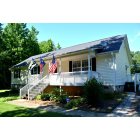
Anderson: Anderson SC
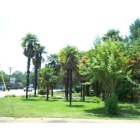
Anderson: Palm trees in Anderson SC
- see
27
more - add
your
Submit your own pictures of this city and show them to the world
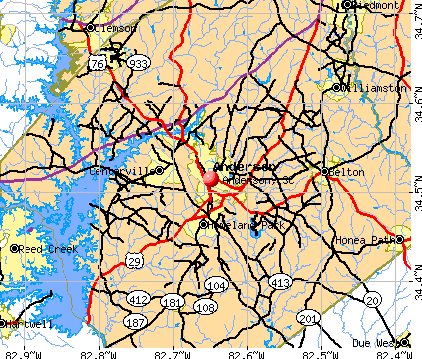
- OSM Map
- General Map
- Google Map
- MSN Map
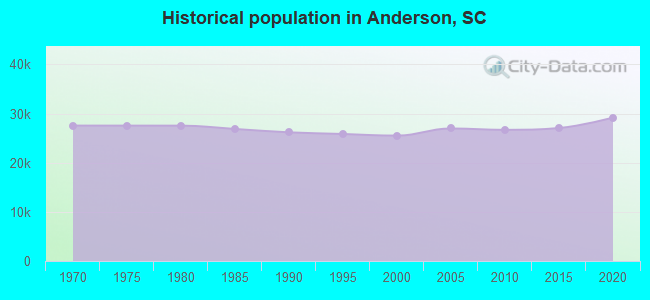
Population change since 2000: +16.7%
 |
| Males: 13,659 | |
| Females: 16,112 |
| Median resident age: | 33.0 years |
| South Carolina median age: | 40.5 years |
Zip codes: 29621, 29624, 29625, 29627.
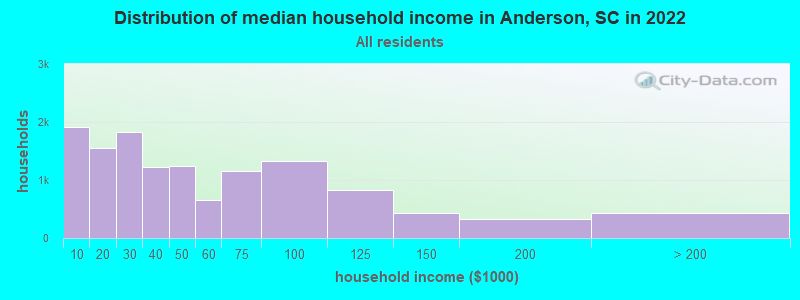
Anderson Zip Code Map| Anderson: | $40,687 |
| SC: | $64,115 |
Estimated per capita income in 2022: $26,934 (it was $18,577 in 2000)
Anderson city income, earnings, and wages data
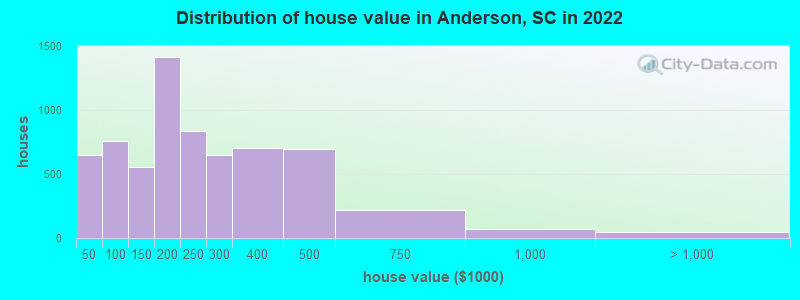
Estimated median house or condo value in 2022: $216,804 (it was $83,800 in 2000)
| Anderson: | $216,804 |
| SC: | $254,600 |
Mean prices in 2022: all housing units: $270,967; detached houses: $301,070; townhouses or other attached units: $216,062; in 2-unit structures: $100,410; in 3-to-4-unit structures: $371,821; in 5-or-more-unit structures: $184,931; mobile homes: $78,481; occupied boats, rvs, vans, etc.: $71,913
Median gross rent in 2022: $845.
(18.6% for White Non-Hispanic residents, 35.5% for Black residents, 51.6% for Hispanic or Latino residents, 82.4% for other race residents, 30.5% for two or more races residents)
Detailed information about poverty and poor residents in Anderson, SC


Compare current foreclosures in Anderson, SC:
| Photo | Address | Area | Beds / Baths | Price | Details |
|---|---|---|---|---|---|

|
#1
N Prince St
Anderson, SC 29624
|
- sq. feet
|
2 baths 2 beds |
$59,900
|
show details |

|
#2
Leftwich Ln
Anderson, SC 29621
|
1,527 sq. feet
|
2 baths 3 beds |
show details | |

|
#3
Harris Bridge Rd
Anderson, SC 29621
|
2,618 sq. feet
|
3 baths 3 beds |
show details | |

|
#4
Scott Rd
Anderson, SC 29621
|
1,648 sq. feet
|
2 baths 3 beds |
show details | |

|
#5
Sunny Shore Ln
Anderson, SC 29621
|
1,655 sq. feet
|
- baths 3 beds |
show details | |

|
#6
Canter Ln
Anderson, SC 29626
|
1,792 sq. feet
|
- baths - beds |
show details | |

|
#7
Sam Mcgee Rd
Anderson, SC 29621
|
2,157 sq. feet
|
- baths 4 beds |
show details | |

|
#8
Woodland Dr Apt J
Anderson, SC 29621
|
- sq. feet
|
- baths - beds |
show details | |

|
#9
Berry Ln
Anderson, SC 29624
|
- sq. feet
|
- baths - beds |
show details | |

|
#10
Sherry Dr
Anderson, SC 29621
|
- sq. feet
|
- baths - beds |
show details |
| Photo | Address | Area | Beds / Baths | Price | Details |
|---|---|---|---|---|---|

|
#11
Sunrise Harbor Dr
Anderson, SC 29621
|
- sq. feet
|
- baths - beds |
show details | |

|
#12
Bronson Rdg
Anderson, SC 29621
|
- sq. feet
|
- baths - beds |
show details | |

|
#13
Norfolk Cir
Anderson, SC 29625
|
- sq. feet
|
- baths - beds |
show details | |

|
#14
Nautique Ct
Anderson, SC 29625
|
- sq. feet
|
- baths - beds |
show details | |

|
#15
Charlestowne Way Apt D
Anderson, SC 29621
|
- sq. feet
|
- baths - beds |
show details | |

|
#16
Palmetto Ln # 423
Anderson, SC 29625
|
- sq. feet
|
- baths - beds |
show details | |

|
#17
Lafrance Rd
Anderson, SC 29625
|
- sq. feet
|
- baths - beds |
show details | |

|
#18
Obannon Ct
Anderson, SC 29621
|
- sq. feet
|
- baths - beds |
show details | |

|
#19
Valley Rd
Anderson, SC 29625
|
- sq. feet
|
- baths - beds |
show details | |

|
#20
Combine Ln
Anderson, SC 29624
|
- sq. feet
|
- baths - beds |
show details |
| Photo | Address | Area | Beds / Baths | Price | Details |
|---|---|---|---|---|---|

|
#21
Corning St
Anderson, SC 29624
|
- sq. feet
|
- baths - beds |
show details | |

|
#22
Reflection Dr
Anderson, SC 29625
|
- sq. feet
|
- baths - beds |
show details | |

|
#23
Samuel Camp Rd
Anderson, SC 29624
|
- sq. feet
|
- baths - beds |
show details | |

|
#24
Travis Ln
Anderson, SC 29626
|
- sq. feet
|
- baths - beds |
show details | |

|
#25
Old North Church Rd
Anderson, SC 29621
|
- sq. feet
|
- baths - beds |
show details | |

|
#26
E Benson St Apt 71
Anderson, SC 29624
|
- sq. feet
|
- baths - beds |
show details | |

|
#27
Celebration Ave
Anderson, SC 29625
|
- sq. feet
|
- baths - beds |
show details | |

|
#28
Norfolk Cir
Anderson, SC 29625
|
- sq. feet
|
- baths - beds |
show details | |

|
#29
S Main St
Anderson, SC 29624
|
- sq. feet
|
- baths - beds |
show details | |

|
#30
Kingsboro Rd
Anderson, SC 29626
|
- sq. feet
|
- baths - beds |
show details |
| Photo | Address | Area | Beds / Baths | Price | Details |
|---|---|---|---|---|---|

|
#31
Druid Hills Dr
Anderson, SC 29621
|
- sq. feet
|
- baths - beds |
show details | |

|
#32
Highway 187
Anderson, SC 29625
|
- sq. feet
|
- baths - beds |
show details | |

|
#33
E Park Dr
Anderson, SC 29621
|
- sq. feet
|
- baths - beds |
show details | |

|
#34
Ashley Ave
Anderson, SC 29624
|
- sq. feet
|
- baths - beds |
show details | |

|
#35
Edwards Dr
Anderson, SC 29626
|
- sq. feet
|
- baths - beds |
show details | |

|
#36
N Fant St
Anderson, SC 29621
|
- sq. feet
|
- baths - beds |
show details | |

|
#37
Sentimental Ln
Anderson, SC 29625
|
- sq. feet
|
- baths - beds |
show details | |

|
#38
Camellia Dr
Anderson, SC 29625
|
- sq. feet
|
- baths - beds |
show details | |

|
#39
Aycock Dr
Anderson, SC 29621
|
- sq. feet
|
- baths - beds |
show details | |

|
#40
Greenland Rd
Anderson, SC 29626
|
- sq. feet
|
- baths - beds |
show details |
| Photo | Address | Area | Beds / Baths | Price | Details |
|---|---|---|---|---|---|

|
#41
Travis Ln
Anderson, SC 29626
|
- sq. feet
|
- baths - beds |
show details | |

|
#42
Burns Bridge Rd
Anderson, SC 29625
|
- sq. feet
|
- baths - beds |
show details | |

|
#43
Shamrock Ln
Anderson, SC 29621
|
- sq. feet
|
- baths - beds |
show details | |

|
#44
Dobbins Bridge Rd
Anderson, SC 29626
|
- sq. feet
|
- baths - beds |
show details | |

|
#45
Altamont Ct
Anderson, SC 29621
|
- sq. feet
|
- baths - beds |
show details | |

|
#46
Leawood Ave
Anderson, SC 29621
|
- sq. feet
|
- baths - beds |
show details | |

|
#47
Woodmont Cir
Anderson, SC 29624
|
- sq. feet
|
- baths - beds |
show details | |

|
#48
Rhodehaven Dr
Anderson, SC 29625
|
- sq. feet
|
- baths - beds |
show details | |

|
#49
Mcclain Lake Dr
Anderson, SC 29625
|
- sq. feet
|
- baths - beds |
show details | |

|
Check over 1 million property listings on Foreclosure.com!
|
browse all offers | |||


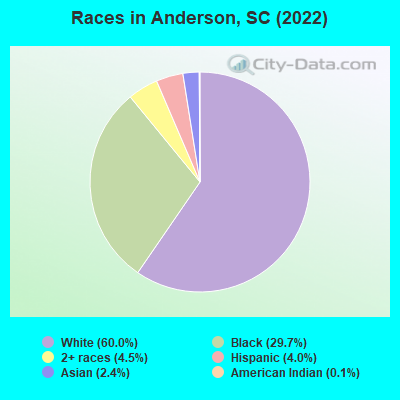
- 18,04760.0%White alone
- 8,94129.7%Black alone
- 1,3434.5%Two or more races
- 1,2054.0%Hispanic
- 7192.4%Asian alone
- 330.1%American Indian alone
- 150.05%Native Hawaiian and Other
Pacific Islander alone - 80.03%Other race alone
Races in Anderson detailed stats: ancestries, foreign born residents, place of birth
According to our research of South Carolina and other state lists, there were 30 registered sex offenders living in Anderson, South Carolina as of May 07, 2024.
The ratio of all residents to sex offenders in Anderson is 931 to 1.
Type |
2009 |
2010 |
2011 |
2012 |
2013 |
2014 |
2015 |
2016 |
2017 |
2018 |
2019 |
2020 |
2021 |
2022 |
|---|---|---|---|---|---|---|---|---|---|---|---|---|---|---|
| Murders (per 100,000) | 1 (3.7) | 7 (26.2) | 2 (7.4) | 7 (25.8) | 3 (11.2) | 3 (11.1) | 2 (7.3) | 2 (7.3) | 2 (7.2) | 0 (0.0) | 5 (18.2) | 2 (7.2) | 0 (0.0) | 2 (6.8) |
| Rapes (per 100,000) | 8 (29.5) | 14 (52.5) | 10 (37.0) | 10 (36.9) | 21 (78.3) | 28 (103.2) | 27 (98.6) | 29 (105.4) | 14 (50.5) | 20 (73.0) | 12 (43.6) | 13 (46.7) | 20 (71.9) | 11 (37.4) |
| Robberies (per 100,000) | 57 (210.0) | 38 (142.4) | 51 (188.9) | 38 (140.1) | 43 (160.4) | 51 (188.0) | 49 (179.0) | 48 (174.4) | 19 (68.5) | 24 (87.5) | 17 (61.8) | 8 (28.8) | 25 (89.8) | 14 (47.6) |
| Assaults (per 100,000) | 141 (519.5) | 145 (543.4) | 149 (551.9) | 195 (718.8) | 212 (790.7) | 187 (689.3) | 166 (606.5) | 218 (792.1) | 145 (522.9) | 117 (426.8) | 84 (305.5) | 176 (632.8) | 241 (865.9) | 154 (523.8) |
| Burglaries (per 100,000) | 408 (1,503) | 474 (1,776) | 482 (1,785) | 388 (1,430) | 511 (1,906) | 447 (1,648) | 313 (1,144) | 394 (1,432) | 230 (829.5) | 189 (689.4) | 125 (454.6) | 121 (435.0) | 222 (797.7) | 242 (823.2) |
| Thefts (per 100,000) | 1,359 (5,007) | 1,353 (5,070) | 1,411 (5,227) | 1,464 (5,397) | 1,770 (6,602) | 1,550 (5,713) | 1,477 (5,396) | 1,648 (5,988) | 1,312 (4,732) | 1,579 (5,760) | 1,135 (4,128) | 1,523 (5,475) | 1,529 (5,494) | 1,353 (4,602) |
| Auto thefts (per 100,000) | 111 (408.9) | 118 (442.2) | 142 (526.0) | 126 (464.5) | 140 (522.2) | 163 (600.8) | 195 (712.4) | 152 (552.3) | 127 (458.0) | 106 (386.6) | 80 (290.9) | 135 (485.3) | 197 (707.8) | 133 (452.4) |
| Arson (per 100,000) | 8 (29.5) | 5 (18.7) | 11 (40.7) | 7 (25.8) | 10 (37.3) | 7 (25.8) | 4 (14.6) | 7 (25.4) | 5 (18.0) | 7 (25.5) | 4 (14.5) | 12 (43.1) | 11 (39.5) | 15 (51.0) |
| City-Data.com crime index | 536.0 | 608.3 | 587.6 | 620.0 | 730.5 | 690.9 | 621.4 | 693.5 | 463.9 | 479.6 | 371.1 | 475.2 | 589.8 | 440.5 |
The City-Data.com crime index weighs serious crimes and violent crimes more heavily. Higher means more crime, U.S. average is 246.1. It adjusts for the number of visitors and daily workers commuting into cities.
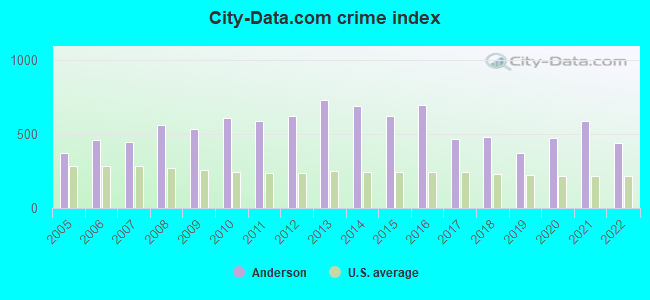
Crime rate in Anderson detailed stats: murders, rapes, robberies, assaults, burglaries, thefts, arson
Full-time law enforcement employees in 2021, including police officers: 126 (92 officers - 78 male; 14 female).
| Officers per 1,000 residents here: | 3.31 |
| South Carolina average: | 2.21 |
 Recent articles from our blog. Our writers, many of them Ph.D. graduates or candidates, create easy-to-read articles on a wide variety of topics.

 | 70s/80s Anderson Memories... (14 replies) |
| Anderson school districts (3 replies) |
| Anderson, South Carolina Retail (155 replies) |
| Rosewood Center, Anderson, South Carolina (14 replies) |
| Anderson, South Carolina: Dining and Restuarants (16 replies) |
| Should I retire to Anderson County, SC? (8 replies) |
Latest news from Anderson, SC collected exclusively by city-data.com from local newspapers, TV, and radio stations
Ancestries: American (14.2%), English (10.1%), Irish (6.0%), German (3.4%), European (3.1%), Ukrainian (2.5%).
Current Local Time: EST time zone
Incorporated on 12/19/1833
Elevation: 771 feet
Land area: 13.8 square miles.
Population density: 2,151 people per square mile (low).
1,518 residents are foreign born (2.2% Asia, 1.9% Latin America, 0.6% Europe).
| This city: | 5.0% |
| South Carolina: | 5.3% |
Median real estate property taxes paid for housing units with mortgages in 2022: $1,488 (0.7%)
Median real estate property taxes paid for housing units with no mortgage in 2022: $1,176 (0.5%)
Nearest city with pop. 50,000+: Greenville, SC  (27.3 miles , pop. 56,002).
Nearest city with pop. 200,000+: Atlanta, GA (113.2 miles , pop. 416,474).
Nearest city with pop. 1,000,000+: Philadelphia, PA (560.4 miles , pop. 1,517,550).
Nearest cities:
), ), )Latitude: 34.51 N, Longitude: 82.65 W
Daytime population change due to commuting: +8,573 (+28.5%)
Workers who live and work in this city: 6,580 (50.5%)
Area code: 864
Anderson, South Carolina accommodation & food services, waste management - Economy and Business Data
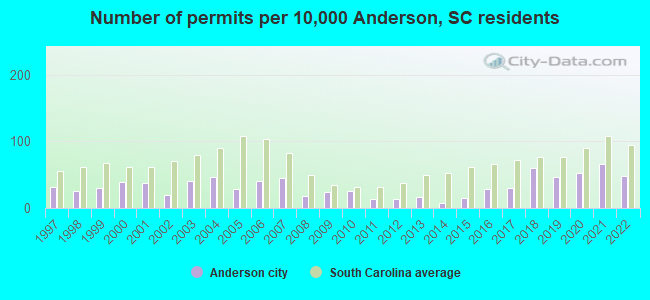
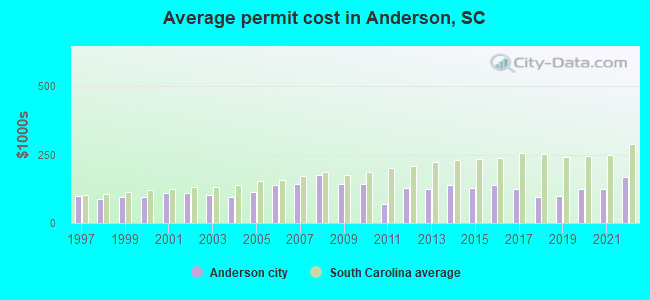
Single-family new house construction building permits:
- 2022: 122 buildings, average cost: $166,900
- 2021: 169 buildings, average cost: $123,900
- 2020: 134 buildings, average cost: $122,600
- 2019: 120 buildings, average cost: $98,200
- 2018: 154 buildings, average cost: $96,800
- 2017: 76 buildings, average cost: $126,200
- 2016: 72 buildings, average cost: $137,800
- 2015: 39 buildings, average cost: $128,900
- 2014: 18 buildings, average cost: $139,100
- 2013: 40 buildings, average cost: $125,000
- 2012: 35 buildings, average cost: $128,600
- 2011: 33 buildings, average cost: $68,700
- 2010: 63 buildings, average cost: $140,600
- 2009: 62 buildings, average cost: $140,600
- 2008: 47 buildings, average cost: $175,700
- 2007: 116 buildings, average cost: $141,900
- 2006: 102 buildings, average cost: $138,500
- 2005: 75 buildings, average cost: $112,000
- 2004: 117 buildings, average cost: $96,600
- 2003: 104 buildings, average cost: $104,100
- 2002: 51 buildings, average cost: $109,200
- 2001: 94 buildings, average cost: $110,300
- 2000: 100 buildings, average cost: $96,900
- 1999: 76 buildings, average cost: $97,000
- 1998: 65 buildings, average cost: $86,500
- 1997: 80 buildings, average cost: $98,100
| Here: | 3.3% |
| South Carolina: | 3.1% |
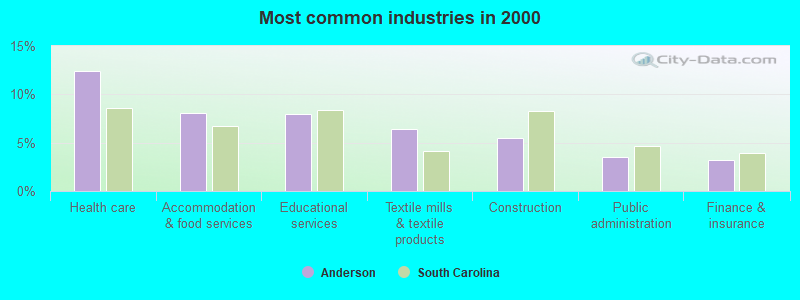
- Health care (12.4%)
- Accommodation & food services (8.0%)
- Educational services (7.9%)
- Textile mills & textile products (6.4%)
- Construction (5.5%)
- Public administration (3.5%)
- Finance & insurance (3.2%)
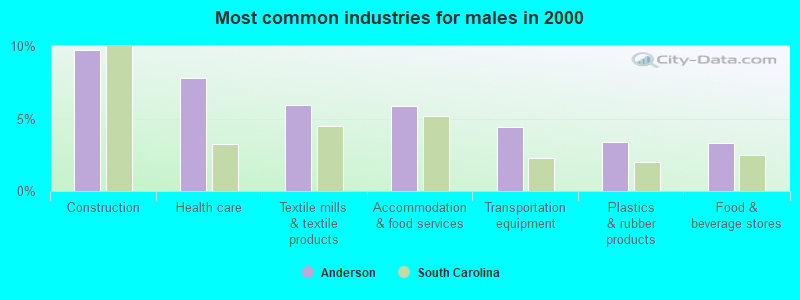
- Construction (9.8%)
- Health care (7.8%)
- Textile mills & textile products (5.9%)
- Accommodation & food services (5.9%)
- Transportation equipment (4.4%)
- Plastics & rubber products (3.4%)
- Food & beverage stores (3.3%)
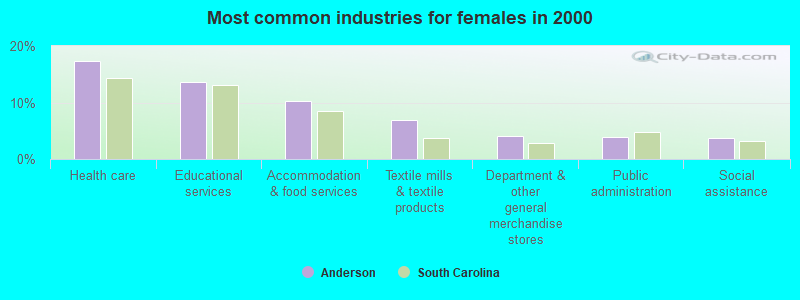
- Health care (17.3%)
- Educational services (13.6%)
- Accommodation & food services (10.3%)
- Textile mills & textile products (7.0%)
- Department & other general merchandise stores (4.0%)
- Public administration (3.8%)
- Social assistance (3.8%)
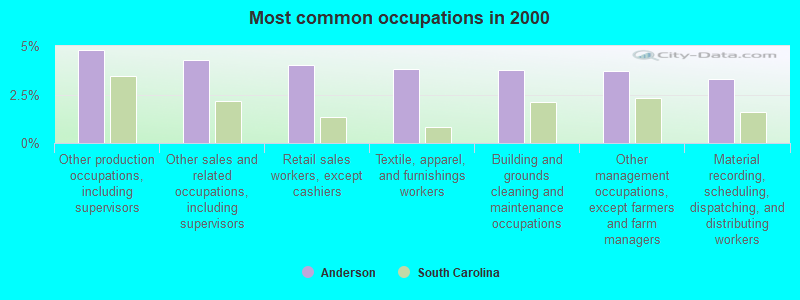
- Other production occupations, including supervisors (4.8%)
- Other sales and related occupations, including supervisors (4.3%)
- Retail sales workers, except cashiers (4.0%)
- Textile, apparel, and furnishings workers (3.8%)
- Building and grounds cleaning and maintenance occupations (3.7%)
- Other management occupations, except farmers and farm managers (3.7%)
- Material recording, scheduling, dispatching, and distributing workers (3.3%)
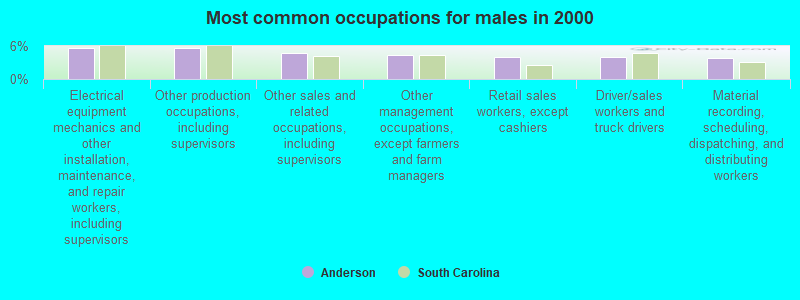
- Electrical equipment mechanics and other installation, maintenance, and repair workers, including supervisors (5.6%)
- Other production occupations, including supervisors (5.6%)
- Other sales and related occupations, including supervisors (4.7%)
- Other management occupations, except farmers and farm managers (4.3%)
- Retail sales workers, except cashiers (4.0%)
- Driver/sales workers and truck drivers (4.0%)
- Material recording, scheduling, dispatching, and distributing workers (3.8%)
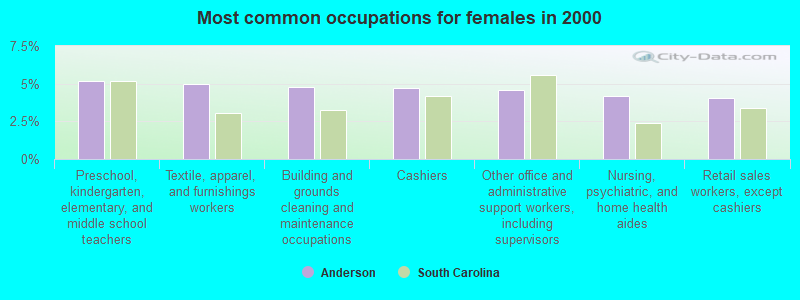
- Preschool, kindergarten, elementary, and middle school teachers (5.2%)
- Textile, apparel, and furnishings workers (5.0%)
- Building and grounds cleaning and maintenance occupations (4.8%)
- Cashiers (4.7%)
- Other office and administrative support workers, including supervisors (4.6%)
- Nursing, psychiatric, and home health aides (4.2%)
- Retail sales workers, except cashiers (4.0%)
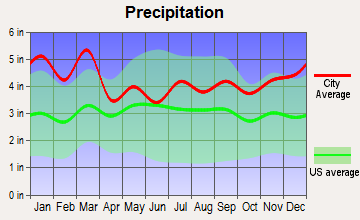
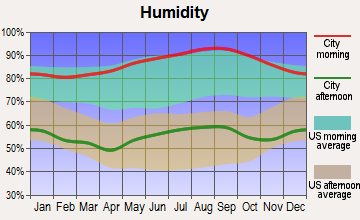
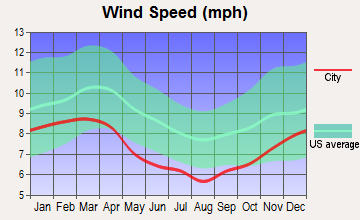
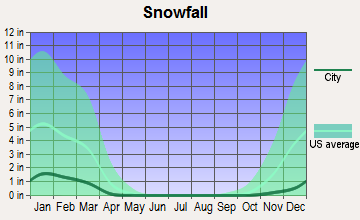
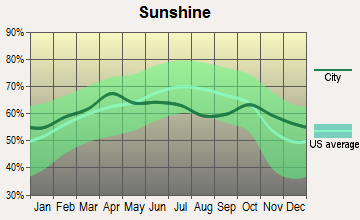
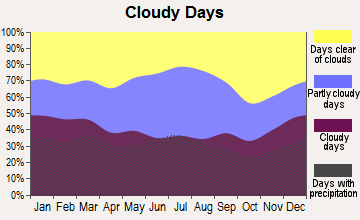
Average climate in Anderson, South Carolina
Based on data reported by over 4,000 weather stations

|
|


(lower is better)
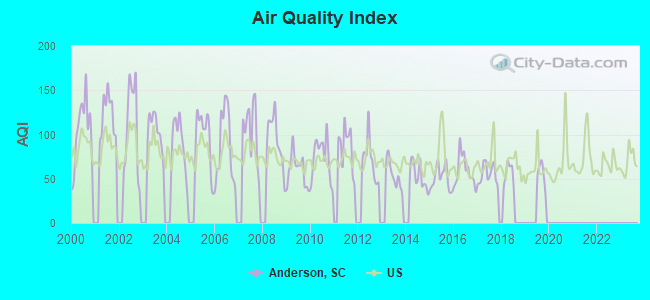
Air Quality Index (AQI) level in 2017 was 54.8. This is better than average.
| City: | 54.8 |
| U.S.: | 72.6 |
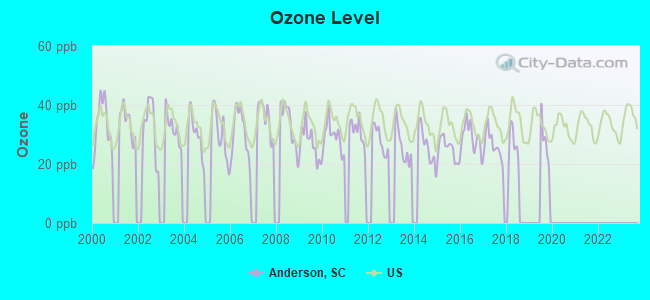
Ozone [ppb] level in 2017 was 26.1. This is better than average. Closest monitor was 14.5 miles away from the city center.
| City: | 26.1 |
| U.S.: | 33.3 |
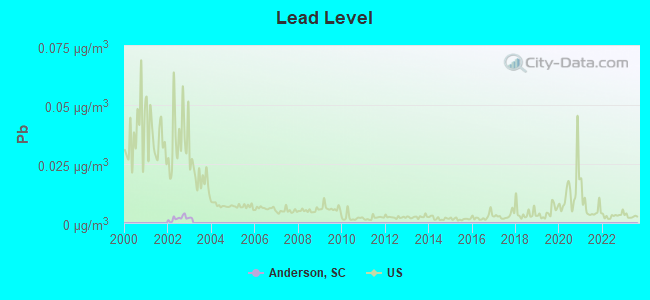
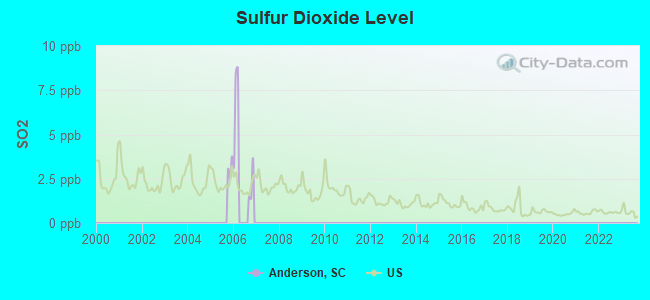
Lead (Pb) [µg/m3] level in 2002 was 0.00197. This is significantly better than average. Closest monitor was 0.8 miles away from the city center.
| City: | 0.00197 |
| U.S.: | 0.00931 |
Tornado activity:
Anderson-area historical tornado activity is near South Carolina state average. It is 16% greater than the overall U.S. average.
On 3/31/1973, a category F4 (max. wind speeds 207-260 mph) tornado 28.4 miles away from the Anderson city center killed 7 people and injured 30 people and caused between $500,000 and $5,000,000 in damages.
On 4/8/1974, a category F3 (max. wind speeds 158-206 mph) tornado 8.7 miles away from the city center caused between $500 and $5000 in damages.
Earthquake activity:
Anderson-area historical earthquake activity is significantly above South Carolina state average. It is 17% greater than the overall U.S. average.On 8/2/1974 at 08:52:09, a magnitude 4.9 (4.3 MB, 4.9 LG, Class: Light, Intensity: IV - V) earthquake occurred 45.4 miles away from the city center
On 8/9/2020 at 12:07:37, a magnitude 5.1 (5.1 MW, Depth: 4.7 mi, Class: Moderate, Intensity: VI - VII) earthquake occurred 161.5 miles away from Anderson center
On 11/30/1973 at 07:48:41, a magnitude 4.7 (4.7 MB, 4.6 ML) earthquake occurred 115.8 miles away from the city center
On 4/29/2003 at 08:59:39, a magnitude 4.9 (4.4 MB, 4.6 MW, 4.9 LG) earthquake occurred 169.9 miles away from the city center
On 8/23/2011 at 17:51:04, a magnitude 5.8 (5.8 MW, Depth: 3.7 mi) earthquake occurred 352.5 miles away from Anderson center
On 7/27/1980 at 18:52:21, a magnitude 5.2 (5.1 MB, 4.7 MS, 5.0 UK, 5.2 UK) earthquake occurred 265.2 miles away from the city center
Magnitude types: regional Lg-wave magnitude (LG), body-wave magnitude (MB), local magnitude (ML), surface-wave magnitude (MS), moment magnitude (MW)
Natural disasters:
The number of natural disasters in Anderson County (10) is smaller than the US average (15).Major Disasters (Presidential) Declared: 2
Emergencies Declared: 5
Causes of natural disasters: Floods: 3, Hurricanes: 3, Storms: 3, Drought: 1, Ice Storm: 1, Tornado: 1, Wind: 1, Winter Storm: 1, Other: 1 (Note: some incidents may be assigned to more than one category).

Main business address for: HAMPSHIRE GROUP LTD (KNIT OUTERWEAR MILLS).
Hospitals in Anderson:
- ANMED HEALTH (Voluntary non-profit - Private, provides emergency services, 800 N FANT ST)
- ANMED HEALTHSOUTH REHABILITATION HOSPITAL (provides emergency services, 1 SPRINGBACK WAY)
- HOSPICE OF THE UPSTATE, INC (1835 ROGERS ROAD)
- PATRICK B HARRIS PSYCHIATRIC HOSPITAL (130 HIGHWAY 252)
Nursing Homes in Anderson:
- ANDERSON AMC SUBACUTE UNIT (800 NORTH FANT STREET)
- ANDERSON HEALTH CARE CENTER ICF (1501 E GREENVILLE STREET)
- ANDERSON PLACE (311 SIMPSON RD)
- ANMED HEALTHSOUTH (1 SPRING BACK WAY)
- ELLENBURG NURSING CENTER, INC (611 EAST HAMPTON STREET)
- FELLOWSHIP HEALTH AND REHAB OF ANDERSON, LLC (208 JAMES STREET)
- NHC HEALTHCARE - ANDERSON (1501 EAST GREENVILLE STREET)
- RICHARD M CAMPBELL VETERANS NURSING HOME (4605 BELTON HIGHWAY)
Dialysis Facilities in Anderson:
Home Health Centers in Anderson:
Airports and heliports located in Anderson:
- Anderson Regional Airport (AND) (Runways: 4, Itinerant Ops: 17,000, Local Ops: 12,500, Military Ops: 300)
- Anmed Downtown Heliport (08SC)
Colleges/Universities in Anderson:
Other colleges/universities with over 2000 students near Anderson:
- Tri-County Technical College (about 13 miles; Pendleton, SC; Full-time enrollment: 5,174)
- Clemson University (about 16 miles; Clemson, SC; FT enrollment: 20,131)
- Greenville Technical College (about 27 miles; Greenville, SC; FT enrollment: 9,859)
- Bob Jones University (about 30 miles; Greenville, SC; FT enrollment: 3,308)
- Furman University (about 31 miles; Greenville, SC; FT enrollment: 2,988)
- Lander University (about 36 miles; Greenwood, SC; FT enrollment: 2,870)
- Piedmont Technical College (about 37 miles; Greenwood, SC; FT enrollment: 4,831)
Public high schools in Anderson:
- T. L. HANNA HIGH AN INTERNATIONAL BACCALAUREATE WO (Location: 2600 HIGHWAY 81 NORTH, Grades: 9-12)
- WESTSIDE HIGH AN EARLY COLLEGE ACADEMY (Location: 806 PEARMAN DAIRY ROAD, Grades: 9-12)
- ANDERSON FIVE CAREER CAMPUS (Location: 1225 SOUTH MCDUFFIE STREET, Grades: 9-12)
- ANDERSON FIVE CHARTER SCHOOL (Location: 1225 SOUTH MCDUFFIE STREET, Grades: 9-12, Charter school)
Private high schools in Anderson:
Biggest public elementary/middle schools in Anderson:
- MIDWAY ELEMENTARY SCHOOL OF SCIENCE AND ENGINEERIN (Students: 924, Location: 1221 HARRIETT CIRCLE, Grades: KG-5)
- CALHOUN ACADEMY OF THE ARTS (Students: 719, Location: 1520 EAST CALHOUN STREET, Grades: KG-5)
- FLAT ROCK ELEMENTARY (Students: 408, Location: 115 THOMPSON ROAD, Grades: PK-5)
- VARENNES ACADEMY OF COMMUNICATION AND TECHNOLOGY (Students: 381, Location: 1820 HIGHWAY 29 SOUTH, Grades: 3-5)
- HOMELAND PARK PRIMARY (Students: 292, Location: 3519 WILMONT STREET, Grades: KG-2)
- MCLEES ACADEMY OF LEADERSHIP (Students: 125, Location: 4900 DOBBINS BRIDGE ROAD, Grades: KG-5)
- NEVITT FOREST COMMUNITY SCHOOL OF INNOVATION (Location: 1401 BOLT DRIVE, Grades: KG-5)
- WHITEHALL ELEMENTARY A GLOBAL COMMUNICATION SCHOOL (Location: 702 WHITEHALL ROAD, Grades: KG-5)
- LAKESIDE MIDDLE SCHOOL OF INQUIRY AND INNOVATION A (Location: 315 PEARMAN DAIRY ROAD, Grades: 5-8)
- MCCANTS MIDDLE AN INTL BACCALAUREATE WORLD CANDIDA (Location: 2123 MARCHBANKS AVENUE, Grades: 6-8)
Private elementary/middle school in Anderson:
Points of interest:
Notable locations in Anderson: Anderson Country Club (A), Anderson City Hall (B), Anderson County Courthouse (C), Anderson County Library (D), Anderson College Library (E), Anderson County Health Center (F), Rosehill Museum (G), Anderson City Fire Department Station 2 (H), Anderson City Fire Department Station 1 (I). Display/hide their locations on the map
Shopping Centers: Miracle Mile Shopping Center (1), Market Place Shopping Center (2), Hanks Shopping Center (3), Eastpoint Shopping Center (4), Durham Shopping Center (5), Camp Shopping Center (6), Pruitt Shopping Center (7), River Street Plaza Shopping Center (8), Towne Center Shopping Center (9). Display/hide their locations on the map
Churches in Anderson include: Wilson Calvary Baptist Church (A), Young Memorial Associate Reformed Presbyterian Church (B), Zion Church of God Holiness (C), Zion Pentecostal Holiness Church (D), Abiding Savior Lutheran Church (E), Asbury Memorial Baptist Church (F), Assembly Apostolic Church (G), Mount Carmel Church (H), Forest Hill Baptist Church (I). Display/hide their locations on the map
Cemeteries: Le Boon Cemetery (1), Orrville Cemetery (2), Silver Brook Cemetery (3), Concord Baptist Cemetery (4), Byrum-LeBoon Family Cemetery (5), Anderson First Presbyterian Cemetery (6), Westview Cemetery (7). Display/hide their locations on the map
Reservoirs: Lake Huntington (A), Bailey Creek Reservoir (B). Display/hide their locations on the map
Creeks: Whitner Creek (A), Dye Creek (B), Cox Creek (C). Display/hide their locations on the map
Parks in Anderson include: Cater Lake Park (1), Abney Mills Park (2), American Legion Memorial Athletic Field (3), Anderson Downtown Historic District (4), Coleman Municipal Recreation Center (5), Brookview Park (6), Galloway Park (7), Jefferson Avenue Park (8), Jim Rice Park (9). Display/hide their locations on the map
Tourist attractions: Collins Entertainment (Amusement & Theme Parks; 2714 South Main Street), Best Products USA (Amusement & Theme Parks; By Passage 28), AAA Amusement CO (Amusement & Theme Parks; 212 Highway 28 Bypass), A & A Amusement (Amusement & Theme Parks; 303 McGee Road), C & L Amusement CO (Amusement & Theme Parks; 150 Quinn Street), Outer Limits (Amusement & Theme Parks; 3101 North Main Street), Sharkies Entertainment (By Passage 28), Dynamic Enterprises (Arcades & Amusements; 3015 South Main Street), Impson Barbara (Arcades & Amusements; 701 South Main Street).
Hotels: Hilton Garden Inn (100 Miracle Mile Drive), Evergreen Spa & Hair Salon (1109 South Main Street), Mainstay Suites Anderson (151 Civic Center Boulevard), Holiday Inn Express Hotel & Suites (107 Interstate Boulevard), Carolina Inn (700 North Murray Avenue), Jameson Inn Anderson (Sj) (128 Interstate Boulevard), Anderson-Days Inn Clemson (1007 Smiths Mill Road), Holiday Inn Express Anderson (103 Anderson Business Park), Cooper Motel (1801 Highway 29 North).
Courts: Anderson County - Family Court Records- Courts- Clerk Of Court- Family Court Divi (100 South Main Street), Anderson County - Clerk of Court- Court Division (100 South Main Street), Anderson County - Courts- Circuit Court- Master In Equity (100 South Main Street).
Birthplace of: Jim Rice - Baseball player and coach, Ben Taylor (Negro Leagues) - Baseball player, George Webster (American football) - College football player, Jessica Stroup - Actor, Jonathan Byrd (golfer) - Professional golfer, Larry Nance - Basketball player, Lu Parker - Reporters and correspondent, Ojetta Rogeriee Thompson - Judge, Shaun Ellis - 2005 NFL player (New York Jets, born: Jun 24, 1977), Tony Young (martial artist) - Karateka.
Drinking water stations with addresses in Anderson and their reported violations in the past:
BROADWAY W&S DISTRICT (0420008) (Population served: 8,503, Purch surface water):Past monitoring violations:HOMELAND PARK W/D (0420001) (Population served: 7,153, Purch surface water):
- One routine major monitoring violation
Past health violations:ANDERSON REGIONAL WTR SYS (0420011) (Population served: 25, Surface water):
- MCL, Monthly (TCR) - In AUG-2006, Contaminant: Coliform. Follow-up actions: St Public Notif requested (SEP-19-2006), St Violation/Reminder Notice (SEP-19-2006), St Compliance achieved (JUL-23-2007)
Past monitoring violations:
- Monitoring and Reporting (DBP) - Between JUL-2008 and SEP-2008, Contaminant: CARBON, TOTAL. Follow-up actions: St Compliance achieved (OCT-01-2008), St Public Notif requested (OCT-22-2008), St Violation/Reminder Notice (OCT-22-2008), St Public Notif received (JUL-01-2009)
Drinking water stations with addresses in Anderson that have no violations reported:
- ELECTRIC CITY UTILITIES (0410012) (Population served: 38,594, Primary Water Source Type: Purch surface water)
| This city: | 2.2 people |
| South Carolina: | 2.5 people |
| This city: | 58.2% |
| Whole state: | 67.5% |
| This city: | 5.9% |
| Whole state: | 6.0% |
Likely homosexual households (counted as self-reported same-sex unmarried-partner households)
- Lesbian couples: 0.3% of all households
- Gay men: 0.2% of all households
People in group quarters in Anderson in 2010:
- 917 people in college/university student housing
- 577 people in nursing facilities/skilled-nursing facilities
- 131 people in local jails and other municipal confinement facilities
- 59 people in other noninstitutional facilities
- 34 people in emergency and transitional shelters (with sleeping facilities) for people experiencing homelessness
- 21 people in group homes intended for adults
- 8 people in group homes for juveniles (non-correctional)
- 4 people in residential treatment centers for adults
People in group quarters in Anderson in 2000:
- 716 people in nursing homes
- 600 people in college dormitories (includes college quarters off campus)
- 279 people in local jails and other confinement facilities (including police lockups)
- 191 people in other noninstitutional group quarters
- 40 people in homes for the mentally retarded
- 27 people in other group homes
- 14 people in other nonhousehold living situations
- 11 people in hospitals/wards and hospices for chronically ill
- 11 people in hospices or homes for chronically ill
- 11 people in homes or halfway houses for drug/alcohol abuse
Banks with most branches in Anderson (2011 data):
- The Peoples Bank: Downtown Branch, Highway 24 Branch, Greenville Street Branch, Clemson Boulevard Branch, Homeland Park Branch. Info updated 2006/11/03: Bank assets: $252.7 mil, Deposits: $205.5 mil, headquarters in Iva, SC, positive income, Commercial Lending Specialization, 6 total offices, Holding Company: Peoples Financial Group, Inc.
- SunTrust Bank: Highway 24 Mm Branch 289, Southbank Branch, Northtowne Branch 288, Perpetual Square Branch 291, Watson Village Branch 296. Info updated 2010/05/27: Bank assets: $171,291.7 mil, Deposits: $129,833.2 mil, headquarters in Atlanta, GA, positive income, Commercial Lending Specialization, 1716 total offices, Holding Company: Suntrust Banks, Inc.
- Wells Fargo Bank, National Association: Anderson Main, North Hill, Greenville Street, Westside. Info updated 2011/04/05: Bank assets: $1,161,490.0 mil, Deposits: $905,653.0 mil, headquarters in Sioux Falls, SD, positive income, 6395 total offices, Holding Company: Wells Fargo & Company
- TD Bank, National Association: Anderson North Branch, Anderson South Branch, Anderson Hwy 81 Branch, Anderson Main Branch. Info updated 2010/10/04: Bank assets: $188,912.6 mil, Deposits: $153,149.8 mil, headquarters in Wilmington, DE, positive income, 1314 total offices, Holding Company: Toronto-Dominion Bank, The
- First Citizens Bank and Trust Company, Inc.: East Greenville Street Branch, Anderson Main Branch, Northpointe Branch. Info updated 2011/08/24: Bank assets: $8,104.0 mil, Deposits: $6,880.8 mil, headquarters in Columbia, SC, positive income, 197 total offices, Holding Company: First Citizens Bancorporation, Inc.
- Bank of Anderson, National Association: Bank Of Anderson, National Association, Bank Of Anderson Courier Service Mob, Pearman Dairy Branch. Info updated 2006/11/03: Bank assets: $145.2 mil, Deposits: $129.3 mil, local headquarters, positive income, 3 total offices, Holding Company: Peoples Bancorporation, Inc.
- Regions Bank: Anderson Main Office at 304 Main Street, branch established on 1984/06/29; Clemson Boulevard Branch at 3404 Clemson Blvd, branch established on 1985/09/21. Info updated 2011/02/24: Bank assets: $123,368.2 mil, Deposits: $98,301.3 mil, headquarters in Birmingham, AL, positive income, Commercial Lending Specialization, 1778 total offices, Holding Company: Regions Financial Corporation
- Woodforest National Bank: Anderson Hwy 28 Branch at 651 Highway 28 Bypass, branch established on 2008/06/14; Anderson Branch at 3812 Liberty Highway, branch established on 2008/06/14. Info updated 2011/05/10: Bank assets: $3,488.9 mil, Deposits: $3,097.6 mil, headquarters in Houston, TX, positive income, Commercial Lending Specialization, 766 total offices, Holding Company: Woodforest Financial Group Employee Stock Ownership Plan (With 401(K) Provisions)
- Park Sterling Bank: Anderson Branch at 1722 North Main Street, branch established on 2002/07/16; Highway 81 Branch at 2123 Highway 81 N, branch established on 2006/03/14. Info updated 2011/12/19: Bank assets: $1,051.7 mil, Deposits: $846.3 mil, headquarters in Charlotte, NC, negative income in the last year, Commercial Lending Specialization, 26 total offices, Holding Company: Park Sterling Corporation
- 8 other banks with 11 local branches
For population 15 years and over in Anderson:
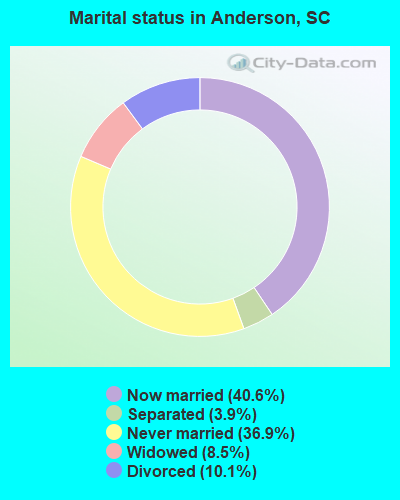
- Never married: 36.9%
- Now married: 40.6%
- Separated: 3.9%
- Widowed: 8.5%
- Divorced: 10.1%
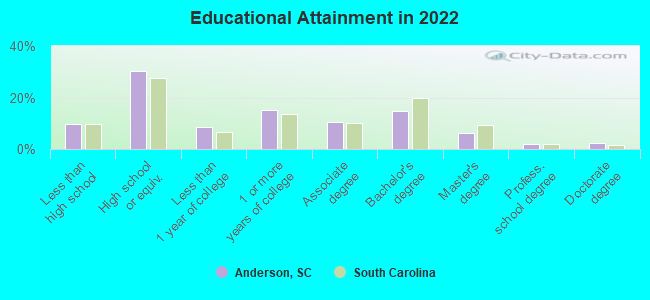
For population 25 years and over in Anderson:
- High school or higher: 87.6%
- Bachelor's degree or higher: 25.7%
- Graduate or professional degree: 9.8%
- Unemployed: 7.9%
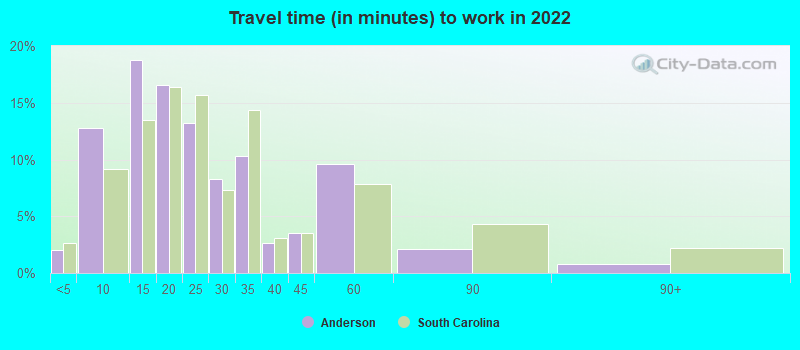
- Mean travel time to work (commute): 20.2 minutes
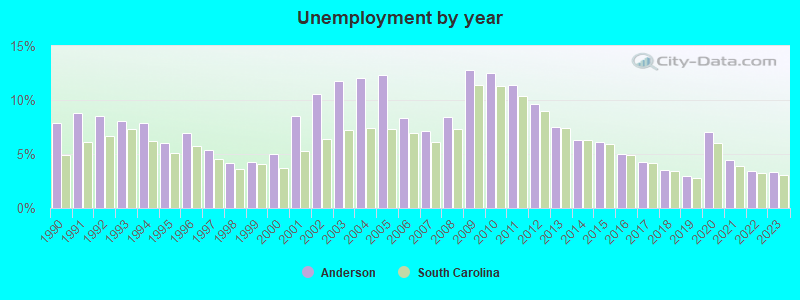
| Here: | 11.2 |
| South Carolina average: | 11.1 |
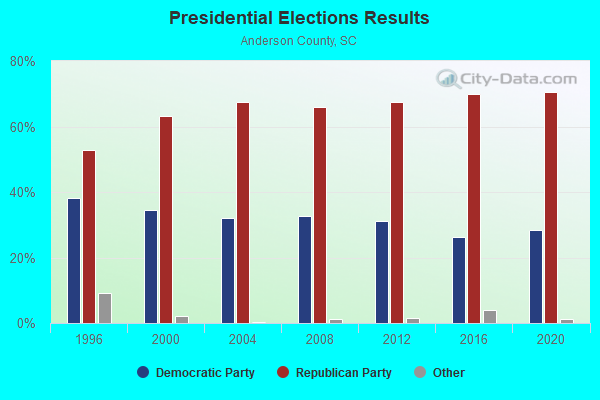
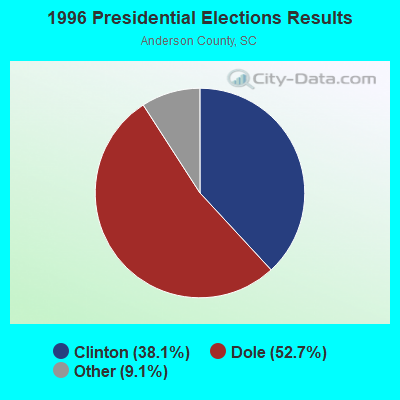
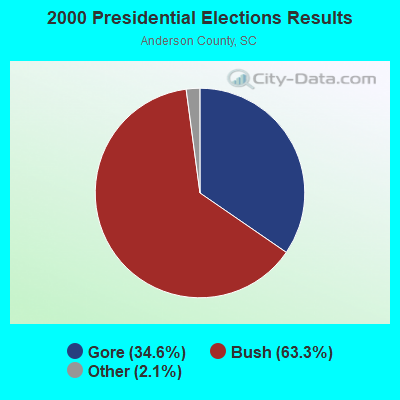

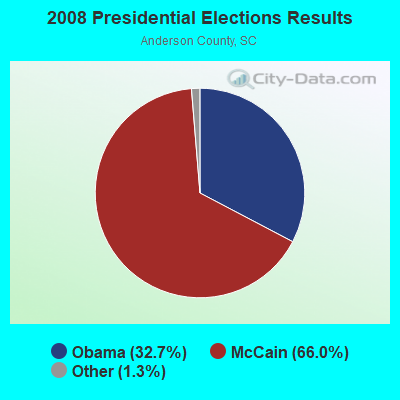
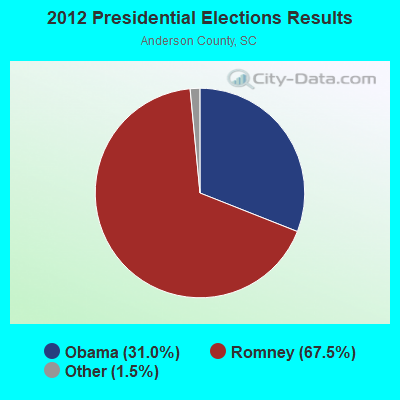
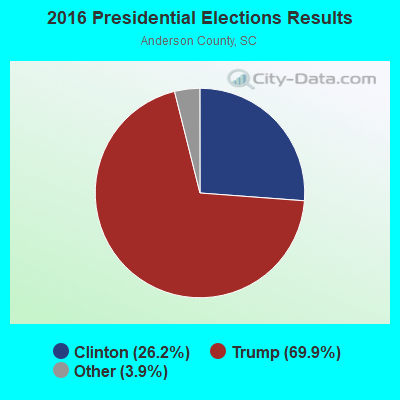

Graphs represent county-level data. Detailed 2008 Election Results
Religion statistics for Anderson, SC (based on Anderson County data)
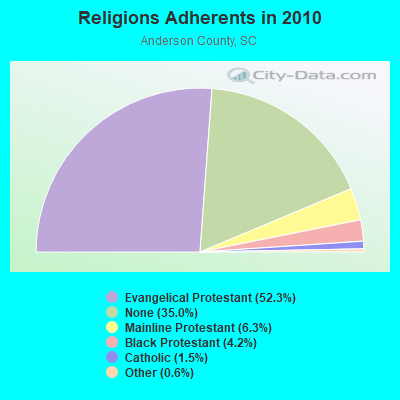
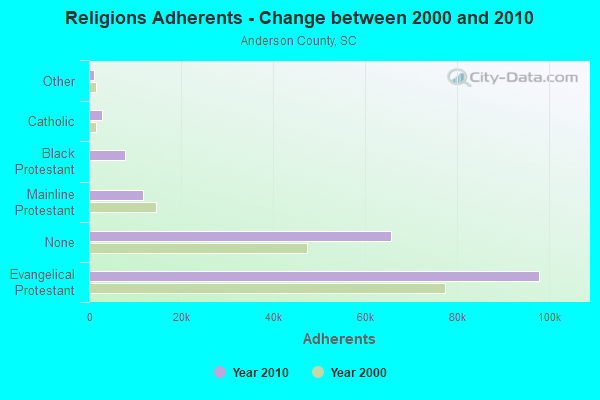
| Religion | Adherents | Congregations |
|---|---|---|
| Evangelical Protestant | 97,855 | 240 |
| Mainline Protestant | 11,775 | 59 |
| Black Protestant | 7,884 | 30 |
| Catholic | 2,851 | 2 |
| Other | 1,146 | 6 |
| Orthodox | 50 | 1 |
| None | 65,565 | - |
Food Environment Statistics:
| Anderson County: | 1.89 / 10,000 pop. |
| South Carolina: | 1.99 / 10,000 pop. |
| This county: | 0.17 / 10,000 pop. |
| State: | 0.15 / 10,000 pop. |
| Anderson County: | 0.72 / 10,000 pop. |
| South Carolina: | 0.85 / 10,000 pop. |
| Anderson County: | 6.45 / 10,000 pop. |
| State: | 5.38 / 10,000 pop. |
| Here: | 6.78 / 10,000 pop. |
| State: | 7.75 / 10,000 pop. |
| This county: | 11.8% |
| South Carolina: | 10.6% |
| Anderson County: | 27.7% |
| South Carolina: | 29.4% |
| This county: | 12.9% |
| State: | 13.4% |
Health and Nutrition:
| Anderson: | 51.2% |
| State: | 49.2% |
| Anderson: | 48.4% |
| South Carolina: | 46.2% |
| Anderson: | 28.9 |
| South Carolina: | 29.0 |
| Anderson: | 19.3% |
| South Carolina: | 20.4% |
| This city: | 11.7% |
| South Carolina: | 11.0% |
| This city: | 6.9 |
| State: | 6.8 |
| This city: | 34.2% |
| State: | 34.4% |
| This city: | 56.3% |
| State: | 55.6% |
| This city: | 79.5% |
| South Carolina: | 79.9% |
More about Health and Nutrition of Anderson, SC Residents
| Local government employment and payroll (March 2022) | |||||
| Function | Full-time employees | Monthly full-time payroll | Average yearly full-time wage | Part-time employees | Monthly part-time payroll |
|---|---|---|---|---|---|
| Police Protection - Officers | 88 | $371,227 | $50,622 | 0 | $0 |
| Firefighters | 62 | $226,964 | $43,929 | 0 | $0 |
| Solid Waste Management | 51 | $138,667 | $32,628 | 0 | $0 |
| Water Supply | 30 | $96,984 | $38,794 | 0 | $0 |
| Other and Unallocable | 28 | $95,682 | $41,007 | 0 | $0 |
| Sewerage | 28 | $103,004 | $44,145 | 0 | $0 |
| Correction | 27 | $97,265 | $43,229 | 0 | $0 |
| Other Government Administration | 25 | $95,870 | $46,018 | 1 | $620 |
| Parks and Recreation | 23 | $70,401 | $36,731 | 42 | $22,925 |
| Financial Administration | 14 | $67,857 | $58,163 | 1 | $3,122 |
| Judicial and Legal | 11 | $42,209 | $46,046 | 4 | $5,204 |
| Police - Other | 8 | $28,022 | $42,033 | 10 | $9,240 |
| Transit | 8 | $24,134 | $36,201 | 6 | $9,229 |
| Streets and Highways | 7 | $28,952 | $49,632 | 0 | $0 |
| Natural Resources | 3 | $10,936 | $43,744 | 0 | $0 |
| Housing and Community Development (Local) | 2 | $6,464 | $38,784 | 3 | $5,443 |
| Fire - Other | 1 | $3,000 | $36,000 | 0 | $0 |
| Totals for Government | 416 | $1,507,636 | $43,490 | 67 | $55,782 |
Anderson government finances - Expenditure in 2021 (per resident):
- Construction - Sewerage: $473,000 ($15.89)
General Public Buildings: $85,000 ($2.86)
- Current Operations - Police Protection: $8,477,000 ($284.74)
Water Utilities: $6,253,000 ($210.04)
Sewerage: $5,023,000 ($168.72)
General - Other: $4,922,000 ($165.33)
Local Fire Protection: $4,349,000 ($146.08)
Parks and Recreation: $3,081,000 ($103.49)
Solid Waste Management: $3,058,000 ($102.72)
Correctional Institutions: $2,714,000 ($91.16)
Central Staff Services: $1,820,000 ($61.13)
Transit Utilities: $1,158,000 ($38.90)
Housing and Community Development: $1,128,000 ($37.89)
Regular Highways: $979,000 ($32.88)
Judicial and Legal Services: $819,000 ($27.51)
Financial Administration: $730,000 ($24.52)
General Public Buildings: $519,000 ($17.43)
Miscellaneous Commercial Activities - Other: $449,000 ($15.08)
Protective Inspection and Regulation - Other: $314,000 ($10.55)
Hospitals: $170,000 ($5.71)
- General - Interest on Debt: $2,047,000 ($68.76)
- Other Capital Outlay - General Public Building: $1,041,000 ($34.97)
Police Protection: $270,000 ($9.07)
Local Fire Protection: $75,000 ($2.52)
Correctional Institutions: $50,000 ($1.68)
General - Other: $30,000 ($1.01)
- Total Salaries and Wages: $20,495,000 ($688.42)
- Water Utilities - Interest on Debt: $683,000 ($22.94)
Anderson government finances - Revenue in 2021 (per resident):
- Charges - Sewerage: $13,577,000 ($456.05)
Other: $1,801,000 ($60.50)
Solid Waste Management: $400,000 ($13.44)
Miscellaneous Commercial Activities: $372,000 ($12.50)
Parks and Recreation: $177,000 ($5.95)
- Federal Intergovernmental - Transit Utilities: $2,103,000 ($70.64)
Housing and Community Development: $1,427,000 ($47.93)
Other: $792,000 ($26.60)
- Local Intergovernmental - General Local Government Support: $685,000 ($23.01)
- Miscellaneous - General Revenue - Other: $5,984,000 ($201.00)
Fines and Forfeits: $226,000 ($7.59)
Interest Earnings: $187,000 ($6.28)
- Revenue - Water Utilities: $9,043,000 ($303.75)
Transit Utilities: $171,000 ($5.74)
- State Intergovernmental - Other: $313,000 ($10.51)
Transit Utilities: $113,000 ($3.80)
Highways: $85,000 ($2.86)
- Tax - Property: $14,616,000 ($490.95)
Other License: $321,000 ($10.78)
Alcoholic Beverage License: $43,000 ($1.44)
Occupation and Business License - Other: $10,000 ($0.34)
Anderson government finances - Debt in 2021 (per resident):
- Long Term Debt - Beginning Outstanding - Unspecified Public Purpose: $98,868,000 ($3320.95)
Outstanding Unspecified Public Purpose: $97,138,000 ($3262.84)
Retired Unspecified Public Purpose: $1,729,000 ($58.08)
Anderson government finances - Cash and Securities in 2021 (per resident):
- Other Funds - Cash and Securities: $33,340,000 ($1119.88)
| Businesses in Anderson, SC | ||||
| Name | Count | Name | Count | |
|---|---|---|---|---|
| ALDI | 1 | Little Caesars Pizza | 1 | |
| AT&T | 2 | Long John Silver's | 2 | |
| Academy Sports + Outdoors | 1 | Lowe's | 1 | |
| Ace Hardware | 3 | Marriott | 1 | |
| Advance Auto Parts | 3 | MasterBrand Cabinets | 3 | |
| Aeropostale | 1 | McDonald's | 5 | |
| American Eagle Outfitters | 1 | Microtel | 1 | |
| Applebee's | 1 | New Balance | 1 | |
| Arby's | 5 | New York & Co | 1 | |
| Ashley Furniture | 1 | Nike | 8 | |
| AutoZone | 2 | Nissan | 1 | |
| Bath & Body Works | 1 | Office Depot | 1 | |
| Bed Bath & Beyond | 1 | Old Navy | 1 | |
| Blockbuster | 1 | Olive Garden | 1 | |
| Burger King | 4 | Outback | 1 | |
| CVS | 4 | Outback Steakhouse | 1 | |
| Catherines | 1 | Pac Sun | 1 | |
| Chevrolet | 1 | Panera Bread | 1 | |
| Chick-Fil-A | 3 | Payless | 1 | |
| Church's Chicken | 1 | Penske | 2 | |
| Comfort Suites | 1 | PetSmart | 1 | |
| Cracker Barrel | 1 | Pier 1 Imports | 1 | |
| Curves | 2 | Pizza Hut | 2 | |
| DHL | 1 | Publix Super Markets | 2 | |
| Days Inn | 1 | Quality | 1 | |
| Dennys | 1 | Quiznos | 1 | |
| Domino's Pizza | 1 | RadioShack | 2 | |
| Dunkin Donuts | 2 | Red Lobster | 1 | |
| Express | 1 | Rite Aid | 2 | |
| FedEx | 9 | Rue21 | 1 | |
| Firestone Complete Auto Care | 1 | Ryan's Grill | 2 | |
| Foot Locker | 1 | Ryder Rental & Truck Leasing | 1 | |
| Ford | 1 | SAS Shoes | 1 | |
| GNC | 2 | SONIC Drive-In | 3 | |
| GameStop | 3 | Sam's Club | 1 | |
| Goodwill | 1 | Sears | 2 | |
| H&R Block | 4 | Shoe Carnival | 1 | |
| Hardee's | 3 | Staples | 1 | |
| Hilton | 2 | Subway | 8 | |
| Hobby Lobby | 1 | Super 8 | 1 | |
| Holiday Inn | 3 | T-Mobile | 2 | |
| Hollister Co. | 1 | T.J.Maxx | 1 | |
| Home Depot | 1 | Taco Bell | 3 | |
| Honda | 1 | Talbots | 1 | |
| Hot Topic | 1 | Target | 1 | |
| Hyundai | 1 | The Room Place | 1 | |
| IHOP | 1 | Toyota | 1 | |
| JCPenney | 1 | Toys"R"Us | 2 | |
| Jack In The Box | 1 | U-Haul | 8 | |
| Jones New York | 2 | UPS | 18 | |
| Journeys | 1 | Vans | 2 | |
| Justice | 1 | Verizon Wireless | 2 | |
| KFC | 3 | Victoria's Secret | 1 | |
| Kohl's | 1 | Waffle House | 4 | |
| La Quinta | 1 | Walgreens | 5 | |
| La-Z-Boy | 1 | Walmart | 2 | |
| Lane Bryant | 1 | Wendy's | 4 | |
| Lane Furniture | 1 | Wet Seal | 1 | |
| LensCrafters | 2 | YMCA | 4 | |
Strongest AM radio stations in Anderson:
- WRIX (1020 AM; daytime; 10 kW; HOMELAND PARK, SC; Owner: AM 1020 INCORPORATED)
- WANS (1280 AM; 5 kW; ANDERSON, SC; Owner: FM 103 INC.)
- WAIM (1230 AM; 1 kW; ANDERSON, SC; Owner: PALMETTO BROADCASTING COMPANY, INC.)
- WLFJ (660 AM; daytime; 50 kW; GREENVILLE, SC; Owner: CLEAR CHANNEL BROADCASTING LICENSES, INC.)
- WCSZ (1070 AM; 50 kW; SANS SOUCI, SC; Owner: WHYZ RADIO, L.P.)
- WHPB (1390 AM; 1 kW; BELTON, SC; Owner: ROBERT BRYSON)
- WTBI (1540 AM; daytime; 10 kW; PICKENS, SC; Owner: TABERNACLE CHRISTIAN SCHOOLS)
- WBCU (1460 AM; 50 kW; UNION, SC)
- WFGW (1010 AM; 50 kW; BLACK MOUNTAIN, NC; Owner: BLUE RIDGE BROADCASTING CORP.)
- WELP (1360 AM; 5 kW; EASLEY, SC)
- WCNN (680 AM; 50 kW; NORTH ATLANTA, GA; Owner: DICKEY BROADCASTING COMPANY)
- WBAJ (890 AM; daytime; 50 kW; BLYTHEWOOD, SC; Owner: FAMILY FIRST)
- WSB (750 AM; 50 kW; ATLANTA, GA; Owner: CXR HOLDINGS, INC.)
Strongest FM radio stations in Anderson:
- W217AO (91.3 FM; ANDERSON, SC; Owner: BIBLE BROADCASTING NETWORK, INC.)
- WJMZ-FM (107.3 FM; ANDERSON, SC; Owner: CXR HOLDINGS, INC.)
- WROQ (101.1 FM; ANDERSON, SC; Owner: OBC BROADCASTING, INC.)
- WCCP-FM (104.9 FM; CLEMSON, SC; Owner: GOLDEN CORNERS BROADCASTING, INC.)
- WHZT (98.1 FM; SENECA, SC; Owner: CXR HOLDINGS, INC.)
- WSSL-FM (100.5 FM; GRAY COURT, SC; Owner: CAPSTAR TX LIMITED PARTNERSHIP)
- WESC-FM (92.5 FM; GREENVILLE, SC; Owner: CLEAR CHANNEL BROADCASTING LICENSES, INC.)
- WRIX-FM (103.1 FM; HONEA PATH, SC; Owner: FM 103, INC.)
- WMUU-FM (94.5 FM; GREENVILLE, SC; Owner: WMUU, INC.)
- WEPR (90.1 FM; GREENVILLE, SC; Owner: SOUTH CAROLINA EDUCATIONAL TV COMMISSION)
- WEPC (88.5 FM; BELTON, SC; Owner: TOCCOA FALLS COLLEGE)
- WLFJ-FM (89.3 FM; GREENVILLE, SC; Owner: RADIO TRAINING NETWORK, INC.)
- WSPA-FM (98.9 FM; SPARTANBURG, SC; Owner: ENTERCOM GREENVILLE LICENSE, LLC)
- WKSF (99.9 FM; ASHEVILLE, NC; Owner: CAPSTAR TX LIMITED PARTNERSHIP)
- WFBC-FM (93.7 FM; GREENVILLE, SC; Owner: ENTERCOM GREENVILLE LICENSE, LLC)
- WMYI (102.5 FM; HENDERSONVILLE, NC; Owner: CAPSTAR TX LIMITED PARTNERSHIP)
- WBZT-FM (96.7 FM; MAULDIN, SC; Owner: CLEAR CHANNEL BROADCASTING LICENSES, INC.)
- WTPT (93.3 FM; FOREST CITY, NC; Owner: UPSTATE BROADCASTING, LLC)
- WBTS (95.5 FM; ATHENS, GA; Owner: CXR HOLDINGS, INC.)
- W220CD (91.9 FM; ENKA, NC; Owner: CALVARY CHAPEL OF TWIN FALLS, INC.)
TV broadcast stations around Anderson:
- W22AC (Channel 22; HARTWELL & ROYSTON, GA; Owner: GEORGIA PUBLIC TELECOMMUNICATIONS COMMISSION)
- W50CL (Channel 50; ANDERSON, SC; Owner: TRINITY BROADCASTING NETWORK)
- WBSC-TV (Channel 40; ANDERSON, SC; Owner: ANDERSON (WFBC-TV) LICENSEE, INC.)
- W50AB (Channel 50; HIAWASSEE, GA; Owner: GEORGIA PUBLIC TELECOMMUNICATIONS COMMISSION)
- WHNS (Channel 21; ASHEVILLE, NC; Owner: MEREDITH CORPORATION)
- WNEH (Channel 38; GREENWOOD, SC; Owner: SOUTH CAROLINA EDUCATIONAL TV COMMISSION)
- W65DS (Channel 65; HONEA PATH, SC; Owner: CAROLINA CHRISTIAN BROADCASTING, INC.)
- National Bridge Inventory (NBI) Statistics
- 52Number of bridges
- 459ft / 140mTotal length
- $8,360,000Total costs
- 224,325Total average daily traffic
- 10,914Total average daily truck traffic
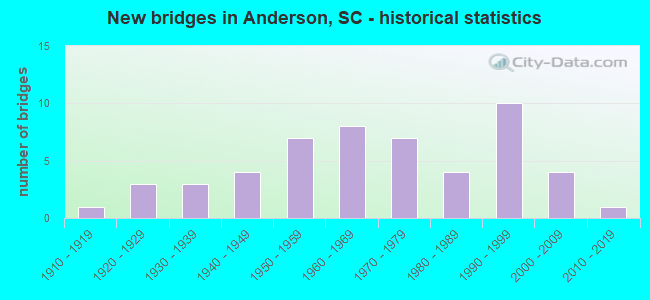
- New bridges - historical statistics
- 11910-1919
- 31920-1929
- 31930-1939
- 41940-1949
- 71950-1959
- 81960-1969
- 71970-1979
- 41980-1989
- 101990-1999
- 42000-2009
- 12010-2019
FCC Registered Antenna Towers: 750 (See the full list of FCC Registered Antenna Towers)
FCC Registered Commercial Land Mobile Towers: 2 (See the full list of FCC Registered Commercial Land Mobile Towers in Anderson, SC)
FCC Registered Private Land Mobile Towers: 4 (See the full list of FCC Registered Private Land Mobile Towers)
FCC Registered Broadcast Land Mobile Towers: 79 (See the full list of FCC Registered Broadcast Land Mobile Towers)
FCC Registered Microwave Towers: 40 (See the full list of FCC Registered Microwave Towers in this town)
FCC Registered Paging Towers: 5 (See the full list of FCC Registered Paging Towers)
FCC Registered Maritime Coast & Aviation Ground Towers: 6 (See the full list of FCC Registered Maritime Coast & Aviation Ground Towers)
FCC Registered Amateur Radio Licenses: 422 (See the full list of FCC Registered Amateur Radio Licenses in Anderson)
FAA Registered Aircraft Manufacturers and Dealers: 3 (See the full list of FAA Registered Manufacturers and Dealers in Anderson)
FAA Registered Aircraft: 76 (See the full list of FAA Registered Aircraft)
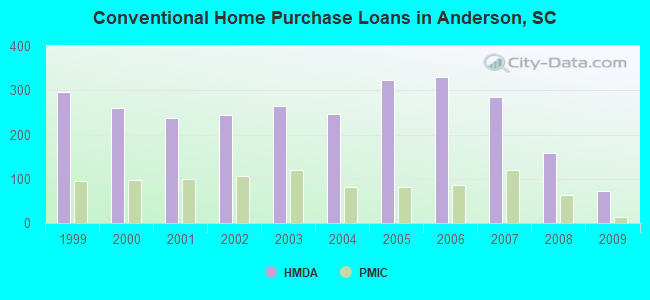
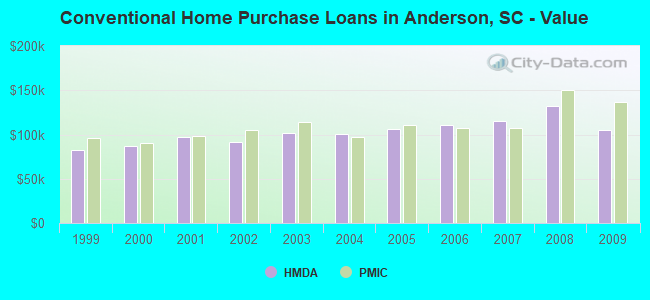
| Home Mortgage Disclosure Act Aggregated Statistics For Year 2009 (Based on 2 full and 9 partial tracts) | ||||||||||||
| A) FHA, FSA/RHS & VA Home Purchase Loans | B) Conventional Home Purchase Loans | C) Refinancings | D) Home Improvement Loans | E) Loans on Dwellings For 5+ Families | F) Non-occupant Loans on < 5 Family Dwellings (A B C & D) | |||||||
|---|---|---|---|---|---|---|---|---|---|---|---|---|
| Number | Average Value | Number | Average Value | Number | Average Value | Number | Average Value | Number | Average Value | Number | Average Value | |
| LOANS ORIGINATED | 64 | $111,004 | 73 | $105,593 | 260 | $139,491 | 12 | $44,739 | 1 | $886,610 | 44 | $77,355 |
| APPLICATIONS APPROVED, NOT ACCEPTED | 5 | $78,986 | 5 | $110,956 | 23 | $145,594 | 1 | $27,320 | 0 | $0 | 2 | $120,640 |
| APPLICATIONS DENIED | 14 | $110,774 | 20 | $132,020 | 102 | $129,869 | 12 | $32,713 | 0 | $0 | 7 | $105,796 |
| APPLICATIONS WITHDRAWN | 9 | $116,480 | 14 | $152,031 | 79 | $141,143 | 3 | $168,450 | 0 | $0 | 7 | $132,246 |
| FILES CLOSED FOR INCOMPLETENESS | 3 | $111,550 | 1 | $11,450 | 17 | $171,459 | 1 | $21,980 | 0 | $0 | 1 | $102,020 |
Detailed mortgage data for all 11 tracts in Anderson, SC
| Private Mortgage Insurance Companies Aggregated Statistics For Year 2009 (Based on 1 full and 7 partial tracts) | ||||
| A) Conventional Home Purchase Loans | B) Refinancings | |||
|---|---|---|---|---|
| Number | Average Value | Number | Average Value | |
| LOANS ORIGINATED | 14 | $136,825 | 14 | $138,832 |
| APPLICATIONS APPROVED, NOT ACCEPTED | 6 | $123,845 | 4 | $109,005 |
| APPLICATIONS DENIED | 2 | $165,160 | 3 | $125,803 |
| APPLICATIONS WITHDRAWN | 1 | $139,170 | 0 | $0 |
| FILES CLOSED FOR INCOMPLETENESS | 1 | $64,130 | 1 | $182,850 |
2002 - 2018 National Fire Incident Reporting System (NFIRS) incidents
- Fire incident types reported to NFIRS in Anderson, SC
- 3,90943.5%Outside Fires
- 3,47538.6%Structure Fires
- 1,39215.5%Mobile Property/Vehicle Fires
- 2202.4%Other
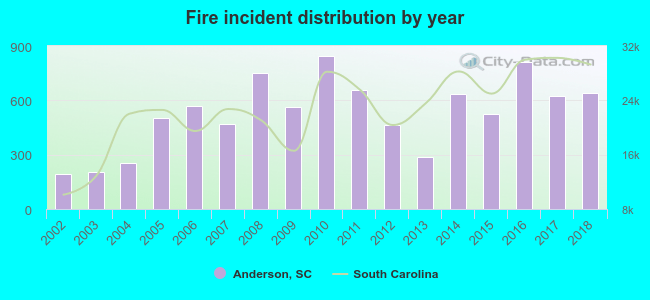 Based on the data from the years 2002 - 2018 the average number of fire incidents per year is 529. The highest number of fires - 846 took place in 2010, and the least - 194 in 2002. The data has an increasing trend.
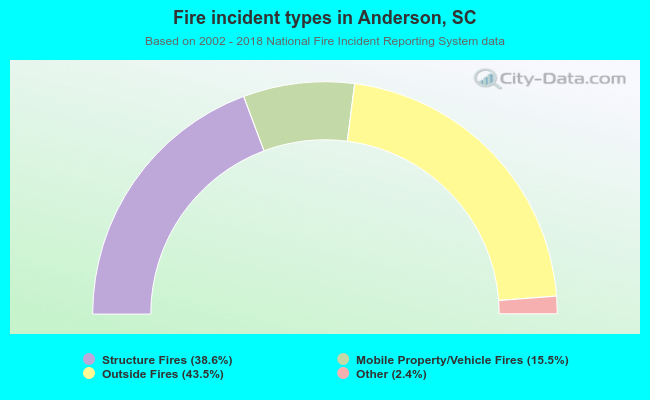 When looking into fire subcategories, the most incidents belonged to: Outside Fires (43.5%), and Structure Fires (38.6%).
Fire-safe hotels and motels in Anderson, South Carolina:
- America's Best Value Inn, 4020 Clemson Blvd, Anderson, South Carolina 29621 , Phone: (864) 224-4464, Fax: (864) 231-9913
- La Quinta Inn, 3430 N Main St, Anderson, South Carolina 29621 , Phone: (864) 225-3721, Fax: (864) 225-7789
- Holiday Inn - Anderson, 3509 Clemson Blvd, Anderson, South Carolina 29621 , Phone: (864) 226-1000, Fax: (864) 261-9246
- Baymont Inn & Suites Anderson Clemson, 128 Interstate Blvd, Anderson, South Carolina 29621 , Phone: (864) 375-9800
- Country Inn & Suites, 116 Interstate Blvd, Anderson, South Carolina 29621 , Phone: (864) 622-2200, Fax: (864) 622-2201
- Home-Towne Suites Anderson, 151 Civic Center Blvd, Anderson, South Carolina 29625 , Phone: (864) 226-1112, Fax: (864) 226-6229
- Hilton Garden Inn Anderson, 115 Destination Blvd, Anderson, South Carolina 29625 , Phone: (864) 964-0100, Fax: (864) 964-0300
- Hampton Inn Anderson, 120 Interstate Blvd, Anderson, South Carolina 29621 , Phone: (864) 375-1999, Fax: (864) 375-1099
- 4 other hotels and motels
| Most common first names in Anderson, SC among deceased individuals | ||
| Name | Count | Lived (average) |
|---|---|---|
| James | 874 | 70.1 years |
| William | 710 | 72.6 years |
| John | 610 | 73.6 years |
| Mary | 552 | 78.0 years |
| Robert | 352 | 72.3 years |
| Charles | 290 | 70.5 years |
| Thomas | 253 | 72.5 years |
| George | 249 | 73.7 years |
| Annie | 237 | 78.9 years |
| Willie | 228 | 76.0 years |
| Most common last names in Anderson, SC among deceased individuals | ||
| Last name | Count | Lived (average) |
|---|---|---|
| Smith | 441 | 74.9 years |
| Brown | 327 | 73.1 years |
| Williams | 260 | 72.7 years |
| Martin | 223 | 74.3 years |
| Johnson | 205 | 71.8 years |
| Jones | 191 | 73.9 years |
| Davis | 171 | 72.9 years |
| Thompson | 167 | 73.0 years |
| Moore | 158 | 72.7 years |
| Hall | 157 | 76.0 years |
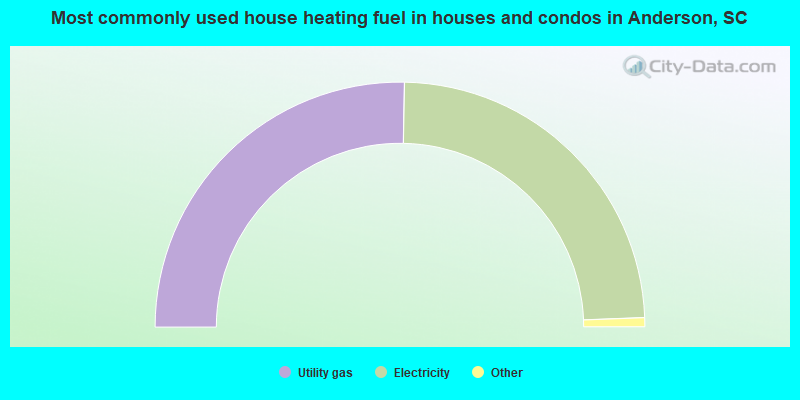
- 50.6%Utility gas
- 48.2%Electricity
- 0.7%Bottled, tank, or LP gas
- 0.2%Wood
- 0.2%Other fuel
- 0.2%No fuel used
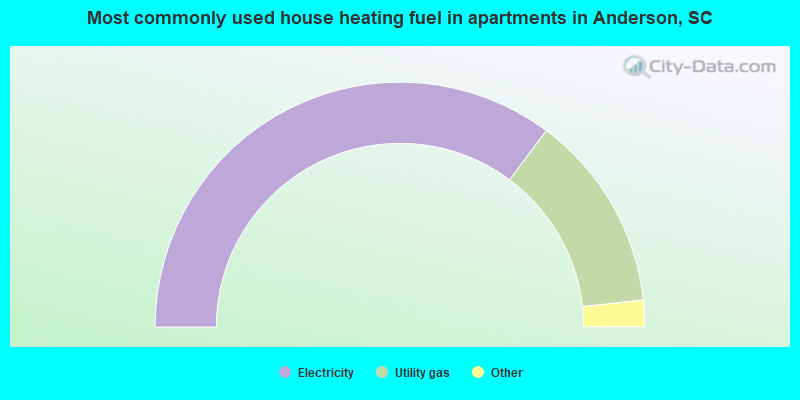
- 70.4%Electricity
- 26.1%Utility gas
- 2.0%Bottled, tank, or LP gas
- 1.1%Other fuel
- 0.3%No fuel used
- 0.2%Fuel oil, kerosene, etc.
Anderson compared to South Carolina state average:
- Median household income below state average.
- Unemployed percentage below state average.
- Renting percentage above state average.
Anderson on our top lists:
- #86 on the list of "Top 100 cities with the largest percentage of females (pop. 5,000+)"
- #97 on the list of "Top 100 least-safe cities (highest city-data.com crime index) (pop. 5,000+)"
- #98 on the list of "Top 101 cities with the highest number of murders per 100,000 residents, excludes tourist destinations and others with a lot of outsiders visiting based on city industries data (population 5,000+)"
- #29 on the list of "Top 101 counties with the lowest ground withdrawal of fresh water for public supply"
- #67 on the list of "Top 101 counties with the smallest number of people without health insurance coverage in 2000 (pop. 50,000+)"
- #72 on the list of "Top 101 counties with the smallest number of children under 18 without health insurance coverage in 2000 (pop. 50,000+)"
- #75 on the list of "Top 101 counties with the most Evangelical Protestant adherents"

|
|
Total of 568 patent applications in 2008-2024.