Altoona, Wisconsin
Submit your own pictures of this city and show them to the world
- OSM Map
- General Map
- Google Map
- MSN Map
Population change since 2000: +36.4%
 |
| Males: 5,200 | |
| Females: 3,939 |
| Median resident age: | 36.9 years |
| Wisconsin median age: | 40.4 years |
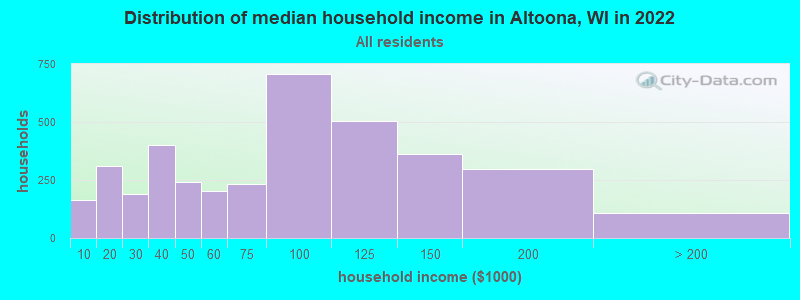
| Altoona: | $77,314 |
| WI: | $70,996 |
Estimated per capita income in 2022: $37,983 (it was $21,236 in 2000)
Altoona city income, earnings, and wages data
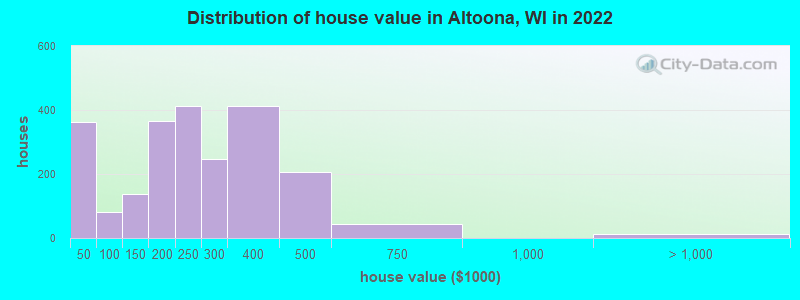
Estimated median house or condo value in 2022: $237,452 (it was $88,600 in 2000)
| Altoona: | $237,452 |
| WI: | $252,800 |
Mean prices in 2022: all housing units: $222,466; detached houses: $253,336; townhouses or other attached units: $251,243; in 2-unit structures: $155,633; mobile homes: $44,230
Median gross rent in 2022: $1,046.
(9.4% for White Non-Hispanic residents, 49.4% for Hispanic or Latino residents, 100.0% for American Indian residents, 23.3% for two or more races residents)
Detailed information about poverty and poor residents in Altoona, WI


Compare current foreclosures near Altoona, WI:
| Photo | Address | Area | Beds / Baths | Price | Details |
|---|---|---|---|---|---|

|
#1
Altoona Ave
Altoona, WI 54720
|
- sq. feet
|
- baths - beds |
show details | |

|
#2
Hamilton Ave
Altoona, WI 54720
|
- sq. feet
|
- baths - beds |
show details | |

|
#3
Valmont Ave
Altoona, WI 54720
|
- sq. feet
|
- baths - beds |
show details | |

|
#4
Keanan Ln, Apt 1d
Altoona, WI 54720
|
- sq. feet
|
- baths - beds |
show details | |

|
#5
Bradwood Ave
Altoona, WI 54720
|
- sq. feet
|
- baths - beds |
show details | |

|
#6
Lake Rd
Altoona, WI 54720
|
- sq. feet
|
- baths - beds |
show details | |

|
#7
Hillside Rd
Altoona, WI 54720
|
- sq. feet
|
- baths - beds |
show details | |

|
#8
Lynn Ave
Altoona, WI 54720
|
- sq. feet
|
- baths - beds |
show details | |

|
#9
Hayden Ave
Altoona, WI 54720
|
- sq. feet
|
- baths - beds |
show details | |

|
#10
103rd St
Chippewa Falls, WI 54729
|
2,338 sq. feet
|
2 baths 3 beds |
show details |
| Photo | Address | Area | Beds / Baths | Price | Details |
|---|---|---|---|---|---|

|
#11
Vienna Ter
Eau Claire, WI 54703
|
1,840 sq. feet
|
2 baths 3 beds |
show details | |

|
#12
Comet Ave
Eau Claire, WI 54703
|
1,560 sq. feet
|
1 baths 3 beds |
show details | |

|
#13
Dodge St
Eau Claire, WI 54701
|
1,788 sq. feet
|
2 baths 4 beds |
show details | |

|
#14
Stein Ct
Eau Claire, WI 54701
|
4,056 sq. feet
|
5 baths 6 beds |
show details | |

|
#15
Moon Ave
Eau Claire, WI 54703
|
1,934 sq. feet
|
2 baths 2 beds |
show details | |

|
#16
N Hastings Way
Eau Claire, WI 54703
|
2,190 sq. feet
|
2 baths 4 beds |
show details | |

|
#17
N Dewey St
Eau Claire, WI 54703
|
1,716 sq. feet
|
2 baths 3 beds |
show details | |

|
#18
Woodridge Dr
Eau Claire, WI 54701
|
1,281 sq. feet
|
1 baths 2 beds |
show details | |

|
#19
Gilbert St
Eau Claire, WI 54703
|
1,692 sq. feet
|
1 baths 4 beds |
show details | |

|
#20
Laurel Ave
Eau Claire, WI 54701
|
1,131 sq. feet
|
1 baths 3 beds |
show details |
| Photo | Address | Area | Beds / Baths | Price | Details |
|---|---|---|---|---|---|

|
#21
Boardwalk St
Eau Claire, WI 54701
|
- sq. feet
|
- baths - beds |
show details | |

|
#22
61st Ave
Chippewa Falls, WI 54729
|
- sq. feet
|
- baths - beds |
show details | |

|
#23
Cassie Ct, Unit 4
Eau Claire, WI 54701
|
- sq. feet
|
- baths - beds |
show details | |

|
#24
Colome St # L
Chippewa Falls, WI 54729
|
- sq. feet
|
- baths - beds |
show details | |

|
#25
Otteson Ln Apt 229
Eau Claire, WI 54701
|
- sq. feet
|
- baths - beds |
show details | |

|
#26
County Road Z
Eau Claire, WI 54701
|
- sq. feet
|
- baths - beds |
show details | |

|
#27
Bay St
Chippewa Falls, WI 54729
|
- sq. feet
|
- baths - beds |
show details | |

|
#28
Michael St
Chippewa Falls, WI 54729
|
- sq. feet
|
- baths - beds |
show details | |

|
#29
Green Park Dr
Eau Claire, WI 54703
|
- sq. feet
|
- baths - beds |
show details | |

|
#30
Hemlock Rd
Eau Claire, WI 54701
|
- sq. feet
|
- baths - beds |
show details |
| Photo | Address | Area | Beds / Baths | Price | Details |
|---|---|---|---|---|---|

|
#31
Pine Cone Ln
Chippewa Falls, WI 54729
|
- sq. feet
|
- baths - beds |
show details | |

|
#32
County Road V
Strum, WI 54770
|
- sq. feet
|
- baths - beds |
show details | |

|
#33
Independence Dr, Apt 9
Elk Mound, WI 54739
|
- sq. feet
|
- baths - beds |
show details | |

|
#34
County Road Ww
Eleva, WI 54738
|
- sq. feet
|
- baths - beds |
show details | |

|
#35
595th Ave
Elk Mound, WI 54739
|
- sq. feet
|
- baths - beds |
show details | |

|
#36
810th St
Mondovi, WI 54755
|
- sq. feet
|
- baths - beds |
show details | |

|
#37
Aspen Heights Dr
Eau Claire, WI 54703
|
- sq. feet
|
- baths - beds |
show details | |

|
#38
46th Ave
Chippewa Falls, WI 54729
|
- sq. feet
|
- baths - beds |
show details | |

|
#39
Eastridge Ctr
Eau Claire, WI 54701
|
- sq. feet
|
- baths - beds |
show details | |

|
#40
E Hamilton Ave # 4045
Eau Claire, WI 54701
|
- sq. feet
|
- baths - beds |
show details |
| Photo | Address | Area | Beds / Baths | Price | Details |
|---|---|---|---|---|---|

|
#41
Clearwater Ridge Dr
Eau Claire, WI 54703
|
- sq. feet
|
- baths - beds |
show details | |

|
#42
La Salle St, Trlr 98
Eau Claire, WI 54703
|
- sq. feet
|
- baths - beds |
show details | |

|
#43
Main St
Eau Claire, WI 54701
|
- sq. feet
|
- baths - beds |
show details | |

|
#44
Coventry Ct
Eau Claire, WI 54701
|
- sq. feet
|
- baths - beds |
show details | |

|
#45
Kappus Dr Apt 1
Eau Claire, WI 54701
|
- sq. feet
|
- baths - beds |
show details | |

|
#46
E Madison St
Eau Claire, WI 54703
|
- sq. feet
|
- baths - beds |
show details | |

|
#47
Fenwick Ave
Eau Claire, WI 54701
|
- sq. feet
|
- baths - beds |
show details | |

|
#48
Amy Ln
Eau Claire, WI 54701
|
- sq. feet
|
- baths - beds |
show details | |

|
#49
Jack Pine Rd
Augusta, WI 54722
|
- sq. feet
|
- baths - beds |
show details | |

|
Check over 1 million property listings on Foreclosure.com!
|
browse all offers | |||


- 7,47586.9%White alone
- 6087.1%Two or more races
- 2793.2%Hispanic
- 2232.6%Asian alone
- 440.5%Black alone
- 130.2%American Indian alone
- 130.2%Other race alone
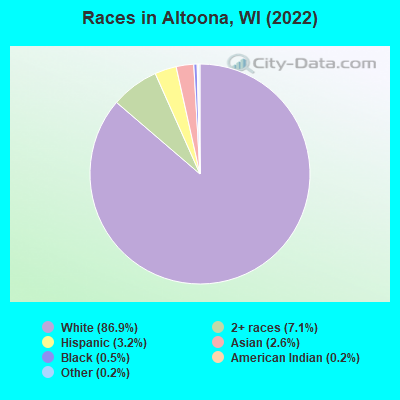
Races in Altoona detailed stats: ancestries, foreign born residents, place of birth
According to our research of Wisconsin and other state lists, there were 22 registered sex offenders living in Altoona, Wisconsin as of May 08, 2024.
The ratio of all residents to sex offenders in Altoona is 328 to 1.
The ratio of registered sex offenders to all residents in this city is near the state average.
Type |
2009 |
2010 |
2011 |
2012 |
2013 |
2014 |
2015 |
2016 |
2017 |
2018 |
2019 |
2020 |
2021 |
2022 |
|---|---|---|---|---|---|---|---|---|---|---|---|---|---|---|
| Murders (per 100,000) | 1 (14.8) | 1 (14.9) | 0 (0.0) | 0 (0.0) | 1 (14.2) | 0 (0.0) | 0 (0.0) | 0 (0.0) | 0 (0.0) | 0 (0.0) | 0 (0.0) | 0 (0.0) | 0 (0.0) | 1 (10.7) |
| Rapes (per 100,000) | 2 (29.6) | 4 (59.6) | 4 (59.4) | 5 (73.5) | 0 (0.0) | 1 (14.0) | 2 (27.5) | 2 (26.9) | 0 (0.0) | 8 (102.2) | 4 (50.4) | 1 (12.5) | 1 (12.2) | 4 (42.9) |
| Robberies (per 100,000) | 0 (0.0) | 2 (29.8) | 2 (29.7) | 2 (29.4) | 1 (14.2) | 0 (0.0) | 0 (0.0) | 0 (0.0) | 1 (13.1) | 1 (12.8) | 0 (0.0) | 2 (25.0) | 0 (0.0) | 0 (0.0) |
| Assaults (per 100,000) | 3 (44.4) | 9 (134.2) | 12 (178.2) | 29 (426.1) | 6 (85.5) | 4 (56.0) | 3 (41.3) | 2 (26.9) | 2 (26.2) | 3 (38.3) | 5 (63.0) | 15 (187.3) | 5 (60.9) | 3 (32.2) |
| Burglaries (per 100,000) | 17 (251.5) | 23 (343.0) | 28 (415.7) | 15 (220.4) | 17 (242.2) | 11 (154.0) | 8 (110.1) | 7 (94.0) | 14 (183.6) | 23 (293.9) | 16 (201.5) | 31 (387.1) | 13 (158.3) | 14 (150.2) |
| Thefts (per 100,000) | 82 (1,213) | 122 (1,819) | 85 (1,262) | 87 (1,278) | 68 (968.9) | 64 (896.2) | 30 (412.8) | 30 (402.9) | 63 (826.3) | 81 (1,035) | 90 (1,134) | 138 (1,723) | 155 (1,888) | 156 (1,674) |
| Auto thefts (per 100,000) | 8 (118.4) | 5 (74.6) | 9 (133.6) | 4 (58.8) | 0 (0.0) | 5 (70.0) | 6 (82.6) | 1 (13.4) | 6 (78.7) | 4 (51.1) | 3 (37.8) | 11 (137.3) | 8 (97.4) | 8 (85.8) |
| Arson (per 100,000) | 0 (0.0) | 0 (0.0) | 0 (0.0) | 0 (0.0) | 0 (0.0) | 0 (0.0) | 0 (0.0) | 0 (0.0) | 0 (0.0) | 0 (0.0) | 0 (0.0) | 0 (0.0) | 0 (0.0) | 0 (0.0) |
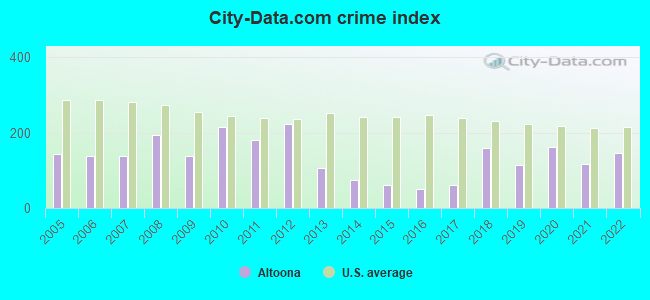
| City-Data.com crime index | 137.7 | 216.1 | 182.3 | 224.1 | 105.6 | 74.6 | 61.1 | 50.6 | 61.4 | 159.3 | 115.4 | 161.9 | 116.3 | 146.6 |
The City-Data.com crime index weighs serious crimes and violent crimes more heavily. Higher means more crime, U.S. average is 246.1. It adjusts for the number of visitors and daily workers commuting into cities.
Crime rate in Altoona detailed stats: murders, rapes, robberies, assaults, burglaries, thefts, arson
Full-time law enforcement employees in 2021, including police officers: 16 (15 officers - 12 male; 3 female).
| Officers per 1,000 residents here: | 1.83 |
| Wisconsin average: | 2.07 |
 Recent articles from our blog. Our writers, many of them Ph.D. graduates or candidates, create easy-to-read articles on a wide variety of topics.

 | Relocating to Eau Claire this summer (61 replies) |
| Moving to Eau Claire July hopefully (2 replies) |
| Hillcrest Estates in Altoona, Wi (2 replies) |
| possibly moving to Chippewa Falls/Eau Claire (9 replies) |
| Moving to Eau Claire with a 3rd Grader (2 replies) |
| Moving from Dubuque, Iowa: Madison or Chicago Suburbs? (9 replies) |
Latest news from Altoona, WI collected exclusively by city-data.com from local newspapers, TV, and radio stations
Ancestries: German (26.2%), Norwegian (17.3%), European (9.6%), American (6.1%), English (3.7%), Scottish (3.5%).
Current Local Time: CST time zone
Incorporated in 1887
Elevation: 890 feet
Land area: 4.09 square miles.
Population density: 2,236 people per square mile (low).
27 residents are foreign born
| This city: | 0.3% |
| Wisconsin: | 5.0% |
Median real estate property taxes paid for housing units with mortgages in 2022: $3,396 (1.3%)
Median real estate property taxes paid for housing units with no mortgage in 2022: $3,055 (1.6%)
Nearest city with pop. 50,000+: Eau Claire, WI  (2.6 miles , pop. 61,704).
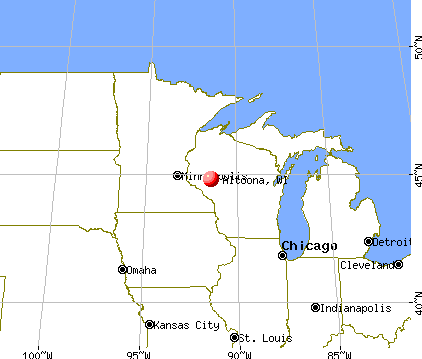
Nearest city with pop. 200,000+: St. Paul, MN (82.6 miles , pop. 287,151).
Nearest city with pop. 1,000,000+: Chicago, IL (279.0 miles , pop. 2,896,016).
Nearest cities:
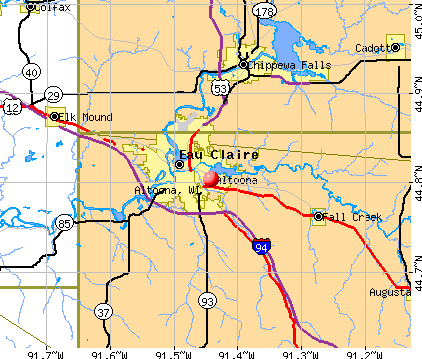
), ), ), ), ), )Latitude: 44.80 N, Longitude: 91.44 W
Daytime population change due to commuting: -519 (-6.0%)
Workers who live and work in this city: 915 (19.5%)
Area code commonly used in this area: 715
Altoona, Wisconsin accommodation & food services, waste management - Economy and Business Data
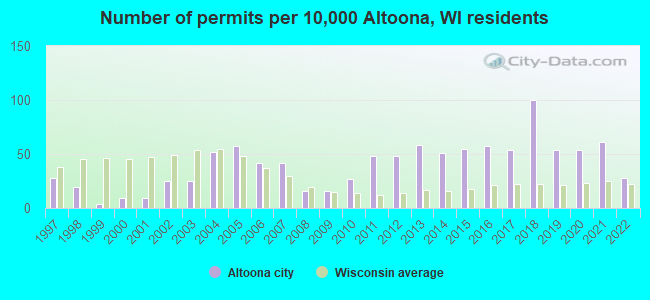
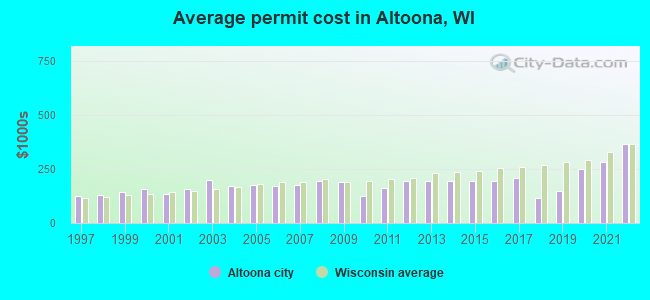
Single-family new house construction building permits:
- 2022: 19 buildings, average cost: $364,900
- 2021: 41 buildings, average cost: $284,100
- 2020: 36 buildings, average cost: $249,900
- 2019: 36 buildings, average cost: $147,000
- 2018: 67 buildings, average cost: $116,200
- 2017: 36 buildings, average cost: $208,700
- 2016: 38 buildings, average cost: $194,500
- 2015: 37 buildings, average cost: $194,500
- 2014: 34 buildings, average cost: $194,500
- 2013: 39 buildings, average cost: $194,500
- 2012: 32 buildings, average cost: $194,500
- 2011: 32 buildings, average cost: $162,400
- 2010: 18 buildings, average cost: $126,000
- 2009: 11 buildings, average cost: $191,800
- 2008: 11 buildings, average cost: $194,700
- 2007: 28 buildings, average cost: $173,600
- 2006: 28 buildings, average cost: $173,300
- 2005: 38 buildings, average cost: $177,200
- 2004: 35 buildings, average cost: $170,200
- 2003: 17 buildings, average cost: $200,600
- 2002: 17 buildings, average cost: $160,300
- 2001: 6 buildings, average cost: $134,200
- 2000: 6 buildings, average cost: $158,300
- 1999: 3 buildings, average cost: $145,000
- 1998: 13 buildings, average cost: $129,700
- 1997: 19 buildings, average cost: $127,100
| Here: | 2.4% |
| Wisconsin: | 2.7% |
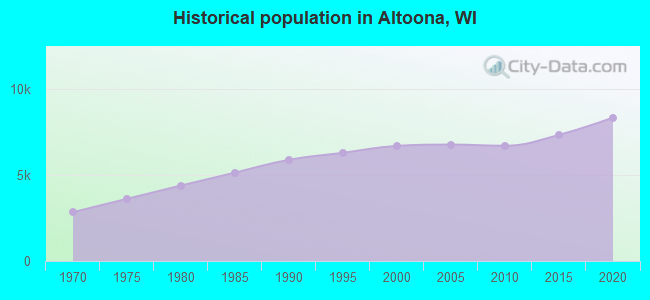
Population change in the 1990s: +824 (+14.0%).
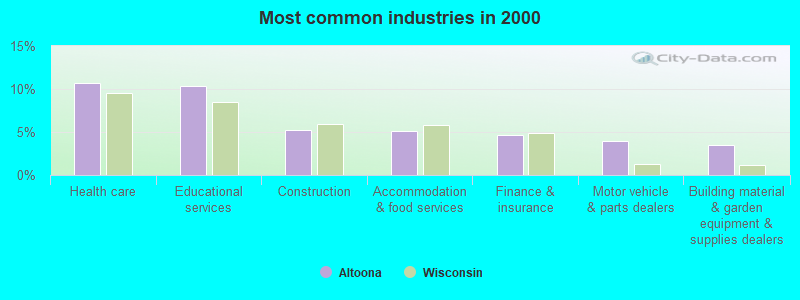
- Health care (10.7%)
- Educational services (10.4%)
- Construction (5.2%)
- Accommodation & food services (5.1%)
- Finance & insurance (4.7%)
- Motor vehicle & parts dealers (4.0%)
- Building material & garden equipment & supplies dealers (3.5%)
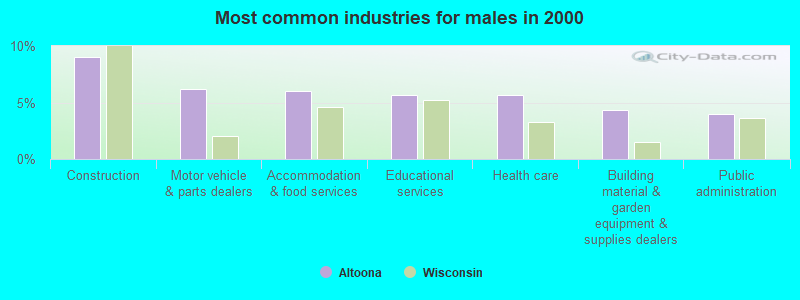
- Construction (9.0%)
- Motor vehicle & parts dealers (6.2%)
- Accommodation & food services (6.0%)
- Educational services (5.7%)
- Health care (5.7%)
- Building material & garden equipment & supplies dealers (4.3%)
- Public administration (4.0%)
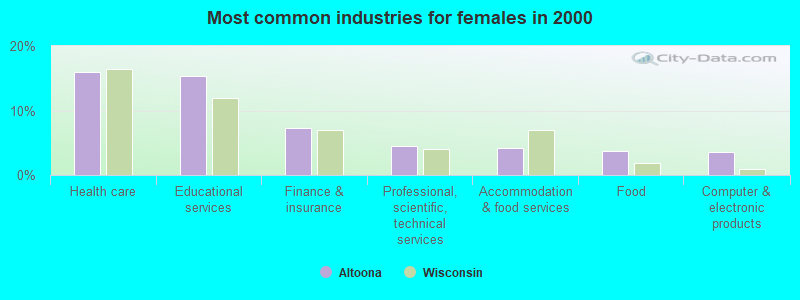
- Health care (16.0%)
- Educational services (15.4%)
- Finance & insurance (7.3%)
- Professional, scientific, technical services (4.6%)
- Accommodation & food services (4.1%)
- Food (3.8%)
- Computer & electronic products (3.5%)
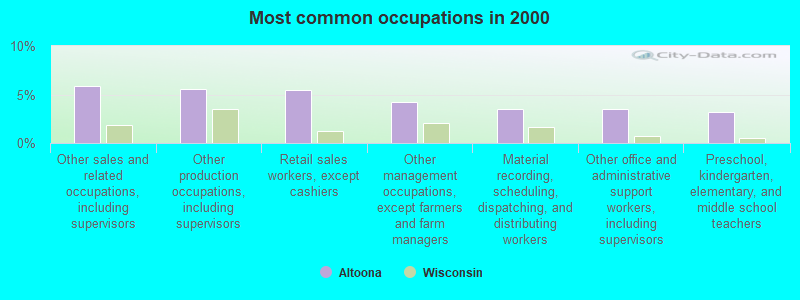
- Other sales and related occupations, including supervisors (5.9%)
- Other production occupations, including supervisors (5.6%)
- Retail sales workers, except cashiers (5.5%)
- Other management occupations, except farmers and farm managers (4.2%)
- Material recording, scheduling, dispatching, and distributing workers (3.5%)
- Other office and administrative support workers, including supervisors (3.5%)
- Preschool, kindergarten, elementary, and middle school teachers (3.2%)
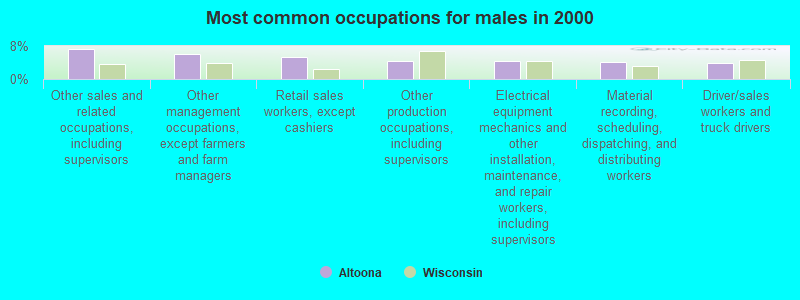
- Other sales and related occupations, including supervisors (7.4%)
- Other management occupations, except farmers and farm managers (6.1%)
- Retail sales workers, except cashiers (5.3%)
- Other production occupations, including supervisors (4.3%)
- Electrical equipment mechanics and other installation, maintenance, and repair workers, including supervisors (4.3%)
- Material recording, scheduling, dispatching, and distributing workers (4.0%)
- Driver/sales workers and truck drivers (4.0%)
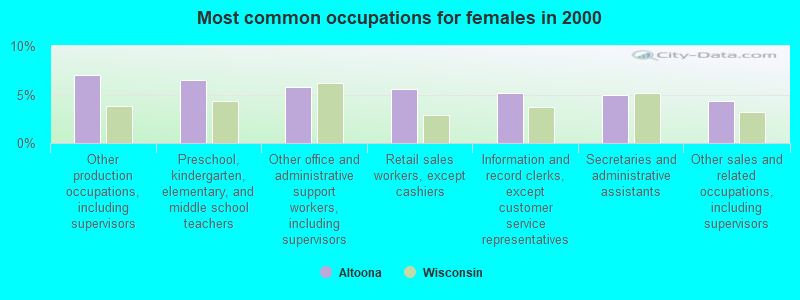
- Other production occupations, including supervisors (7.0%)
- Preschool, kindergarten, elementary, and middle school teachers (6.5%)
- Other office and administrative support workers, including supervisors (5.7%)
- Retail sales workers, except cashiers (5.6%)
- Information and record clerks, except customer service representatives (5.1%)
- Secretaries and administrative assistants (4.9%)
- Other sales and related occupations, including supervisors (4.4%)
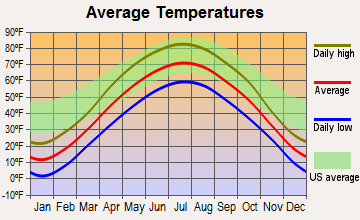
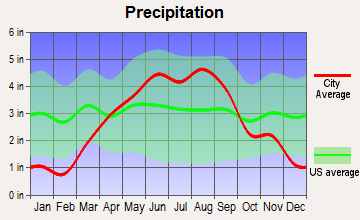
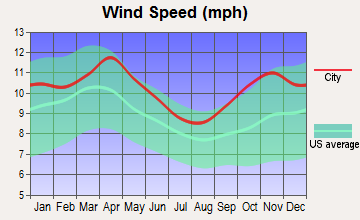
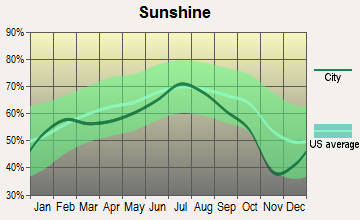
Average climate in Altoona, Wisconsin
Based on data reported by over 4,000 weather stations


|
|

(lower is better)
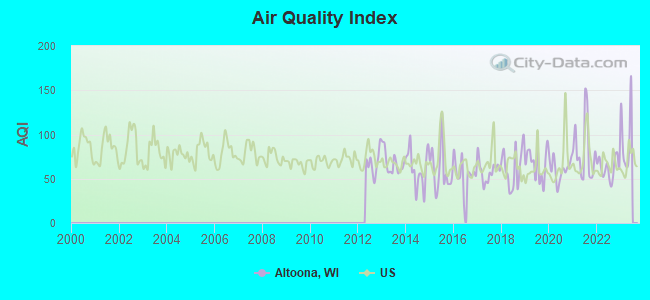
Air Quality Index (AQI) level in 2022 was 62.1. This is about average.
| City: | 62.1 |
| U.S.: | 72.6 |
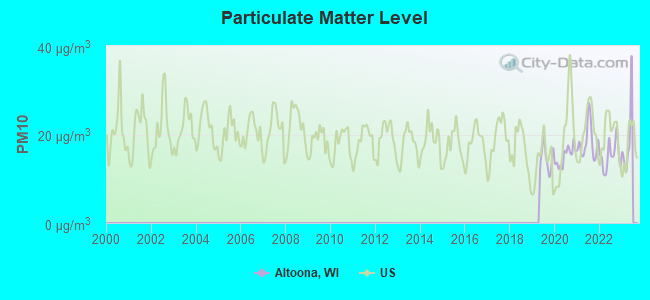
Particulate Matter (PM10) [µg/m3] level in 2022 was 15.2. This is better than average. Closest monitor was 3.2 miles away from the city center.
| City: | 15.2 |
| U.S.: | 19.2 |
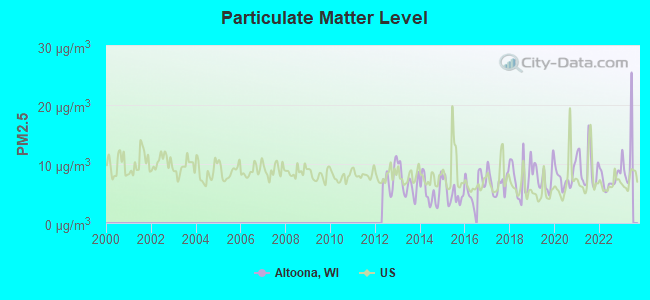
Particulate Matter (PM2.5) [µg/m3] level in 2022 was 7.29. This is about average. Closest monitor was 2.7 miles away from the city center.
| City: | 7.29 |
| U.S.: | 8.11 |
Tornado activity:
Altoona-area historical tornado activity is near Wisconsin state average. It is 9% greater than the overall U.S. average.
On 6/4/1958, a category F5 (max. wind speeds 261-318 mph) tornado 20.3 miles away from the Altoona city center killed 21 people and injured 74 people and caused between $5,000,000 and $50,000,000 in damages.
On 6/4/1958, a category F4 (max. wind speeds 207-260 mph) tornado 8.8 miles away from the city center killed 4 people and injured 3 people and caused between $500,000 and $5,000,000 in damages.
Earthquake activity:
Altoona-area historical earthquake activity is significantly above Wisconsin state average. It is 70% smaller than the overall U.S. average.On 7/9/1975 at 14:54:15, a magnitude 4.6 (4.6 MB, Class: Light, Intensity: IV - V) earthquake occurred 231.8 miles away from the city center
On 6/5/1993 at 01:24:53, a magnitude 4.1 (4.1 LG, Depth: 6.2 mi) earthquake occurred 243.8 miles away from Altoona center
On 6/28/2004 at 06:10:52, a magnitude 4.2 (4.2 MW, Depth: 6.2 mi) earthquake occurred 264.5 miles away from the city center
On 2/10/2010 at 09:59:35, a magnitude 3.8 (3.8 MW, Depth: 6.2 mi, Class: Light, Intensity: II - III) earthquake occurred 245.6 miles away from the city center
On 3/4/1983 at 06:32:18, a magnitude 4.6 (4.4 MB, 4.6 LG, 4.4 ML) earthquake occurred 394.9 miles away from Altoona center
On 2/7/2020 at 18:30:28, a magnitude 3.3 (3.3 ML) earthquake occurred 194.9 miles away from the city center
Magnitude types: regional Lg-wave magnitude (LG), body-wave magnitude (MB), local magnitude (ML), moment magnitude (MW)
Natural disasters:
The number of natural disasters in Eau Claire County (8) is smaller than the US average (15).Major Disasters (Presidential) Declared: 6
Emergencies Declared: 2
Causes of natural disasters: Floods: 5, Storms: 4, Drought: 1, Hurricane: 1, Tornado: 1, Other: 1 (Note: some incidents may be assigned to more than one category).

Hospitals and medical centers in Altoona:
Other hospitals and medical centers near Altoona:
- HEALTHSOUTH - OAK LEAF SURGERY CENTER (Hospital, about 2 miles away; EAU CLAIRE, WI)
- OAK LEAF SURGCL HSPTL Acute Care Hospitals (about 2 miles away; EAU CLAIRE, WI)
- DOVE HEALTHCARE-SOUTH (Nursing Home, about 2 miles away; EAU CLAIRE, WI)
- MAYO CLINIC DIALYSIS - LONDON ROAD (Dialysis Facility, about 3 miles away; EAU CLAIRE, WI)
- SACRED HEART HOSPITAL DIALYSIS (Dialysis Facility, about 3 miles away; EAU CLAIRE, WI)
- SACRED HEART HSPTL Acute Care Hospitals (about 3 miles away; EAU CLAIRE, WI)
- SYVERSON LUTHERAN HOME (Nursing Home, about 3 miles away; EAU CLAIRE, WI)
Colleges/universities with over 2000 students nearest to Altoona:
- University of Wisconsin-Eau Claire (about 3 miles; Eau Claire, WI; Full-time enrollment: 10,143)
- Chippewa Valley Technical College (about 4 miles; Eau Claire, WI; FT enrollment: 4,038)
- University of Wisconsin-Stout (about 25 miles; Menomonie, WI; FT enrollment: 8,120)
- Winona State University (about 54 miles; Winona, MN; FT enrollment: 8,397)
- Saint Mary's University of Minnesota (about 54 miles; Winona, MN; FT enrollment: 4,022)
- University of Wisconsin-River Falls (about 59 miles; River Falls, WI; FT enrollment: 5,868)
- Western Technical College (about 70 miles; La Crosse, WI; FT enrollment: 3,377)
Public high school in Altoona:
- ALTOONA HIGH (Students: 464, Location: 711 7TH ST W, Grades: 9-12)
Public elementary/middle schools in Altoona:
- PEDERSEN ELEMENTARY (Students: 651, Location: 1827 BARTLETT AVE, Grades: PK-3)
- ALTOONA MIDDLE (Students: 448, Location: 1903 BARTLETT AVE, Grades: 6-8)
- ALTOONA INTERMEDIATE (Location: 1903 BARTLETT AVE, Grades: 4-5)
Private elementary/middle schools in Altoona:
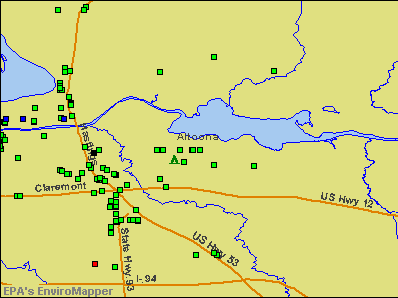
Points of interest:
Notable locations in Altoona: Eau Claire County Club (A), Hillcrest Country Club (B), Gold Cross Ambulance Service Eau Claire Base (C), Altoona Fire Department and Emergency Medical Services (D), Altoona Public Library (E), Altoona City Hall (F). Display/hide their locations on the map
Churches in Altoona include: Altoona United Methodist Church (A), Bethlehem Lutheran Church (B), Islamic Center and Mosque (C), Saint Lukes Anglican Episcopal Church (D), Seventh Day Adventist Church (E). Display/hide their locations on the map
Park in Altoona: Altoona Park (1). Display/hide its location on the map
Hotels: Evenox Motel (2067 South Hastings Way), Hillcrest Motel (2320 North Hillcrest Parkway).
Birthplace of: Fred Thurston - Football player.
Drinking water stations with addresses in Altoona and their reported violations in the past:
ALTOONA WATERWORKS (Population served: 7,500, Groundwater):Past health violations:HILLCREST ESTATES MHP (Population served: 726, Groundwater):Past monitoring violations:
- MCL, Monthly (TCR) - In JUN-2008, Contaminant: Coliform. Follow-up actions: St Public Notif requested (JUN-19-2008), St Violation/Reminder Notice (JUN-19-2008), St Compliance achieved (JUN-25-2008), St Public Notif received (JUL-10-2008)
- MCL, Monthly (TCR) - In OCT-2007, Contaminant: Coliform. Follow-up actions: St Public Notif requested (OCT-08-2007), St Violation/Reminder Notice (OCT-08-2007), St Compliance achieved (OCT-10-2007), St Public Notif received (OCT-24-2007)
- MCL, Monthly (TCR) - In SEP-2006, Contaminant: Coliform. Follow-up actions: St Public Notif requested (SEP-21-2006), St Violation/Reminder Notice (SEP-21-2006), St Boil Water Order (SEP-23-2006), St Public Notif received (SEP-24-2006), St Compliance achieved (SEP-27-2006)
- 55 regular monitoring violations
Past health violations:Past monitoring violations:
- Public Education - In JAN-01-2010, Contaminant: Lead and Copper Rule. Follow-up actions: St Violation/Reminder Notice (MAR-17-2011), St Compliance achieved (MAR-31-2011)
- Lead Consumer Notice - In APR-01-2012, Contaminant: Lead and Copper Rule. Follow-up actions: St Other (MAY-23-2012), St Compliance achieved (DEC-05-2012), St Public Notif received (DEC-05-2012)
- Lead Consumer Notice - In OCT-01-2011, Contaminant: Lead and Copper Rule. Follow-up actions: St Other (MAR-01-2012), St Compliance achieved (DEC-05-2012), St Public Notif received (DEC-05-2012)
Drinking water stations with addresses in Altoona that have no violations reported:
- TOWER RIDGE MULTI-USE FACILITY (Population served: 25, Primary Water Source Type: Groundwater)
| This city: | 2.3 people |
| Wisconsin: | 2.4 people |
| This city: | 61.6% |
| Whole state: | 64.4% |
| This city: | 8.3% |
| Whole state: | 7.3% |
Likely homosexual households (counted as self-reported same-sex unmarried-partner households)
- Lesbian couples: 0.3% of all households
- Gay men: 0.3% of all households
People in group quarters in Altoona in 2000:
- 146 people in nursing homes
- 6 people in homes for the physically handicapped
- 4 people in other group homes
For population 15 years and over in Altoona:
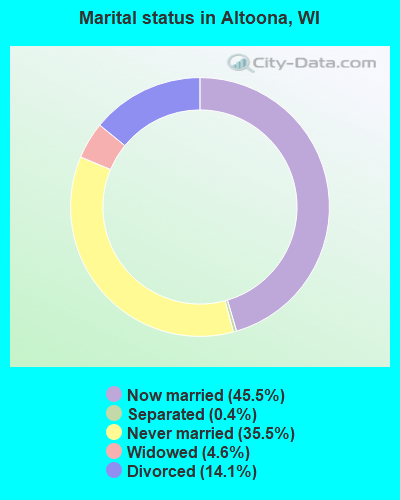
- Never married: 35.5%
- Now married: 45.5%
- Separated: 0.4%
- Widowed: 4.6%
- Divorced: 14.1%
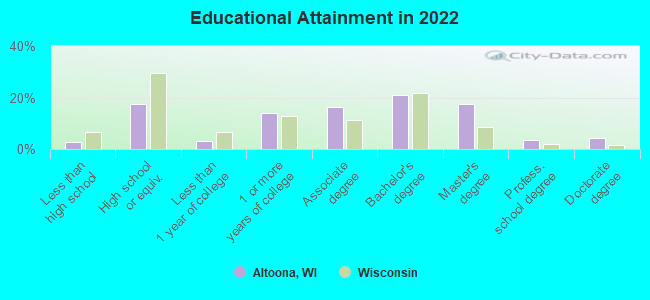
For population 25 years and over in Altoona:
- High school or higher: 96.8%
- Bachelor's degree or higher: 38.2%
- Graduate or professional degree: 17.7%
- Unemployed: 2.8%
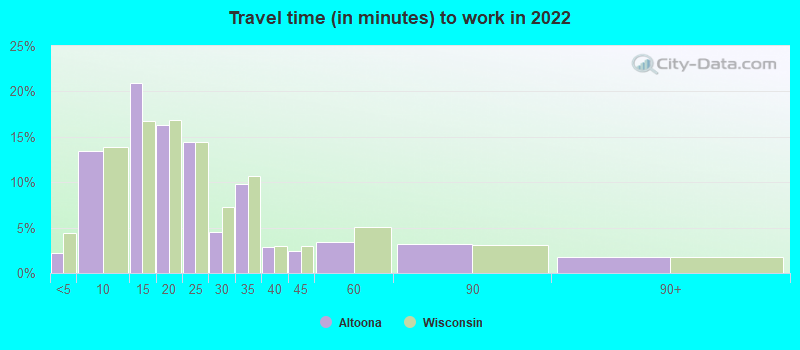
- Mean travel time to work (commute): 13.3 minutes
| Here: | 10.6 |
| Wisconsin average: | 10.4 |
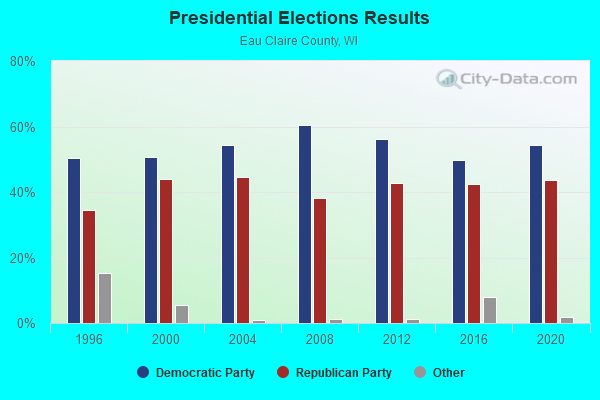
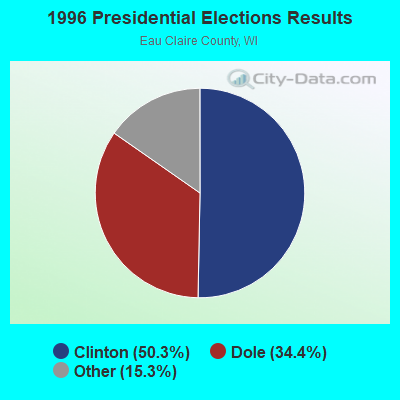
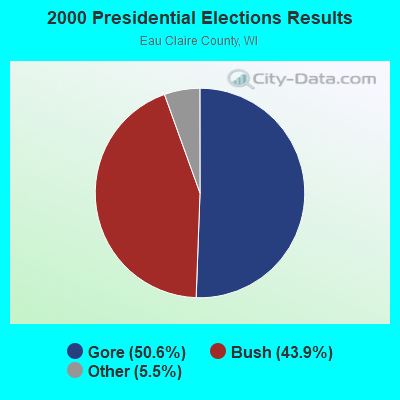
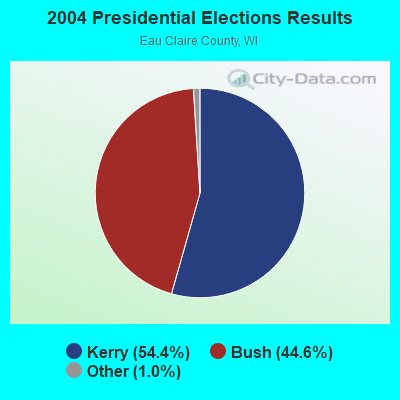
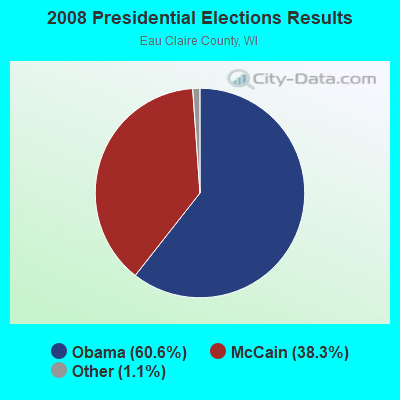
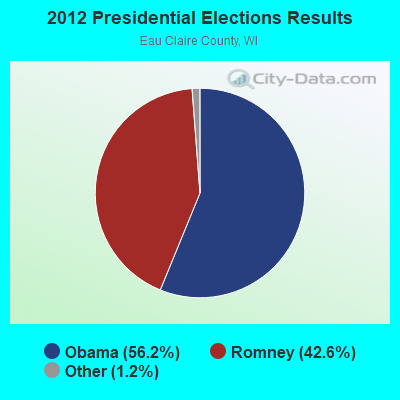

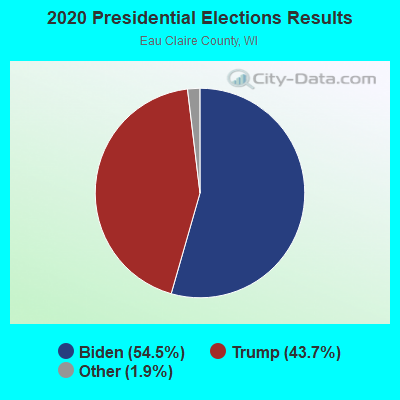
Graphs represent county-level data. Detailed 2008 Election Results
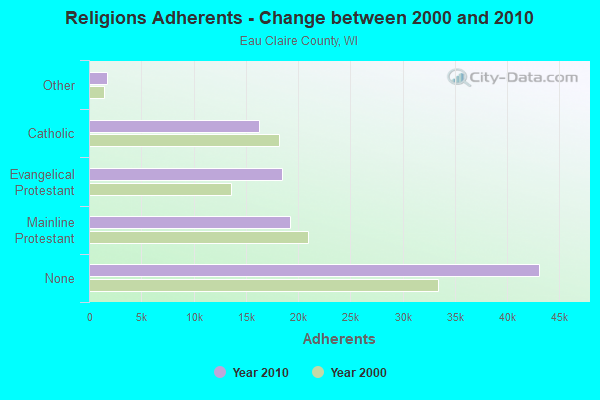
Religion statistics for Altoona, WI (based on Eau Claire County data)
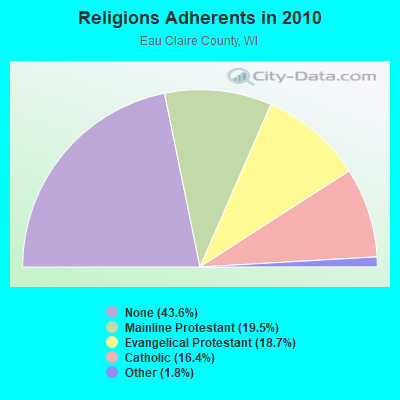
| Religion | Adherents | Congregations |
|---|---|---|
| Mainline Protestant | 19,220 | 29 |
| Evangelical Protestant | 18,442 | 58 |
| Catholic | 16,240 | 10 |
| Other | 1,744 | 12 |
| None | 43,090 | - |
Food Environment Statistics:
| Eau Claire County: | 1.64 / 10,000 pop. |
| Wisconsin: | 1.86 / 10,000 pop. |
| This county: | 0.31 / 10,000 pop. |
| State: | 0.11 / 10,000 pop. |
| Eau Claire County: | 0.10 / 10,000 pop. |
| Wisconsin: | 0.38 / 10,000 pop. |
| Eau Claire County: | 4.10 / 10,000 pop. |
| State: | 4.12 / 10,000 pop. |
| Here: | 7.38 / 10,000 pop. |
| State: | 8.64 / 10,000 pop. |
| This county: | 6.5% |
| Wisconsin: | 7.6% |
| Eau Claire County: | 25.6% |
| Wisconsin: | 27.5% |
| This county: | 10.9% |
| State: | 13.0% |
Health and Nutrition:
| This city: | 48.5% |
| Wisconsin: | 49.5% |
| Here: | 44.8% |
| State: | 46.6% |
| Here: | 28.6 |
| Wisconsin: | 28.7 |
| Altoona: | 21.0% |
| Wisconsin: | 21.4% |
| Altoona: | 9.8% |
| Wisconsin: | 10.2% |
| Altoona: | 6.8 |
| Wisconsin: | 6.8 |
| Here: | 33.9% |
| State: | 34.0% |
| Altoona: | 55.4% |
| Wisconsin: | 56.3% |
| Altoona: | 77.8% |
| State: | 78.5% |
More about Health and Nutrition of Altoona, WI Residents
| Local government employment and payroll (March 2022) | |||||
| Function | Full-time employees | Monthly full-time payroll | Average yearly full-time wage | Part-time employees | Monthly part-time payroll |
|---|---|---|---|---|---|
| Police Protection - Officers | 13 | $74,313 | $68,597 | 0 | $0 |
| Streets and Highways | 5 | $32,117 | $77,081 | 0 | $0 |
| Other Government Administration | 4 | $27,426 | $82,278 | 7 | $2,146 |
| Fire - Other | 4 | $21,470 | $64,410 | 1 | $282 |
| Parks and Recreation | 4 | $20,854 | $62,562 | 12 | $3,428 |
| Financial Administration | 3 | $17,493 | $69,972 | 0 | $0 |
| Police - Other | 3 | $19,502 | $78,008 | 0 | $0 |
| Local Libraries | 3 | $16,088 | $64,352 | 9 | $6,968 |
| Water Supply | 2 | $10,161 | $60,966 | 0 | $0 |
| Solid Waste Management | 1 | $5,158 | $61,896 | 0 | $0 |
| Other and Unallocable | 1 | $6,296 | $75,552 | 2 | $1,229 |
| Sewerage | 1 | $5,003 | $60,036 | 0 | $0 |
| Firefighters | 0 | $0 | 28 | $13,960 | |
| Totals for Government | 44 | $255,880 | $69,785 | 59 | $28,013 |
Altoona government finances - Expenditure in 2017 (per resident):
- Construction - General - Other: $3,372,000 ($368.97)
Regular Highways: $1,858,000 ($203.30)
Parks and Recreation: $1,053,000 ($115.22)
- Current Operations - Police Protection: $1,692,000 ($185.14)
Sewerage: $1,393,000 ($152.42)
Regular Highways: $1,092,000 ($119.49)
Water Utilities: $939,000 ($102.75)
Libraries: $501,000 ($54.82)
Parks and Recreation: $487,000 ($53.29)
Central Staff Services: $359,000 ($39.28)
Financial Administration: $250,000 ($27.36)
General - Other: $209,000 ($22.87)
Local Fire Protection: $202,000 ($22.10)
Protective Inspection and Regulation - Other: $85,000 ($9.30)
Transit Utilities: $64,000 ($7.00)
Judicial and Legal Services: $62,000 ($6.78)
Health - Other: $34,000 ($3.72)
Solid Waste Management: $27,000 ($2.95)
General Public Buildings: $6,000 ($0.66)
- General - Interest on Debt: $930,000 ($101.76)
- Other Capital Outlay - Regular Highways: $165,000 ($18.05)
Police Protection: $94,000 ($10.29)
Local Fire Protection: $52,000 ($5.69)
Central Staff Services: $36,000 ($3.94)
- Total Salaries and Wages: $2,418,000 ($264.58)
Altoona government finances - Revenue in 2017 (per resident):
- Charges - Sewerage: $1,558,000 ($170.48)
Regular Highways: $384,000 ($42.02)
Parks and Recreation: $171,000 ($18.71)
Other: $63,000 ($6.89)
- Federal Intergovernmental - Housing and Community Development: $98,000 ($10.72)
- Local Intergovernmental - Other: $191,000 ($20.90)
- Miscellaneous - Sale of Property: $1,010,000 ($110.52)
Interest Earnings: $390,000 ($42.67)
Special Assessments: $164,000 ($17.95)
General Revenue - Other: $144,000 ($15.76)
Donations From Private Sources: $35,000 ($3.83)
Fines and Forfeits: $29,000 ($3.17)
Rents: $9,000 ($0.98)
- Revenue - Water Utilities: $1,182,000 ($129.34)
- State Intergovernmental - General Local Government Support: $1,270,000 ($138.96)
Highways: $420,000 ($45.96)
Education: $202,000 ($22.10)
Other: $95,000 ($10.40)
- Tax - Property: $5,854,000 ($640.55)
Other: $125,000 ($13.68)
Other License: $112,000 ($12.26)
Occupation and Business License - Other: $107,000 ($11.71)
Other Selective Sales: $83,000 ($9.08)
Altoona government finances - Debt in 2017 (per resident):
- Long Term Debt - Outstanding Unspecified Public Purpose: $28,515,000 ($3120.14)
Beginning Outstanding - Unspecified Public Purpose: $23,256,000 ($2544.70)
Issue, Unspecified Public Purpose: $7,000,000 ($765.95)
Retired Unspecified Public Purpose: $1,741,000 ($190.50)
Altoona government finances - Cash and Securities in 2017 (per resident):
- Bond Funds - Cash and Securities: $2,792,000 ($305.50)
- Other Funds - Cash and Securities: $20,687,000 ($2263.60)
- Sinking Funds - Cash and Securities: $7,000 ($0.77)
| Businesses in Altoona, WI | ||||
| Name | Count | Name | Count | |
|---|---|---|---|---|
| KFC | 1 | U-Haul | 2 | |
| Subway | 1 | UPS | 3 | |
Strongest AM radio stations in Altoona:
- WAYY (790 AM; 5 kW; EAU CLAIRE, WI; Owner: MAVERICK MEDIA OF EAU CLAIRE LICENSE LLC)
- WDVM (1050 AM; 1 kW; EAU CLAIRE, WI; Owner: STARBOARD BROADCASTING, INC.)
- WEAQ (1150 AM; 5 kW; CHIPPEWA FALLS, WI; Owner: MAVERICK MEDIA OF EAU CLAIRE LICENSE LLC)
- WOGO (680 AM; 2 kW; HALLIE, WI; Owner: STEWARDS OF SOUND, INC.)
- WBIZ (1400 AM; 1 kW; EAU CLAIRE, WI; Owner: CAPSTAR TX LIMITED PARTNERSHIP)
- WMEQ (880 AM; 10 kW; MENOMONIE, WI; Owner: CAPSTAR TX LIMITED PARTNERSHIP)
- WCTS (1030 AM; 50 kW; MAPLEWOOD, MN; Owner: CNTL. BAPT. THEO/AL SEMI MINNEAPOLIS)
- WCCO (830 AM; 50 kW; MINNEAPOLIS, MN; Owner: INFINITY MEDIA CORPORATION)
- WSPT (1010 AM; 50 kW; STEVENS POINT, WI)
- KSTP (1500 AM; 50 kW; ST. PAUL, MN; Owner: KSTP-AM, LLC (DELAWARE))
- WEBC (560 AM; 50 kW; DULUTH, MN)
- KFAN (1130 AM; 50 kW; MINNEAPOLIS, MN; Owner: AMFM RADIO LICENSES, L.L.C.)
- KTIS (900 AM; 25 kW; MINNEAPOLIS, MN; Owner: NORTHWESTERN COLLEGE)
Strongest FM radio stations in Altoona:
- WUEC (89.7 FM; EAU CLAIRE, WI; Owner: BOARD OF REGENTS, UNIVERSITY OF WISCONSIN SYSTEM)
- WBIZ-FM (100.7 FM; EAU CLAIRE, WI; Owner: CAPSTAR TX LIMITED PARTNERSHIP)
- WIAL (94.1 FM; EAU CLAIRE, WI; Owner: MAVERICK MEDIA OF EAU CLAIRE LICENSE LLC)
- WISM-FM (98.1 FM; ALTOONA, WI; Owner: CLEAR CHANNEL BROADCASTING LICENSES, INC.)
- WHEM (91.3 FM; EAU CLAIRE, WI; Owner: FOURTH DIMENSION, INC.)
- WECL (92.9 FM; ELK MOUND, WI; Owner: MAVERICK MEDIA OF EAU CLAIRE LICENSE LLC)
- WAXX (104.5 FM; EAU CLAIRE, WI; Owner: MAVERICK MEDIA OF EAU CLAIRE LICENSE LLC)
- WCFW (105.7 FM; CHIPPEWA FALLS, WI; Owner: BUSHLAND RADIO SPECIALTIES/WCFW)
- WWIB (103.7 FM; HALLIE, WI; Owner: STEWARDS OF SOUND, INC.)
- WHWC (88.3 FM; MENOMONIE, WI; Owner: STATE OF WISCONSIN - EDUCATIONAL COMMUNICATIONS BOARD)
- WQRB (95.1 FM; BLOOMER, WI; Owner: CAPSTAR TX LIMITED PARTNERSHIP)
- WVCF (90.5 FM; EAU CLAIRE, WI; Owner: VCY AMERICA, INC.)
- W206AH (89.1 FM; EAU CLAIRE, WI; Owner: FAMILY STATIONS, INC.)
- WMEQ-FM (92.1 FM; MENOMONIE, WI; Owner: CAPSTAR TX LIMITED PARTNERSHIP)
- WATQ (106.7 FM; CHETEK, WI; Owner: CAPSTAR TX LIMITED PARTNERSHIP)
- WDMO (95.9 FM; DURAND, WI; Owner: ZOE COMMUNICATIONS, INC.)
- WVSS (90.7 FM; MENOMONIE, WI; Owner: BD. OF REGENTS, UNIVERSITY OF WISCONSIN SYSTEM)
- W211AY (90.1 FM; MENOMONIE, WI; Owner: CALVARY CHAPEL OF TWIN FALLS, INC.)
- WDRK (99.9 FM; CORNELL, WI; Owner: MAVERICK MEDIA OF EAU CLAIRE LICENSE LLC)
- WHTL-FM (102.3 FM; WHITEHALL, WI; Owner: THE WHTL GROUP, L.L.C.)
TV broadcast stations around Altoona:
- WQOW-TV (Channel 18; EAU CLAIRE, WI; Owner: WXOW-WQOW TELEVISION, INC.)
- WEAU-TV (Channel 13; EAU CLAIRE, WI; Owner: WEAU LICENSEE CORP.)
- WHWC-TV (Channel 28; MENOMONIE, WI; Owner: STATE OF WISCONSIN - EDUCATIONAL COMMUNICATIONS BOARD)
- WEUX (Channel 48; CHIPPEWA FALLS, WI; Owner: GRANT MEDIA INC.)
- WKBT (Channel 8; LA CROSSE, WI; Owner: QUEENB TELEVISION, LLC)
- National Bridge Inventory (NBI) Statistics
- 20Number of bridges
- 469ft / 143mTotal length
- $2,426,000Total costs
- 313,058Total average daily traffic
- 3,081Total average daily truck traffic
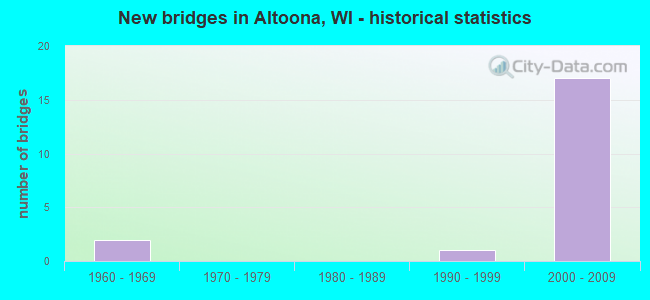
- New bridges - historical statistics
- 21960-1969
- 11990-1999
- 172000-2009
FCC Registered Antenna Towers:
16 (See the full list of FCC Registered Antenna Towers in Altoona)FCC Registered Broadcast Land Mobile Towers:
7- 1303 Lynn Ave (Lat: 44.801361 Lon: -91.441556), Call Sign: WZX853, Licensee ID: L00093337,
Assigned Frequencies: 155.715 MHz, Grant Date: 03/22/1999, Expiration Date: 05/23/2004, Cancellation Date: 07/25/2004, Registrant: City Of Altoona, 1303 Lynn Ave, Altoona, WI 54720
- 1303 Lynn Ave (Lat: 44.801361 Lon: -91.441556), Call Sign: WFQ805, Licensee ID: L00093337,
Assigned Frequencies: 159.030 MHz, Grant Date: 04/19/1999, Expiration Date: 07/10/2004, Cancellation Date: 09/26/2004, Registrant: Altoona Wisconsin City Of, 1303 Lynn Ave, Altoona, WI 54720, Phone: (715) 839-6090
- 2153 S Hastings Way (Lat: 44.800528 Lon: -91.432111), Call Sign: KNDY847, Licensee ID: L00093878,
Assigned Frequencies: 150.890 MHz, Grant Date: 12/15/1997, Expiration Date: 12/02/2002, Cancellation Date: 03/09/2003, Registrant: Larry A Birkholz, 2153 S Hasings Way, Altoona, WI 54702, Phone: (715) 834-7278
- Lat: 44.795111 Lon: -91.447000, Call Sign: WPUW380,
Assigned Frequencies: 451.325 MHz, Grant Date: 07/02/2012, Expiration Date: 05/15/2022, Cancellation Date: 07/16/2022, Certifier: Steven J Hall, Registrant: Rassbach Communications, 405 N. Hastings Pl., Eau Claire, WI 54703, Phone: (715) 832-6763, Fax: (715) 832-1698, Email:
- 2003 S. Hastings Way (Lat: 44.799028 Lon: -91.466417), Call Sign: WQBD362,
Assigned Frequencies: 464.212 MHz, 464.037 MHz, 464.237 MHz, 464.062 MHz, 464.262 MHz, 464.087 MHz, 464.287 MHz, 464.112 MHz, 464.312 MHz, 464.137 MHz... (+4 more), Grant Date: 07/19/2014, Expiration Date: 09/22/2024, Certifier: Jennifer S Dutcher Ms., Registrant: Erc Parts, Inc., 4001 Cobb International Blvd., Kennesaw, GA 30152, Phone: (800) 241-6880, Fax: (770) 951-1875, Email:
- Lat: 44.807472 Lon: -91.440444, Call Sign: WQDX899, Licensee ID: L00093337,
Assigned Frequencies: 154.830 MHz, Grant Date: 09/11/2015, Expiration Date: 11/28/2025, Certifier: Todd W Chaney, Registrant: City Of Altoona, 1904 Spooner Ave., Altoona, WI 54720, Phone: (715) 839-6090
- Lat: 44.819889 Lon: -91.456417, Call Sign: WQXP518,
Assigned Frequencies: 452.812 MHz, 456.612 MHz, 457.137 MHz, 462.487 MHz, 462.512 MHz, Grant Date: 05/02/2016, Expiration Date: 05/02/2026, Certifier: Cathy Leibke, Registrant: Rassbach Communications Svc., 405 N. Hastings Place, Eau Claire, WI 54703, Phone: (715) 832-6763, Fax: (715) 832-1698, Email:
FCC Registered Microwave Towers:
6- WECL STUDIO, 944 Harlem Street (Lat: 44.800556 Lon: -91.465750), Type: Ltower, Structure height: 16.8 m, Overall height: 18.3 m, Call Sign: WPJD676,
Assigned Frequencies: 947.500 MHz, Grant Date: 02/07/1996, Expiration Date: 12/01/2028, Registrant: Mid-West Management Inc., 944 Harlem St., Altoona, WI 54720, Phone: (608) 273-1000, Email:
- ALTOONA, 7025 Prill Road (Lat: 44.778917 Lon: -91.395889), Type: Mast, Structure height: 55.2 m, Overall height: 58.2 m, Call Sign: WPNG601, Licensee ID: L00128694,
Assigned Frequencies: 6760.00 MHz, Grant Date: 03/28/2011, Expiration Date: 02/01/2021, Cancellation Date: 11/25/2015, Certifier: Michael P Goggin, Registrant: New Cingular Wireless Pcs, LLC
- Lat: 44.799944 Lon: -91.450139, Overall height: 2.4 m, Call Sign: WPNJ753,
Assigned Frequencies: 956.368 MHz, Grant Date: 06/10/2013, Expiration Date: 03/09/2023, Cancellation Date: 05/13/2023, Registrant: City Of Altoona, 1303 Lynn Avenue, Altoona, WI 54720, Phone: (715) 839-6092, Fax: (715) 839-1800, Email:
- ALTOONA YARD OFFICE, 1428 Spooner Avenue (Lat: 44.807528 Lon: -91.434250), Type: Ltower, Structure height: 24.4 m, Overall height: 25.9 m, Call Sign: WQUS403,
Assigned Frequencies: 928.768 MHz, 952.768 MHz, Grant Date: 09/26/2014, Expiration Date: 09/26/2024, Cancellation Date: 12/07/2022, Certifier: Thomas J Mcgovern, Registrant: Prokarma, 222 S 15th St. Suite 505n, Omaha, NE 68102, Phone: (402) 522-5068, Fax: (402) 233-3179, Email:
- ATLA WI 01, 1428 Spooner Avenue (Lat: 44.807472 Lon: -91.434194), Type: Mtower, Structure height: 26 m, Call Sign: WQYQ857,
Assigned Frequencies: 17965.0 MHz, 17965.0 MHz, 17965.0 MHz, 17965.0 MHz, 17965.0 MHz, 17965.0 MHz, Grant Date: 12/14/2016, Expiration Date: 12/14/2026, Certifier: Thomas J Mcgovern, Registrant: Prokarma, 222 So 15th St. Suite 505n, Omaha, NE 68102, Phone: (402) 522-5068, Fax: (402) 233-3179, Email:
- ATLA WI 06, 217-327 Co Hwy Kb (Lat: 44.802667 Lon: -91.412889), Type: Ltower, Structure height: 30.5 m, Call Sign: WQYQ858,
Assigned Frequencies: 19525.0 MHz, 19525.0 MHz, 19525.0 MHz, 19525.0 MHz, 19525.0 MHz, 19525.0 MHz, Grant Date: 12/14/2016, Expiration Date: 12/14/2026, Certifier: Thomas J Mcgovern, Registrant: Prokarma, 222 So 15th St. Suite 505n, Omaha, NE 68102, Phone: (402) 522-5068, Fax: (402) 233-3179, Email:
FCC Registered Amateur Radio Licenses:
38 (See the full list of FCC Registered Amateur Radio Licenses in Altoona)FAA Registered Aircraft:
3- Aircraft: KELLY WILLIAM B CHALLENGER II (Category: Land, Seats: 2, Weight: Up to 12,499 Pounds), Engine: AMA/EXPR UNKNOWN ENG (Reciprocating)
N-Number: 19BK, N19BK, N-19BK, Serial Number: CH2-0601-2100, Year manufactured: 2001, Airworthiness Date: 02/12/2002, Certificate Issue Date: 01/17/2013
Registrant (Individual): Robert L Jr Cerutti, 1412 Daniels Ave, Altoona, WI 54720 - Aircraft: ERIC BLEZIEN XE285 (Category: Land, Weight: Up to 12,499 Pounds), Engine: INNTEC 800 (85 HP) (Reciprocating)
N-Number: 40WD, N40WD, N-40WD, Serial Number: MXE1334F18B, Year manufactured: 2019, Airworthiness Date: 01/21/2020, Certificate Issue Date: 12/14/2018
Registrant (Individual): Eric Blezien, 7221 S Shore Dr, Altoona, WI 54720 - Aircraft: CESSNA 172G (Category: Land, Seats: 4, Weight: Up to 12,499 Pounds, Speed: 105 mph), Engine: CONT MOTOR 0-300 SER (145 HP) (Reciprocating)
N-Number: 891SR, N891SR, N-891SR, Serial Number: 17253588, Year manufactured: 1966, Airworthiness Date: 10/26/1965, Certificate Issue Date: 08/13/1986
Registrant (Individual): Daniel D Riewestahl, 404 Lake Rd, Altoona, WI 54720
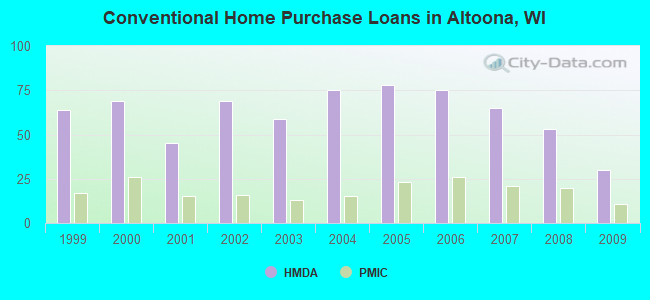
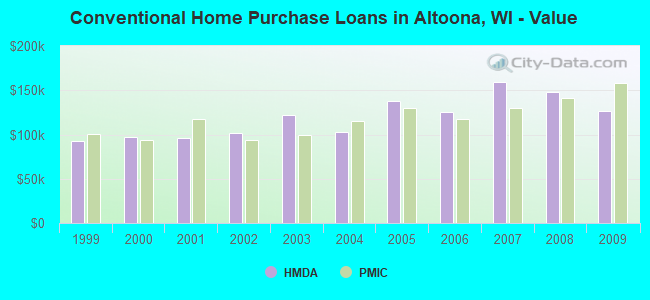
| Home Mortgage Disclosure Act Aggregated Statistics For Year 2009 (Based on 1 partial tract) | ||||||||||||||
| A) FHA, FSA/RHS & VA Home Purchase Loans | B) Conventional Home Purchase Loans | C) Refinancings | D) Home Improvement Loans | E) Loans on Dwellings For 5+ Families | F) Non-occupant Loans on < 5 Family Dwellings (A B C & D) | G) Loans On Manufactured Home Dwelling (A B C & D) | ||||||||
|---|---|---|---|---|---|---|---|---|---|---|---|---|---|---|
| Number | Average Value | Number | Average Value | Number | Average Value | Number | Average Value | Number | Average Value | Number | Average Value | Number | Average Value | |
| LOANS ORIGINATED | 11 | $108,612 | 30 | $126,222 | 152 | $146,501 | 7 | $24,176 | 1 | $204,270 | 13 | $108,757 | 2 | $14,845 |
| APPLICATIONS APPROVED, NOT ACCEPTED | 0 | $0 | 4 | $99,015 | 23 | $132,107 | 1 | $1,780 | 0 | $0 | 1 | $81,940 | 1 | $27,310 |
| APPLICATIONS DENIED | 2 | $145,185 | 4 | $126,182 | 26 | $125,200 | 1 | $21,970 | 0 | $0 | 2 | $182,295 | 2 | $41,270 |
| APPLICATIONS WITHDRAWN | 1 | $81,940 | 2 | $99,460 | 23 | $174,500 | 0 | $0 | 0 | $0 | 0 | $0 | 0 | $0 |
| FILES CLOSED FOR INCOMPLETENESS | 0 | $0 | 1 | $18,410 | 3 | $121,333 | 0 | $0 | 0 | $0 | 0 | $0 | 1 | $18,410 |
Detailed HMDA statistics for the following Tracts: 0004.00
| Private Mortgage Insurance Companies Aggregated Statistics For Year 2009 (Based on 1 partial tract) | ||||
| A) Conventional Home Purchase Loans | B) Refinancings | |||
|---|---|---|---|---|
| Number | Average Value | Number | Average Value | |
| LOANS ORIGINATED | 11 | $158,275 | 16 | $171,386 |
| APPLICATIONS APPROVED, NOT ACCEPTED | 2 | $171,905 | 2 | $212,580 |
| APPLICATIONS DENIED | 2 | $87,880 | 2 | $149,935 |
| APPLICATIONS WITHDRAWN | 1 | $57,000 | 1 | $62,940 |
| FILES CLOSED FOR INCOMPLETENESS | 1 | $57,000 | 0 | $0 |
Detailed PMIC statistics for the following Tracts: 0004.00
2003 - 2018 National Fire Incident Reporting System (NFIRS) incidents
- Fire incident types reported to NFIRS in Altoona, WI
- 12657.8%Structure Fires
- 5123.4%Outside Fires
- 3516.1%Mobile Property/Vehicle Fires
- 62.8%Other
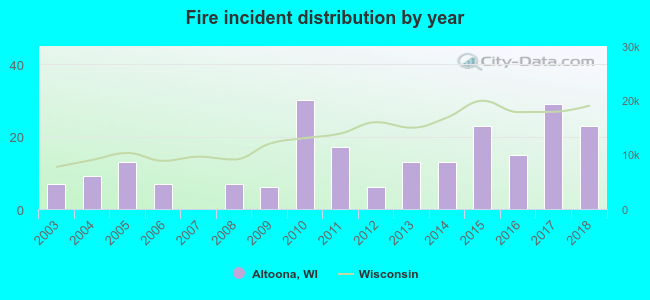 According to the data from the years 2003 - 2018 the average number of fires per year is 14. The highest number of fire incidents - 30 took place in 2010, and the least - 0 in 2007. The data has a growing trend.
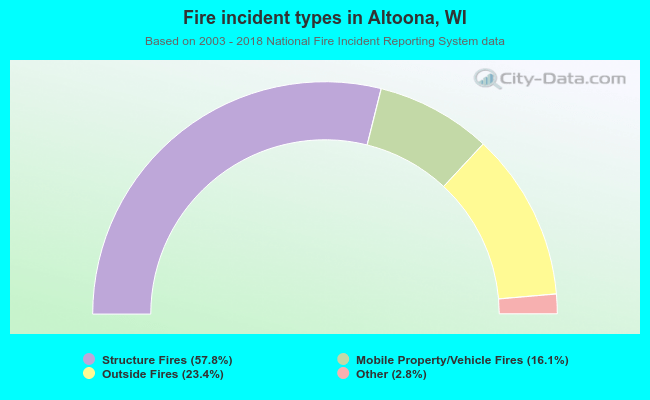 When looking into fire subcategories, the most incidents belonged to: Structure Fires (57.8%), and Outside Fires (23.4%).
| Most common first names in Altoona, WI among deceased individuals | ||
| Name | Count | Lived (average) |
|---|---|---|
| Margaret | 28 | 82.8 years |
| Mary | 25 | 81.7 years |
| Donald | 24 | 72.9 years |
| William | 21 | 76.5 years |
| Robert | 19 | 72.0 years |
| Arthur | 19 | 77.5 years |
| Helen | 16 | 85.3 years |
| John | 15 | 77.1 years |
| Mildred | 13 | 86.9 years |
| Edward | 13 | 78.6 years |
| Most common last names in Altoona, WI among deceased individuals | ||
| Last name | Count | Lived (average) |
|---|---|---|
| Johnson | 26 | 83.4 years |
| Nelson | 17 | 83.5 years |
| Anderson | 14 | 77.2 years |
| Olson | 12 | 76.3 years |
| Thompson | 12 | 81.3 years |
| Miller | 11 | 78.9 years |
| Brown | 11 | 67.4 years |
| Larson | 9 | 70.9 years |
| Schlewitz | 8 | 81.2 years |
| Henning | 8 | 84.4 years |
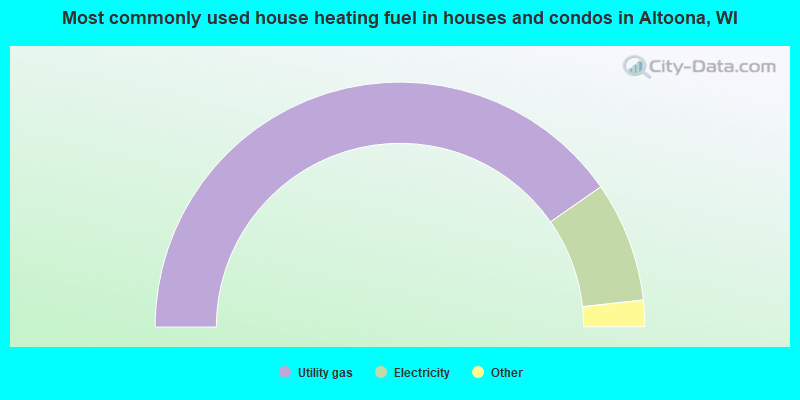
- 80.7%Utility gas
- 15.9%Electricity
- 1.3%Fuel oil, kerosene, etc.
- 1.3%Wood
- 0.8%Bottled, tank, or LP gas
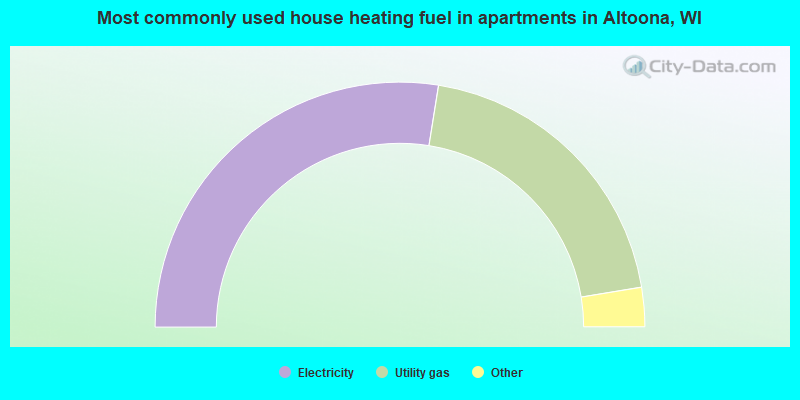
- 55.1%Electricity
- 39.8%Utility gas
- 2.7%Other fuel
- 2.4%Bottled, tank, or LP gas
Altoona compared to Wisconsin state average:
- Unemployed percentage significantly below state average.
- Black race population percentage significantly below state average.
- Hispanic race population percentage below state average.
- Median age below state average.
- Foreign-born population percentage significantly below state average.
- Length of stay since moving in below state average.
- House age below state average.
- Percentage of population with a bachelor's degree or higher above state average.

|
|
Total of 24 patent applications in 2008-2024.