


Relative area comparison
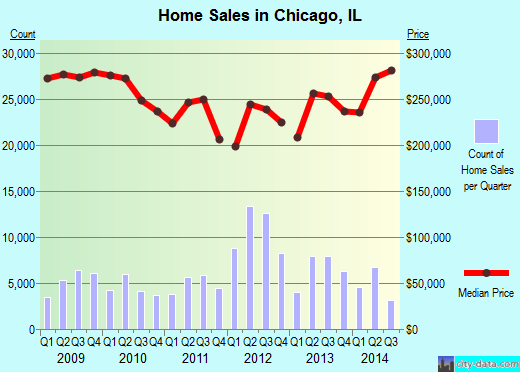
 Chicago, IL
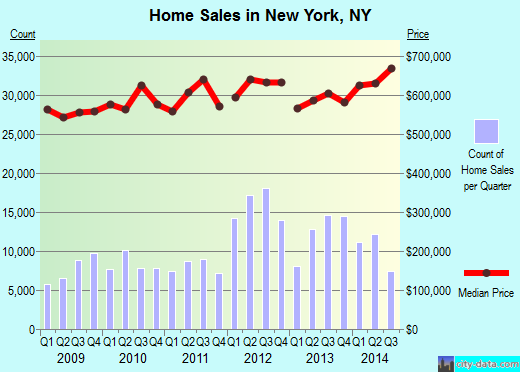
 New York, NY
Chicago, IL and
New York, NY : 718.1 miles
New York, NY
Chicago, IL and
New York, NY : 718.1 miles
New York's population is larger by 214%. Its population has grown by 459,235 people (5.7%) since 2000. The population of Chicago has decreased by 199,461 people (6.9%) during that time.
| Population | ||
| Type | Chicago | New York |
|---|---|---|
| Population | 2,696,555 |
8,467,513 |
| Female / male percentage | 51.4% / 48.6%
|
52% / 48%
|
| Urban / rural population | 100% / 0%
|
100% / 0%
|
According to our data, there are 3,415 registered sex offenders living in Chicago and 4,562 registered sex offenders living in .
The ratio of residents to sex offenders in Chicago is 792 to 1; the ratio in New York is 1,871 to 1.
The number of registered sex offenders compared to the number of residents is larger in Chicago than in New York.
| Income | ||
| Type | Chicago | New York |
|---|---|---|
| Estimated median household income | $66,576 |
$67,997 |
| Estimated per capita income | $43,217 |
$42,406 |
| Cost of living index (U.S. average is 100) | 104.8 |
160.2 |
If you make $50,000 in Chicago, you will have to make $76,431 in New York to maintain the same standard of living.
| Geographical information | ||
| Type | Chicago | New York |
|---|---|---|
| Land area | 227.1 sq. miles | 303.3 sq. miles |
| Population density | 11,872 people per sq. mile | 27,917 people per sq. mile |
| Elevation | 596 feet | 30 feet |
Chicago, IL
New York, NY
| Educational attainment | ||
| Type | Chicago | New York |
|---|---|---|
| Less than high school | 12.9% |
16.1% |
| High school or equiv. | 20.7% |
22.8% |
| Less than 1 year of college | 5% |
3.9% |
| 1 or more years of college | 11.7% |
9.5% |
| Associate degree | 6% |
6.6% |
| Bachelor's degree | 24.9% |
23.5% |
| Master's degree | 13% |
12.3% |
| Profess. school degree | 3.6% |
3.4% |
| Doctorate degree | 2.1% |
1.7% |
| Education level (25-year-olds and older) | ||
| Type | Chicago | New York |
|---|---|---|
| Bachelor's degree or higher | 43.7% |
41% |
| Graduate or professional degree | 18.7% |
17.4% |
| High school or higher | 87.1% |
83.9% |
In Chicago (Cook County), 74.0% voted for Democrats and 24.6% for Republicans in 2012 Presidential Election. In New York (New York County), 83.9% voted for Democrats and 14.9% for Republicans.
| Weather and climate | ||
| Type | Chicago | New York |
|---|---|---|
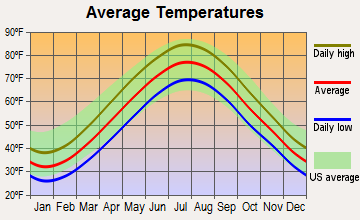
| Temperature - Average | 50.3°F | 54.9°F |
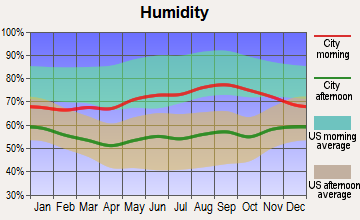
| Humidity - Average morning or afternoon humidity | 75.6% |
67.6% |
| Humidity - Differences between morning and afternoon humidity | 31% |
26.5% |
| Humidity - Maximum monthly morning or afternoon humidity | 85% |
75.9% |
| Humidity - Minimum monthly morning or afternoon humidity | 54% |
49.4% |
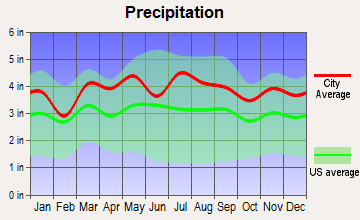
| Precipitation - Yearly average | 37.8 in | 46.6 in |
| Snowfall - Yearly average | 77.6 in | 54.4 in |
| Clouds - Number of days clear of clouds | 14% |
16.6% |
| Sunshine amount - Average | 56.8% |
60.2% |
| Sunshine amount - Differences during a year | 33% |
20% |
| Sunshine amount - Maximum monthly | 68% |
64% |
| Sunshine amount - Minimum monthly | 35% |
44% |
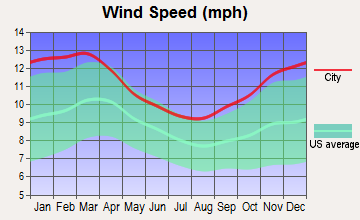
| Wind speed - Average | 10.7 mph | 10.4 mph |
| Natural disasters | ||
| Type | Chicago | New York |
|---|---|---|
| Tornado activity compared to U.S. average | 145.8% |
56.5% |
| Earthquake activity compared to U.S. average | 136.9% |
30.8% |
| Natural disasters compared to U.S. average | 20% |
18% |
| Transport | ||
| Type | Chicago | New York |
|---|---|---|
| Amtrak stations | 1 |
1 |
| Amtrak stations nearby | 3 |
3 |
| FAA registered aircraft | 1 |
753 |
| FAA registered aircraft manufacturers and dealers | 12 |
8 |
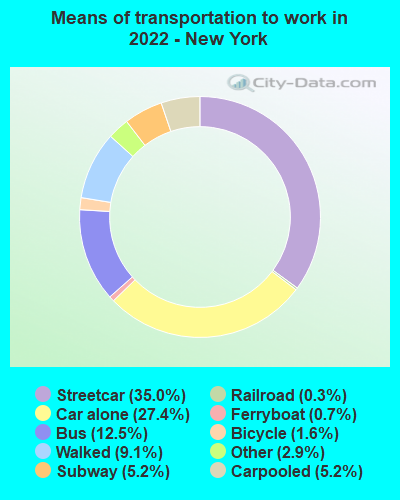
| Means of transportation to work | ||
| Type | Chicago | New York |
|---|---|---|
| Bicycle | 1.6% |
1.7% |
| Bus | 8% |
12.3% |
| Carpooled | 8.3% |
5.6% |
| Car alone | 62.3% |
30.5% |
| Ferryboat | 0% |
0.4% |
| Railroad | 0.2% |
0.3% |
| Streetcar | 6.8% |
32% |
| Subway | 3.5% |
4% |
| Taxicab | 0.8% |
1.7% |
| Walked | 5.9% |
10.1% |
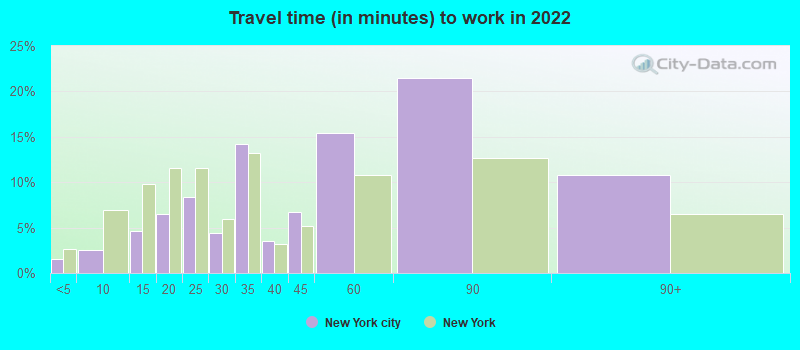
| Average travel time to work | ||
| Type | Chicago | New York |
|---|---|---|
| Average | 36.9 min | 46.2 min |
| Other means | 33.1 min | 31.3 min |
| Public transportation | 44.8 min | 49.3 min |
| Private vehicle occupancy | ||
| Type | Chicago | New York |
|---|---|---|
| Average | 1.2 |
1.3 |
| Drove alone | 86.7% |
83.3% |
| In 2 person carpool | 9.3% |
12.5% |
| In 3 person carpool | 2.4% |
1.8% |
| In 4 person carpool | 0.9% |
1% |
| In 5-6 person carpool | 0.4% |
0.8% |
| In 7+ person carpool | 0.3% |
0.6% |
How many people usually rode to work in the car, truck or van.
| Houses and residents | ||
| Type | Chicago | New York |
|---|---|---|
| Houses | 1,272,191 |
3,641,931 |
| Average household size (people) | 2.5 |
2.6 |
| Median year apartment built | 1955 |
1952 |
| Median year house/condo built | 1951 |
1952 |
| Length of stay in the house since moving in | 14.7 years | 15.6 years |
| Houses occupied | 1,139,537 (89.6%) | 3,263,895 (89.6%) |
| Houses occupied by owners | 530,977 (46.6%) | 1,085,936 (33.3%) |
| Houses occupied by renters | 608,560 (53.4%) | 2,177,959 (66.7%) |
| Median rent asked for vacant for-rent units | $1,546 |
$2,362 |
| Median monthly housing costs | $1,356 |
$1,632 |
| Median price asked for vacant for-sale houses and condos | $355,671 |
$1,459,403 |
| Estimated median house or condo value | $297,300 |
$685,700 |
| Median numbers of rooms | 4.8 |
3.9 |
| Median number of rooms in apartments | 4 |
3.6 |
| Median number of rooms in houses and condos | 5.8 |
5.2 |
| Median house price - detached houses | $357,707 |
$878,380 |
| Median house price - in 2-unit structures | $345,352 |
$579,409 |
| Median house price - in 3-to-4-unit structures | $477,161 |
$841,459 |
| Median house price - in 5 or more unit structures | $439,589 |
$977,752 |
| Median house price - mobile homes | $472,017 |
$329,668 |
| Median house price - occupied boats, rvs, vans etc. | $235,959 |
Over $1,000,000 |
| Median house price - Townhouses or other attached units | $518,665 |
$989,845 |
| Median house price - All housing units | $388,874 |
$971,396 |
| Median house age | 70 |
70 |
| Renting percentage | 55.1% |
69% |
| Housing density (houses/condos per square mile) | 5,601.1 |
12,007 |
| House value disparities | 35.6% |
28.5% |
| Household income disparities | 48.4% |
48.8% |
| Median household income for houses/condes with a mortgage | $110,175 |
$120,618 |
| Median household income for apartments without a mortgage | $72,495 |
$81,926 |
| Housing units without a mortgage | 6,624 (1.9%) | 14,867 (2.4%) |
| Housing units with both a second mortgage and home equity loan | 17,661 (5.1%) | 43,914 (7.1%) |
| Housing units with a mortgage | 339,523 (98.1%) | 601,226 (97.6%) |
| Housing units with a home equity loan | 808 (0.2%) | 2,495 (0.4%) |
| Housing units with a second mortgage | 25,416 (7.3%) | 55,108 (8.9%) |
| House/condo owner moved in on average (years ago) | 12 |
15 |
| House/condo renter moved in on average (years ago) | 2 |
6 |
| Housing units lacking complete kitchen facilities | 2.5% |
1.3% |
| Housing units lacking complete plumbing facilities | 1.8% |
0.8% |
| Median real estate property taxes paid for housing units | ||
| Type | Chicago | New York |
|---|---|---|
| With mortgages | $4,913 (1.5%) | $5,798 (0.8%) |
| With no mortgages | $3,868 (1.5%) | $6,076 (0.9%) |
| Marital status | ||
| Type | Chicago | New York |
|---|---|---|
| Divorced | 7.7% |
8.4% |
| Never married | 48.2% |
42.9% |
| Now married | 37.6% |
40.6% |
| Separated | 2.1% |
2.8% |
| Widowed | 4.5% |
5.2% |
| Health (county statistics) | ||
| Type | Chicago | New York |
|---|---|---|
| General health status score of residents in this county from 1 (poor) to 5 (excellent) | 3.5 | 3.6 |
| Average weight of females (lbs) | 164.3 lbs | 150.1 lbs |
| Average weight of males (lbs) | 197.3 lbs | 180.1 lbs |
| Residents visited a dentist within the past year | 68% | 77.7% |
| Residents exercised in the past month | 73% | 79% |
| Adult residents drank alcohol in the past 30 days | 58.1% | 84% |
| Residents smoked 100+ cigarettes in their lives | 40.5% | 46.3% |
| People in group quarters | ||
| Type | Chicago | New York |
|---|---|---|
| Agriculture workers' dormitories on farms | 280 (0%) | 50 (0%) |
| College dormitories (includes college quarters off campus) | 15,887 (0.5%) | 37,861 (0.5%) |
| Crews of maritime vessels | 0 (0%) | 18 (0%) |
| Dormitories | 0 (0%) | 0 (0%) |
| Federal prisons and detention centers | 473 (0%) | 2,560 (0%) |
| Group homes | 0 (0%) | 0 (0%) |
| Halfway houses | 143 (0%) | 19 (0%) |
| Homes for abused, dependent, and neglected children | 168 (0%) | 109 (0%) |
| Homes for the mentally ill | 934 (0%) | 4,104 (0.1%) |
| Homes for the mentally retarded | 151 (0%) | 4,417 (0.1%) |
| Homes for the physically handicapped | 61 (0%) | 319 (0%) |
| Homes or halfway houses for drug/alcohol abuse | 1,674 (0.1%) | 4,801 (0.1%) |
| Hospices or homes for chronically ill | 0 (0%) | 418 (0%) |
| Hospitals or wards for drug/alcohol abuse | 364 (0%) | 1,736 (0%) |
| Hospitals/wards and hospices for chronically ill | 368 (0%) | 2,884 (0%) |
| Hospitals/wards, hospices, and schools for the handicapped | 0 (0%) | 0 (0%) |
| Institutions for the blind | 0 (0%) | 75 (0%) |
| Institutions for the deaf | 0 (0%) | 0 (0%) |
| Job corps and vocational training facilities | 17 (0%) | 579 (0%) |
| Juvenile institutions | 0 (0%) | 0 (0%) |
| Local jails and other confinement facilities (including police lockups) | 10,565 (0.4%) | 15,338 (0.2%) |
| Long-term care | 0 (0%) | 0 (0%) |
| Mental (psychiatric) hospitals or wards | 629 (0%) | 4,650 (0.1%) |
| Military hospitals or wards for chronically ill | 0 (0%) | 0 (0%) |
| Military transient quarters for temporary residents | 0 (0%) | 0 (0%) |
| Military barracks, etc. | 0 (0%) | 230 (0%) |
| Military disciplinary barracks | 0 (0%) | 0 (0%) |
| Military quarters | 0 (0%) | 0 (0%) |
| Military ships | 0 (0%) | 0 (0%) |
| Noninstitutionalized settings | 0 (0%) | 0 (0%) |
| Nursing homes | 13,839 (0.5%) | 42,480 (0.5%) |
| On base quarters | 0 (0%) | 0 (0%) |
| Orthopedic wards and institutions for the physically handicapped | 0 (0%) | 72 (0%) |
| Other group homes | 1,264 (0%) | 4,484 (0.1%) |
| Other hospitals or wards for chronically ill | 368 (0%) | 2,466 (0%) |
| Other nonhousehold living situations | 2,827 (0.1%) | 4,246 (0.1%) |
| Other noninstitutional group quarters | 6,632 (0.2%) | 38,850 (0.5%) |
| Other types of correctional institutions | 0 (0%) | 448 (0%) |
| Other workers' dormitories | 12 (0%) | 115 (0%) |
| Religious group quarters | 2,484 (0.1%) | 6,486 (0.1%) |
| Residential treatment centers for emotionally disturbed children | 41 (0%) | 91 (0%) |
| Schools, hospitals, or wards for the physically handicapped | 0 (0%) | 0 (0%) |
| Short-term care, detention or diagnostic centers for delinquent children | 13 (0%) | 52 (0%) |
| State prisons | 477 (0%) | 3,037 (0%) |
| Training schools for juvenile delinquents | 90 (0%) | 390 (0%) |
| Unknown juvenile institutions | 56 (0%) | 268 (0%) |
| Wards in general hospitals for patients who have no usual home elsewhere | 96 (0%) | 825 (0%) |
| Wards in military hospitals for patients who have no usual home elsewhere | 0 (0%) | 0 (0%) |
| English speakers (speaking English at home) | ||
| Type | Chicago | New York |
|---|---|---|
| Born in the United States residents | 90.1% |
87.9% |
| Foreign born residents | 12% |
24.2% |
| Native, born elsewhere residents | 27.7% |
26.2% |
| Total residents | 64.8% |
52.1% |
| Infrastructure | ||
| Type | Chicago | New York |
|---|---|---|
| Hospitals | 86 |
58 |
| TV stations | 22 |
29 |
| Arenas or stadiums | 7 |
5 |
| Bank branches located here | 740 |
487 |
| Bank institutions located here | 99 |
87 |
| Main business address for public companies | 110 |
395 |
| Drinking water stations with no reported violations in the past | 22 |
5 |
| Drinking water stations with reported violations in the past | 16 |
12 |
| School facilities | ||
| Type | Chicago | New York |
|---|---|---|
| Private elementary/middle schools | 183 |
77 |
| Private high schools | 69 |
52 |
| Public elementary/middle schools | 450 |
214 |
| Public high schools | 145 |
149 |
| Colleges/Universities | 90 |
97 |
| National Bridge Inventory | ||
| Type | Chicago | New York |
|---|---|---|
| Number of bridges | 1,288 |
2,992 |
| Total costs | $1,244,483,000 |
$41,847,025,000 |
| Total average daily traffic | 60,573,280 |
106,047,317 |
| Total average daily truck traffic | 3,993,040 |
3,057,321 |
| Length of all bridges | 22,356 feet | 68,862 feet |
| Government finances - Expenditure (per resident) | ||
| Type | Chicago | New York |
|---|---|---|
| Construction general public buildings | $321,000 ($0.12) | $280,622,000 ($33.14) |
| Current operations police protection | $1,595,816,000 ($591.80) | $5,897,995,000 ($696.54) |
| Current operations parks and recreation | $33,485,000 ($12.42) | $672,303,000 ($79.40) |
| Current operations regular highways | $331,546,000 ($122.95) | $304,243,000 ($35.93) |
| Current operations financial administration | $150,704,000 ($55.89) | $595,674,000 ($70.35) |
| Current operations housing and community development | $275,614,000 ($102.21) | $4,659,328,000 ($550.26) |
| Current operations judicial and legal services | $31,532,000 ($11.69) | $1,060,292,000 ($125.22) |
| Current operations central staff services | $53,752,000 ($19.93) | $302,702,000 ($35.75) |
| Current operations general public buildings | $239,849,000 ($88.95) | $187,494,000 ($22.14) |
| Current operations sewerage | $80,454,000 ($29.84) | $525,192,000 ($62.02) |
| Current operations solid waste management | $165,635,000 ($61.43) | $1,953,103,000 ($230.66) |
| Current operations general other | $1,149,640,000 ($426.34) | $10,728,842,000 ($1,267) |
| Current operations elementary and secondary education | $0 ($0) | $31,272,423,000 ($3,693) |
| Current operations higher education auxiliary enterprises | $0 ($0) | $10,935,000 ($1.29) |
| General interest on debt | $981,096,000 ($363.83) | $7,093,148,000 ($837.69) |
| Other capital outlay general other | $35,418,000 ($13.14) | $0 ($0) |
| Total salaries and wages | $0 ($0) | $12,976,048,000 ($1,532) |
| Government finances - Revenue (per resident) | ||
| Type | Chicago | New York |
|---|---|---|
| Charges parks and recreation | $14,602,000 ($5.42) | $71,722,000 ($8.47) |
| Charges sewerage | 351,076,000 (130.19) | 2,260,401,000 (266.95) |
| Charges solid waste management | $62,718,000 ($23.26) | $13,845,000 ($1.64) |
| Miscellaneous interest earnings | $221,115,000 ($82.00) | $1,287,458,000 ($152.05) |
| Miscellaneous rents | $33,259,000 ($12.33) | $50,356,000 ($5.95) |
| State intergovernmental highways | $140,294,000 ($52.03) | $209,880,000 ($24.79) |
| Tax property | $1,278,091,000 ($473.97) | $28,815,935,000 ($3,403) |
| Government finances - Cash and securities (per resident) | ||
| Type | Chicago | New York |
|---|---|---|
| Sinking funds cash and securities | $1,687,131,000 ($625.66) | $21,527,326,000 ($2,542) |
| Taxpayer migration | ||
| Type | Chicago | New York |
|---|---|---|
| Moved from other counties | 72,188 (3.5%) | 65,476 (9.4%) |
| Moved from other counties - average AGI | $82,405 |
$122,752 |
| Moved to other counties | 113,542 (5.4%) | 102,681 (13.9%) |
| Moved to other counties - average AGI | $120,340 |
$239,017 |
| Moved from foreign countries | 177 (0%) | 179 (0%) |
| Moved from foreign countries - average AGI | $114.47 |
$107.93 |
| Moved to foreign countries | 215 (0%) | 242 (0%) |
| Moved to foreign countries - average AGI | $140.43 |
$389.85 |