Fatal car crashes and road traffic accidents in Simi Valley, California
- Fatal car crash and road traffic accident statistics for 2021
- Fatal accident count5
- Vehicles involved in fatal accidents6
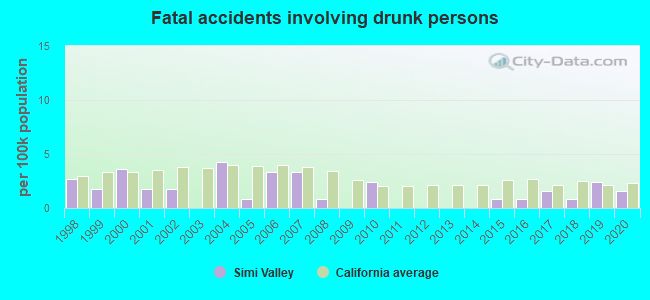
- Fatal accidents involving drunk persons0
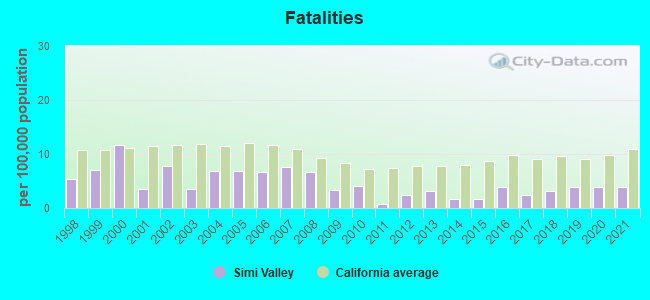
- Fatalities5
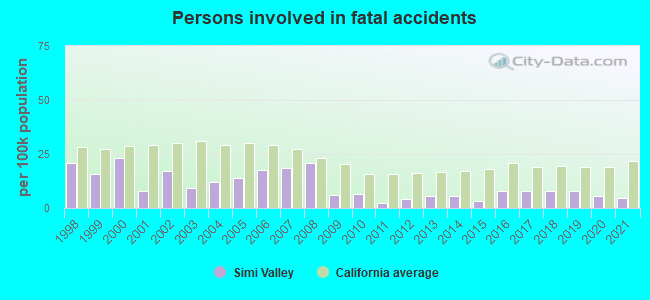
- Persons involved in fatal accidents6
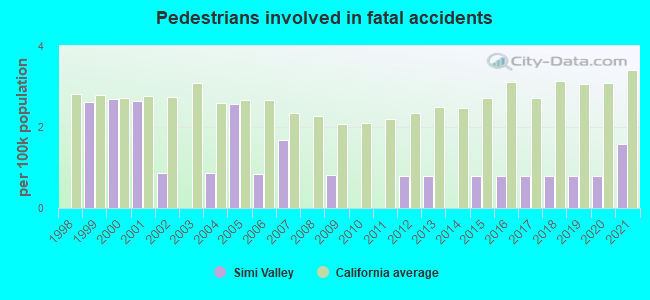
- Pedestrians involved in fatal accidents2
- Fatal car crash and road traffic accident statistics for 2020
- Fatal accident count5
- Vehicles involved in fatal accidents10
- Fatal accidents involving drunk persons2
- Fatalities5
- Persons involved in fatal accidents7
- Pedestrians involved in fatal accidents1
- Fatal car crash and road traffic accident statistics for 2019
- Fatal accident count3
- Vehicles involved in fatal accidents3
- Fatal accidents involving drunk persons3
- Fatalities5
- Persons involved in fatal accidents10
- Pedestrians involved in fatal accidents1
- Fatal car crash and road traffic accident statistics for 2018
- Fatal accident count4
- Vehicles involved in fatal accidents7
- Fatal accidents involving drunk persons1
- Fatalities4
- Persons involved in fatal accidents10
- Pedestrians involved in fatal accidents1
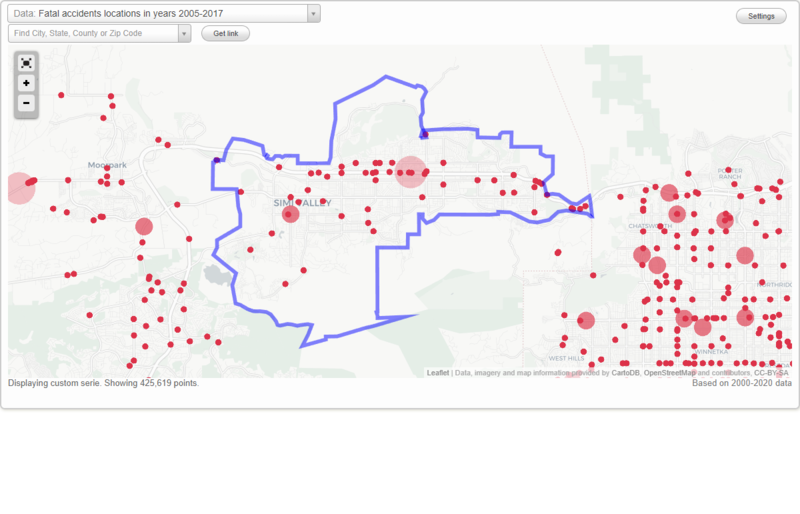
Data:
No street view available for this location
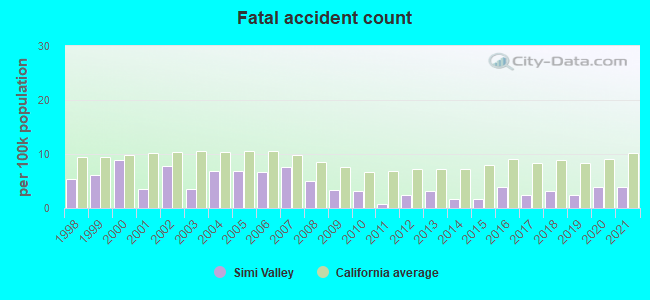
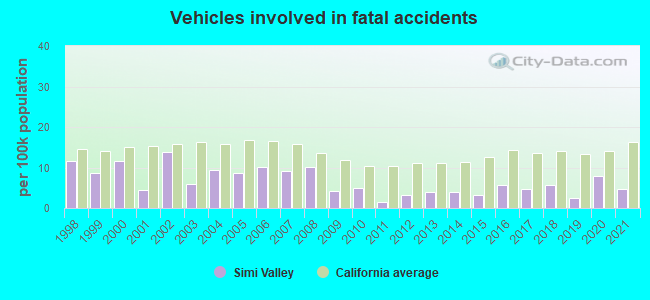
Simi Valley fatal accident statistics for 1998 - 2021
Average EMS response time
- Simi Valley(Based on 4 reports) 2.8 mins
- Ventura County(Based on 29 reports) 9.7 mins
- California(Based on 2,270 reports) 9.8 mins
Average hospital transport time
- Simi Valley(Based on 2 reports) 50.5 mins
- Ventura County(Based on 11 reports) 39.6 mins
- California(Based on 1,048 reports) 53.1 mins
Daylight
- Simi Valley(Based on 308 reports) 49.0%
- Ventura County(Based on 3,291 reports) 48.2%
- California(Based on 177,072 reports) 43.9%
Dark - Lighted
- Simi Valley(Based on 308 reports) 35.4%
- Ventura County(Based on 3,291 reports) 21.0%
- California(Based on 177,072 reports) 25.4%
Dark - Not Lighted
- Simi Valley(Based on 308 reports) 12.0%
- Ventura County(Based on 3,291 reports) 25.8%
- California(Based on 177,072 reports) 26.6%
Dusk
- Simi Valley(Based on 308 reports) 1.9%
- Ventura County(Based on 3,291 reports) 2.7%
- California(Based on 177,072 reports) 2.1%
Dawn
- Simi Valley(Based on 308 reports) 1.3%
- Ventura County(Based on 3,291 reports) 1.8%
- California(Based on 177,072 reports) 1.6%
Dark - Unknown Lighting
- Simi Valley(Based on 308 reports) 0.3%
- Ventura County(Based on 3,291 reports) 0.5%
- California(Based on 177,072 reports) 0.5%
Clear
- Simi Valley(Based on 308 reports) 93.2%
- Ventura County(Based on 3,296 reports) 92.0%
- California(Based on 177,248 reports) 91.0%
Rain
- Simi Valley(Based on 308 reports) 5.8%
- Ventura County(Based on 3,296 reports) 4.3%
- California(Based on 177,248 reports) 4.8%
Unknown
- Simi Valley(Based on 308 reports) 1.0%
- Ventura County(Based on 3,296 reports) 2.2%
- California(Based on 177,248 reports) 2.6%
Fog, Smog, Smoke
- Simi Valley(Based on 308 reports) 0.6%
- Ventura County(Based on 3,296 reports) 1.3%
- California(Based on 177,248 reports) 1.1%

Simi Valley fatal car crash and road traffic accident list for 2021
- Fatal accident count5
- Vehicles involved in fatal accidents6
- Fatalities5
- Persons involved in fatal accidents6
- Pedestrians involved in fatal accidents2
Dark - Lighted
- Simi Valley(Based on 5 reports) 60.0%
- Ventura County(Based on 51 reports) 13.7%
- California(Based on 3,972 reports) 31.4%
Daylight
- Simi Valley(Based on 5 reports) 40.0%
- Ventura County(Based on 51 reports) 47.1%
- California(Based on 3,972 reports) 36.7%
Clear
- Simi Valley(Based on 5 reports) 100.0%
- Ventura County(Based on 50 reports) 90.0%
- California(Based on 3,951 reports) 86.2%
Simi Valley fatal car crash and road traffic accident list for 2020
- Fatal accident count5
- Vehicles involved in fatal accidents10
- Fatal accidents involving drunk persons2
- Fatalities5
- Persons involved in fatal accidents7
- Pedestrians involved in fatal accidents1
Daylight
- Simi Valley(Based on 5 reports) 40.0%
- Ventura County(Based on 52 reports) 42.3%
- California(Based on 3,555 reports) 38.6%
Dark - Lighted
- Simi Valley(Based on 5 reports) 40.0%
- Ventura County(Based on 52 reports) 28.8%
- California(Based on 3,555 reports) 31.5%
Dark - Not Lighted
- Simi Valley(Based on 5 reports) 20.0%
- Ventura County(Based on 52 reports) 25.0%
- California(Based on 3,555 reports) 24.8%
Clear
- Simi Valley(Based on 5 reports) 100.0%
- Ventura County(Based on 52 reports) 90.4%
- California(Based on 3,547 reports) 87.8%
Simi Valley fatal car crash and road traffic accident list for 2019
Simi Valley fatal car crash and road traffic accident list for 2018
- Fatal accident count4
- Vehicles involved in fatal accidents7
- Fatal accidents involving drunk persons1
- Fatalities4
- Persons involved in fatal accidents10
- Pedestrians involved in fatal accidents1
Daylight
- Simi Valley(Based on 4 reports) 100.0%
- Ventura County(Based on 51 reports) 51.0%
- California(Based on 3,483 reports) 39.4%
Clear
- Simi Valley(Based on 4 reports) 100.0%
- Ventura County(Based on 51 reports) 84.3%
- California(Based on 3,478 reports) 85.0%
Simi Valley fatal car crash and road traffic accident list for 2017
Simi Valley fatal car crash and road traffic accident list for 2016
- Fatal accident count5
- Vehicles involved in fatal accidents7
- Fatal accidents involving drunk persons1
- Fatalities5
- Persons involved in fatal accidents10
- Pedestrians involved in fatal accidents1
Daylight
- Simi Valley(Based on 5 reports) 80.0%
- Ventura County(Based on 53 reports) 52.8%
- California(Based on 3,535 reports) 40.5%
Dark - Lighted
- Simi Valley(Based on 5 reports) 20.0%
- Ventura County(Based on 53 reports) 13.2%
- California(Based on 3,535 reports) 31.1%
Clear
- Simi Valley(Based on 5 reports) 80.0%
- Ventura County(Based on 53 reports) 79.2%
- California(Based on 3,533 reports) 82.3%
Rain
- Simi Valley(Based on 5 reports) 20.0%
- Ventura County(Based on 53 reports) 3.8%
- California(Based on 3,533 reports) 4.8%
Unknown
- Simi Valley(Based on 5 reports) 20.0%
- Ventura County(Based on 53 reports) 20.8%
- California(Based on 3,533 reports) 14.0%
Simi Valley fatal car crash and road traffic accident list for 2015
| # | Date | Location | Vehicles | Drunk persons | Fatalites | Persons | Pedestrians |
|---|
| 1 | Mar 2, 2015 05:05 AM | Sr-118 | 2 | - | 1
| 1 | 1 |
| 2 | Feb 9, 2015 07:18 PM | Tapo St | 2 | 1
| 1 | 3 | - |
Simi Valley fatal car crash and road traffic accident list for 2014
| # | Date | Location | Vehicles | Drunk persons | Fatalites | Persons | Pedestrians |
|---|
| 1 | Feb 28, 2014 10:15 AM | Sr-118 | 2 | - | 1
| 3 | - |
| 2 | Aug 22, 2014 05:00 PM | Sr-118 | 3 | - | 1
| 4 | - |
Simi Valley fatal car crash and road traffic accident list for 2013
- Fatal accident count4
- Vehicles involved in fatal accidents5
- Fatalities4
- Persons involved in fatal accidents7
- Pedestrians involved in fatal accidents1
Daylight
- Simi Valley(Based on 4 reports) 100.0%
- Ventura County(Based on 61 reports) 54.1%
- California(Based on 2,765 reports) 44.7%
Clear
- Simi Valley(Based on 4 reports) 100.0%
- Ventura County(Based on 61 reports) 90.2%
- California(Based on 2,760 reports) 88.1%
Simi Valley fatal car crash and road traffic accident list for 2012
Simi Valley fatal car crash and road traffic accident list for 2011
| # | Date | Location | Vehicles | Drunk persons | Fatalites | Persons | Pedestrians |
|---|
| 1 | Aug 31, 2011 07:44 PM | Cochran St, Stearns St | 2 | - | 1
| 3 | - |
Simi Valley fatal car crash and road traffic accident list for 2010
- Fatal accident count4
- Vehicles involved in fatal accidents6
- Fatal accidents involving drunk persons3
- Fatalities5
- Persons involved in fatal accidents8
Dark - Lighted
- Simi Valley(Based on 4 reports) 50.0%
- Ventura County(Based on 40 reports) 20.0%
- California(Based on 2,501 reports) 28.1%
Daylight
- Simi Valley(Based on 4 reports) 25.0%
- Ventura County(Based on 40 reports) 52.5%
- California(Based on 2,501 reports) 42.5%
Dark - Not Lighted
- Simi Valley(Based on 4 reports) 25.0%
- Ventura County(Based on 40 reports) 25.0%
- California(Based on 2,501 reports) 24.4%
Clear
- Simi Valley(Based on 4 reports) 100.0%
- Ventura County(Based on 40 reports) 72.5%
- California(Based on 2,495 reports) 77.2%
Simi Valley fatal car crash and road traffic accident list for 2009
- Fatal accident count4
- Vehicles involved in fatal accidents5
- Fatalities4
- Persons involved in fatal accidents7
- Pedestrians involved in fatal accidents1
Daylight
- Simi Valley(Based on 4 reports) 75.0%
- Ventura County(Based on 57 reports) 52.6%
- California(Based on 2,811 reports) 45.3%
Dark - Lighted
- Simi Valley(Based on 4 reports) 25.0%
- Ventura County(Based on 57 reports) 26.3%
- California(Based on 2,811 reports) 26.0%
Clear
- Simi Valley(Based on 4 reports) 100.0%
- Ventura County(Based on 57 reports) 94.7%
- California(Based on 2,816 reports) 94.7%
Simi Valley fatal car crash and road traffic accident list for 2008
- Fatal accident count6
- Vehicles involved in fatal accidents12
- Fatal accidents involving drunk persons1
- Fatalities8
- Persons involved in fatal accidents25
Daylight
- Simi Valley(Based on 6 reports) 83.3%
- Ventura County(Based on 65 reports) 56.9%
- California(Based on 3,141 reports) 45.7%
Dark - Not Lighted
- Simi Valley(Based on 6 reports) 16.7%
- Ventura County(Based on 65 reports) 20.0%
- California(Based on 3,141 reports) 25.2%
Clear
- Simi Valley(Based on 6 reports) 66.7%
- Ventura County(Based on 65 reports) 95.4%
- California(Based on 3,145 reports) 94.2%
Rain
- Simi Valley(Based on 6 reports) 33.3%
- Ventura County(Based on 65 reports) 4.6%
- California(Based on 3,145 reports) 4.7%
Simi Valley fatal car crash and road traffic accident list for 2007
- Fatal accident count9
- Vehicles involved in fatal accidents11
- Fatal accidents involving drunk persons4
- Fatalities9
- Persons involved in fatal accidents22
- Pedestrians involved in fatal accidents2
Daylight
- Simi Valley(Based on 9 reports) 55.6%
- Ventura County(Based on 71 reports) 47.9%
- California(Based on 3,574 reports) 46.4%
Dark - Lighted
- Simi Valley(Based on 9 reports) 33.3%
- Ventura County(Based on 71 reports) 23.9%
- California(Based on 3,574 reports) 25.2%
Dark - Not Lighted
- Simi Valley(Based on 9 reports) 11.1%
- Ventura County(Based on 71 reports) 22.5%
- California(Based on 3,574 reports) 24.2%
Clear
- Simi Valley(Based on 9 reports) 100.0%
- Ventura County(Based on 72 reports) 90.3%
- California(Based on 3,591 reports) 95.4%
| # | Date | Location | Vehicles | Drunk persons | Fatalites | Persons | Pedestrians |
|---|
| 1 | Jan 20, 2007 07:07 AM | Tapo Canyon Rd | 1 | - | 1
| 1 | - |
| 2 | Feb 18, 2007 02:47 AM | Sycamore Dr | 1 | 1
| 1 | 5 | - |
| 3 | Jul 13, 2007 07:33 AM | Mayfair St, Winthrop Ct | 2 | - | 1
| 2 | - |
| 4 | Jun 13, 2007 11:58 PM | Royal Ave, Erringer Rd | 1 | 1
| 1 | 3 | 1 |
| 5 | Sep 14, 2007 07:42 AM | Fitzgerald Rd, Talbert Ave | 1 | - | 1
| 2 | 1 |
| 6 | Jun 8, 2007 09:10 PM | Sr-118 | 1 | 1
| 1 | 1 | - |
| 7 | Dec 27, 2007 03:48 PM | Sr-118 | 2 | - | 1
| 6 | - |
| 8 | Jul 21, 2007 02:10 AM | Sr-118 | 1 | 1
| 1 | 1 | - |
| 9 | Dec 28, 2007 07:20 AM | Madera Rd, Vista Lago Dr | 1 | - | 1
| 1 | - |
Simi Valley fatal car crash and road traffic accident list for 2006
- Fatal accident count8
- Vehicles involved in fatal accidents12
- Fatal accidents involving drunk persons4
- Fatalities8
- Persons involved in fatal accidents21
- Pedestrians involved in fatal accidents1
Daylight
- Simi Valley(Based on 8 reports) 50.0%
- Ventura County(Based on 74 reports) 56.8%
- California(Based on 3,824 reports) 45.4%
Dark - Lighted
- Simi Valley(Based on 8 reports) 37.5%
- Ventura County(Based on 74 reports) 20.3%
- California(Based on 3,824 reports) 25.2%
Dark - Not Lighted
- Simi Valley(Based on 8 reports) 12.5%
- Ventura County(Based on 74 reports) 18.9%
- California(Based on 3,824 reports) 25.2%
Clear
- Simi Valley(Based on 8 reports) 75.0%
- Ventura County(Based on 74 reports) 91.9%
- California(Based on 3,839 reports) 93.9%
Rain
- Simi Valley(Based on 8 reports) 25.0%
- Ventura County(Based on 74 reports) 5.4%
- California(Based on 3,839 reports) 4.3%
| # | Date | Location | Vehicles | Drunk persons | Fatalites | Persons | Pedestrians |
|---|
| 1 | Feb 18, 2006 10:42 PM | Los Angeles Ave, Suede Ave | 2 | 2
| 1 | 3 | - |
| 2 | Apr 15, 2006 01:53 AM | Sr-118 | 1 | 1
| 1 | 1 | - |
| 3 | Apr 25, 2006 05:23 PM | Sr-118 | 1 | - | 1
| 1 | - |
| 4 | Jun 23, 2006 11:09 AM | Sycamore Ave, Alamo St | 2 | - | 1
| 3 | - |
| 5 | Oct 28, 2006 01:15 AM | Los Angeles Ave | 1 | 1
| 1 | 1 | - |
| 6 | Nov 9, 2006 12:13 AM | Alamo St | 1 | - | 1
| 3 | 1 |
| 7 | Dec 16, 2006 10:22 PM | Tierra Rejada Rd | 2 | - | 1
| 3 | - |
| 8 | Dec 16, 2006 10:07 AM | Alamo St, Tapo St | 2 | - | 1
| 6 | - |
Simi Valley fatal car crash and road traffic accident list for 2005
- Fatal accident count8
- Vehicles involved in fatal accidents10
- Fatal accidents involving drunk persons1
- Fatalities8
- Persons involved in fatal accidents16
- Pedestrians involved in fatal accidents3
Daylight
- Simi Valley(Based on 8 reports) 75.0%
- Ventura County(Based on 63 reports) 57.1%
- California(Based on 3,842 reports) 46.3%
Dark - Lighted
- Simi Valley(Based on 8 reports) 25.0%
- Ventura County(Based on 63 reports) 25.4%
- California(Based on 3,842 reports) 24.4%
Clear
- Simi Valley(Based on 8 reports) 100.0%
- Ventura County(Based on 63 reports) 90.5%
- California(Based on 3,849 reports) 92.3%
| # | Date | Location | Vehicles | Drunk persons | Fatalites | Persons | Pedestrians |
|---|
| 1 | Jan 19, 2005 00:05 AM | Sr-118 | 1 | 1
| 1 | 1 | - |
| 2 | Jun 16, 2005 09:13 AM | Patricia Ave | 1 | - | 1
| 2 | 1 |
| 3 | Aug 31, 2005 07:11 AM | Cochran St, Stow St | 1 | - | 1
| 2 | 1 |
| 4 | Aug 31, 2005 05:38 PM | Long Canyon Rd | 1 | - | 1
| 2 | 1 |
| 5 | Oct 16, 2005 01:29 AM | Los Angeles Ave | 1 | - | 1
| 2 | - |
| 6 | Jul 12, 2005 08:19 AM | Sr-118 | 2 | - | 1
| 3 | - |
| 7 | Sep 8, 2005 02:56 PM | Los Angeles Ave, Sinaloa Rd | 2 | - | 1
| 3 | - |
| 8 | Dec 28, 2005 02:37 PM | Sr-118 | 1 | - | 1
| 1 | - |
Simi Valley fatal car crash and road traffic accident list for 2004
- Fatal accident count8
- Vehicles involved in fatal accidents11
- Fatal accidents involving drunk persons5
- Fatalities8
- Persons involved in fatal accidents14
- Pedestrians involved in fatal accidents1
Dark - Lighted
- Simi Valley(Based on 8 reports) 62.5%
- Ventura County(Based on 66 reports) 19.7%
- California(Based on 3,720 reports) 23.6%
Daylight
- Simi Valley(Based on 8 reports) 25.0%
- Ventura County(Based on 66 reports) 53.0%
- California(Based on 3,720 reports) 47.3%
Dark - Not Lighted
- Simi Valley(Based on 8 reports) 12.5%
- Ventura County(Based on 66 reports) 22.7%
- California(Based on 3,720 reports) 24.7%
Clear
- Simi Valley(Based on 8 reports) 100.0%
- Ventura County(Based on 66 reports) 89.4%
- California(Based on 3,727 reports) 93.5%
| # | Date | Location | Vehicles | Drunk persons | Fatalites | Persons | Pedestrians |
|---|
| 1 | Jan 10, 2004 01:42 AM | Erringer Rd, Covington Ave | 1 | 1
| 1 | 1 | - |
| 2 | Apr 8, 2004 05:49 AM | Los Angeles Ave, Yosemite Ave | 1 | 1
| 1 | 2 | 1 |
| 3 | Jun 4, 2004 11:57 PM | N Marvel Ave | 1 | - | 1
| 2 | - |
| 4 | Jun 9, 2004 06:44 AM | Sr-118 | 3 | - | 1
| 3 | - |
| 5 | Jun 30, 2004 11:03 PM | Sr-118 | 1 | 1
| 1 | 1 | - |
| 6 | Aug 5, 2004 01:34 AM | Sycamore Dr | 2 | - | 1
| 2 | - |
| 7 | Aug 13, 2004 05:12 PM | Erringer Rd | 1 | 1
| 1 | 1 | - |
| 8 | Oct 23, 2004 00:10 AM | Sr-118 | 1 | 1
| 1 | 2 | - |
Simi Valley fatal car crash and road traffic accident list for 2003
- Fatal accident count4
- Vehicles involved in fatal accidents7
- Fatalities4
- Persons involved in fatal accidents11
Daylight
- Simi Valley(Based on 4 reports) 50.0%
- Ventura County(Based on 72 reports) 54.2%
- California(Based on 3,724 reports) 48.3%
Dark - Lighted
- Simi Valley(Based on 4 reports) 50.0%
- Ventura County(Based on 72 reports) 15.3%
- California(Based on 3,724 reports) 22.7%
Clear
- Simi Valley(Based on 4 reports) 100.0%
- Ventura County(Based on 72 reports) 94.4%
- California(Based on 3,731 reports) 93.3%
| # | Date | Location | Vehicles | Drunk persons | Fatalites | Persons | Pedestrians |
|---|
| 1 | Aug 21, 2003 10:06 PM | 1st St | 3 | - | 1
| 5 | - |
| 2 | Oct 5, 2003 08:36 AM | Woodranch Pky | 1 | - | 1
| 1 | - |
| 3 | Sep 29, 2003 12:35 AM | Sr-118 | 2 | - | 1
| 2 | - |
| 4 | Dec 28, 2003 09:51 PM | Sr-118 | 1 | - | 1
| 3 | - |
Simi Valley fatal car crash and road traffic accident list for 2002
- Fatal accident count9
- Vehicles involved in fatal accidents16
- Fatal accidents involving drunk persons2
- Fatalities9
- Persons involved in fatal accidents20
- Pedestrians involved in fatal accidents1
Daylight
- Simi Valley(Based on 9 reports) 55.6%
- Ventura County(Based on 62 reports) 43.5%
- California(Based on 3,640 reports) 46.9%
Dark - Lighted
- Simi Valley(Based on 9 reports) 33.3%
- Ventura County(Based on 62 reports) 25.8%
- California(Based on 3,640 reports) 22.7%
Dusk
- Simi Valley(Based on 9 reports) 11.1%
- Ventura County(Based on 62 reports) 6.5%
- California(Based on 3,640 reports) 2.6%
Clear
- Simi Valley(Based on 9 reports) 100.0%
- Ventura County(Based on 62 reports) 95.2%
- California(Based on 3,654 reports) 93.8%
| # | Date | Location | Vehicles | Drunk persons | Fatalites | Persons | Pedestrians |
|---|
| 1 | Mar 17, 2002 11:14 AM | Sr-118 | 1 | - | 1
| 2 | - |
| 2 | Jan 25, 2002 05:44 PM | West Los Angeles Ave | 2 | - | 1
| 2 | - |
| 3 | Jun 10, 2002 04:10 AM | Sr-118 | 1 | 1
| 1 | 1 | - |
| 4 | Apr 17, 2002 12:15 AM | Sr-118 | 3 | - | 1
| 4 | - |
| 5 | May 8, 2002 05:23 PM | Sycamore Dr | 3 | - | 1
| 3 | - |
| 6 | Aug 8, 2002 09:51 AM | Los Angeles Ave | 2 | - | 1
| 2 | - |
| 7 | Aug 6, 2002 02:01 PM | Royal Ave | 1 | - | 1
| 1 | - |
| 8 | Oct 10, 2002 08:13 PM | Fitzgerald Rd | 2 | 1
| 1 | 3 | - |
| 9 | Sep 9, 2002 05:10 AM | First St | 1 | - | 1
| 2 | 1 |
Simi Valley fatal car crash and road traffic accident list for 2001
- Fatal accident count4
- Vehicles involved in fatal accidents5
- Fatal accidents involving drunk persons2
- Fatalities4
- Persons involved in fatal accidents9
- Pedestrians involved in fatal accidents3
Daylight
- Simi Valley(Based on 4 reports) 50.0%
- Ventura County(Based on 65 reports) 56.9%
- California(Based on 3,532 reports) 48.8%
Dark - Not Lighted
- Simi Valley(Based on 4 reports) 25.0%
- Ventura County(Based on 65 reports) 18.5%
- California(Based on 3,532 reports) 24.3%
Dawn
- Simi Valley(Based on 4 reports) 25.0%
- Ventura County(Based on 65 reports) 1.5%
- California(Based on 3,532 reports) 2.2%
Clear
- Simi Valley(Based on 4 reports) 75.0%
- Ventura County(Based on 66 reports) 89.4%
- California(Based on 3,543 reports) 92.0%
Rain
- Simi Valley(Based on 4 reports) 25.0%
- Ventura County(Based on 66 reports) 9.1%
- California(Based on 3,543 reports) 6.0%
| # | Date | Location | Vehicles | Drunk persons | Fatalites | Persons | Pedestrians |
|---|
| 1 | Feb 1, 2001 02:36 PM | Galena Avenue | 1 | - | 1
| 2 | 1 |
| 2 | Apr 7, 2001 06:13 AM | Los Angeles Ave | 1 | 1
| 1 | 2 | 1 |
| 3 | Sep 27, 2001 08:56 AM | Los Angeles Ave | 2 | - | 1
| 2 | - |
| 4 | May 19, 2001 10:35 PM | Sr-118 | 1 | 1
| 1 | 3 | 1 |
Simi Valley fatal car crash and road traffic accident list for 2000
- Fatal accident count10
- Vehicles involved in fatal accidents13
- Fatal accidents involving drunk persons4
- Fatalities13
- Persons involved in fatal accidents26
- Pedestrians involved in fatal accidents3
Daylight
- Simi Valley(Based on 10 reports) 60.0%
- Ventura County(Based on 83 reports) 47.0%
- California(Based on 3,343 reports) 48.2%
Dark - Lighted
- Simi Valley(Based on 10 reports) 30.0%
- Ventura County(Based on 83 reports) 25.3%
- California(Based on 3,343 reports) 22.7%
Dark - Not Lighted
- Simi Valley(Based on 10 reports) 10.0%
- Ventura County(Based on 83 reports) 24.1%
- California(Based on 3,343 reports) 24.9%
Clear
- Simi Valley(Based on 10 reports) 100.0%
- Ventura County(Based on 83 reports) 92.8%
- California(Based on 3,348 reports) 93.2%
| # | Date | Location | Vehicles | Drunk persons | Fatalites | Persons | Pedestrians |
|---|
| 1 | May 2, 2000 07:20 AM | Sr-118 | 1 | - | 1
| 1 | - |
| 2 | Aug 18, 2000 06:35 PM | Sr-118 | 1 | - | 1
| 1 | - |
| 3 | May 27, 2000 07:32 PM | Los Angeles Ave | 1 | 1
| 1 | 3 | 2 |
| 4 | Jun 13, 2000 10:31 PM | Cochran St | 2 | 2
| 1 | 3 | - |
| 5 | Jul 1, 2000 08:00 PM | Morley St | 1 | 1
| 1 | 2 | 1 |
| 6 | Jul 11, 2000 12:24 AM | Royal Ave | 2 | - | 1
| 3 | - |
| 7 | Oct 20, 2000 09:30 PM | Sr-118 | 1 | - | 2
| 5 | - |
| 8 | Nov 22, 2000 06:45 AM | Santa Susana Pass Rd | 2 | - | 1
| 4 | - |
| 9 | Dec 15, 2000 02:23 AM | Los Angeles Ave | 1 | - | 2
| 2 | - |
| 10 | Dec 3, 2000 08:07 PM | Sr-118 | 1 | - | 2
| 2 | - |
Simi Valley fatal car crash and road traffic accident list for 1999
- Fatal accident count7
- Vehicles involved in fatal accidents10
- Fatal accidents involving drunk persons2
- Fatalities8
- Persons involved in fatal accidents18
- Pedestrians involved in fatal accidents3
Daylight
- Simi Valley(Based on 7 reports) 42.9%
- Ventura County(Based on 53 reports) 54.7%
- California(Based on 3,137 reports) 48.1%
Dark - Not Lighted
- Simi Valley(Based on 7 reports) 42.9%
- Ventura County(Based on 53 reports) 24.5%
- California(Based on 3,137 reports) 25.2%
Dark - Lighted
- Simi Valley(Based on 7 reports) 14.3%
- Ventura County(Based on 53 reports) 18.9%
- California(Based on 3,137 reports) 22.8%
Clear
- Simi Valley(Based on 7 reports) 100.0%
- Ventura County(Based on 53 reports) 98.1%
- California(Based on 3,148 reports) 93.8%
| # | Date | Location | Vehicles | Drunk persons | Fatalites | Persons | Pedestrians |
|---|
| 1 | Jan 22, 1999 11:35 PM | Sr-118 | 1 | 1
| 1 | 2 | 1 |
| 2 | Feb 3, 1999 06:15 PM | Sr-118 | 1 | - | 1
| 3 | 1 |
| 3 | Mar 23, 1999 05:35 PM | Sr-118 | 1 | - | 1
| 1 | - |
| 4 | Jun 17, 1999 05:11 PM | Tierra Rejada Rd | 2 | 1
| 1 | 3 | 1 |
| 5 | Sep 25, 1999 09:05 PM | Sr-118 | 1 | - | 2
| 2 | - |
| 6 | Oct 21, 1999 10:06 PM | Madera Rd | 2 | - | 1
| 4 | - |
| 7 | Nov 24, 1999 07:04 AM | Erringer St | 2 | - | 1
| 3 | - |
Simi Valley fatal car crash and road traffic accident list for 1998
- Fatal accident count6
- Vehicles involved in fatal accidents13
- Fatal accidents involving drunk persons3
- Fatalities6
- Persons involved in fatal accidents23
Daylight
- Simi Valley(Based on 6 reports) 50.0%
- Ventura County(Based on 56 reports) 53.6%
- California(Based on 3,110 reports) 49.0%
Dark - Lighted
- Simi Valley(Based on 6 reports) 33.3%
- Ventura County(Based on 56 reports) 23.2%
- California(Based on 3,110 reports) 22.2%
Dusk
- Simi Valley(Based on 6 reports) 16.7%
- Ventura County(Based on 56 reports) 3.6%
- California(Based on 3,110 reports) 2.5%
Clear
- Simi Valley(Based on 6 reports) 100.0%
- Ventura County(Based on 56 reports) 94.6%
- California(Based on 3,112 reports) 89.7%
| # | Date | Location | Vehicles | Drunk persons | Fatalites | Persons | Pedestrians |
|---|
| 1 | Apr 22, 1998 07:15 AM | Sr-118 | 4 | - | 1
| 4 | - |
| 2 | Aug 23, 1998 02:33 AM | Cochran St | 1 | 1
| 1 | 1 | - |
| 3 | Sep 18, 1998 09:11 AM | Sr-118 | 1 | - | 1
| 1 | - |
| 4 | Oct 13, 1998 11:48 AM | Royal Avenue | 2 | - | 1
| 2 | - |
| 5 | Oct 16, 1998 10:13 PM | Los Angeles Avenue | 2 | 1
| 1 | 2 | - |
| 6 | Dec 21, 1998 04:15 PM | Sr-118 | 3 | 1
| 1 | 13 | - |
Simi Valley fatal car crash and road traffic accident list for 1997
- Fatal accident count6
- Vehicles involved in fatal accidents13
- Fatal accidents involving drunk persons1
- Fatalities6
- Persons involved in fatal accidents17
Daylight
- Simi Valley(Based on 6 reports) 100.0%
- Ventura County(Based on 58 reports) 62.1%
- California(Based on 3,271 reports) 49.1%
Clear
- Simi Valley(Based on 6 reports) 100.0%
- Ventura County(Based on 58 reports) 96.6%
- California(Based on 3,279 reports) 93.8%
| # | Date | Location | Vehicles | Drunk persons | Fatalites | Persons | Pedestrians |
|---|
| 1 | Feb 4, 1997 10:44 AM | Losangeles | 2 | - | 1
| 3 | - |
| 2 | Jun 1, 1997 05:20 PM | Kuehner Dr | 2 | 1
| 1 | 5 | - |
| 3 | Jun 20, 1997 06:54 PM | Walnut St | 2 | - | 1
| 2 | - |
| 4 | Jul 19, 1997 03:50 PM | Losangeles | 2 | - | 1
| 2 | - |
| 5 | Sep 29, 1997 06:33 PM | Alamo St | 2 | - | 1
| 2 | - |
| 6 | Oct 29, 1997 07:25 AM | 118 | 3 | - | 1
| 3 | - |
Simi Valley fatal car crash and road traffic accident list for 1996
- Fatal accident count4
- Vehicles involved in fatal accidents8
- Fatal accidents involving drunk persons3
- Fatalities4
- Persons involved in fatal accidents11
Dark - Lighted
- Simi Valley(Based on 4 reports) 75.0%
- Ventura County(Based on 63 reports) 25.4%
- California(Based on 3,568 reports) 23.8%
Daylight
- Simi Valley(Based on 4 reports) 25.0%
- Ventura County(Based on 63 reports) 49.2%
- California(Based on 3,568 reports) 46.5%
Clear
- Simi Valley(Based on 4 reports) 100.0%
- Ventura County(Based on 63 reports) 92.1%
- California(Based on 3,576 reports) 91.7%
| # | Date | Location | Vehicles | Drunk persons | Fatalites | Persons | Pedestrians |
|---|
| 1 | Jan 29, 1996 04:47 AM | Bonia Dr | 1 | 1
| 1 | 2 | - |
| 2 | Sep 14, 1996 09:30 PM | Losangeles | 2 | 2
| 1 | 3 | - |
| 3 | Nov 13, 1996 09:48 PM | Losangeles | 2 | - | 1
| 2 | - |
| 4 | Nov 22, 1996 10:10 AM | 118 | 3 | - | 1
| 4 | - |
Simi Valley fatal car crash and road traffic accident list for 1995
- Fatal accident count10
- Vehicles involved in fatal accidents12
- Fatal accidents involving drunk persons4
- Fatalities10
- Persons involved in fatal accidents17
- Pedestrians involved in fatal accidents3
Dark - Lighted
- Simi Valley(Based on 10 reports) 40.0%
- Ventura County(Based on 75 reports) 16.0%
- California(Based on 3,669 reports) 22.9%
Daylight
- Simi Valley(Based on 10 reports) 30.0%
- Ventura County(Based on 75 reports) 48.0%
- California(Based on 3,669 reports) 46.7%
Dark - Not Lighted
- Simi Valley(Based on 10 reports) 30.0%
- Ventura County(Based on 75 reports) 30.7%
- California(Based on 3,669 reports) 26.2%
Clear
- Simi Valley(Based on 10 reports) 90.0%
- Ventura County(Based on 75 reports) 96.0%
- California(Based on 3,669 reports) 91.0%
Rain
- Simi Valley(Based on 10 reports) 10.0%
- Ventura County(Based on 75 reports) 4.0%
- California(Based on 3,669 reports) 7.0%
| # | Date | Location | Vehicles | Drunk persons | Fatalites | Persons | Pedestrians |
|---|
| 1 | Jan 13, 1995 07:14 PM | Alamo St | 2 | - | 1
| 3 | 1 |
| 2 | Jan 23, 1995 07:07 PM | Losangeles | 1 | - | 1
| 2 | 1 |
| 3 | Feb 26, 1995 06:28 PM | Melia St | 1 | - | 1
| 1 | - |
| 4 | Feb 4, 1995 06:09 PM | Madera Rd | 1 | 1
| 1 | 1 | - |
| 5 | Mar 26, 1995 03:52 PM | Cntryclbrd | 1 | - | 1
| 1 | - |
| 6 | May 29, 1995 01:20 AM | 118 | 1 | - | 1
| 2 | - |
| 7 | May 5, 1995 05:06 PM | Erringerrd | 1 | - | 1
| 2 | 1 |
| 8 | Dec 15, 1995 11:41 PM | Tapocyn Rd | 2 | 1
| 1 | 3 | - |
| 9 | Dec 28, 1995 06:39 PM | 118 | 1 | 1
| 1 | 1 | - |
| 10 | Dec 29, 1995 05:24 PM | Espring St | 1 | 1
| 1 | 1 | - |
Simi Valley fatal car crash and road traffic accident list for 1994
- Fatal accident count5
- Vehicles involved in fatal accidents9
- Fatal accidents involving drunk persons3
- Fatalities6
- Persons involved in fatal accidents17
- Pedestrians involved in fatal accidents2
Dark - Lighted
- Simi Valley(Based on 5 reports) 60.0%
- Ventura County(Based on 77 reports) 14.3%
- California(Based on 3,784 reports) 23.3%
Daylight
- Simi Valley(Based on 5 reports) 20.0%
- Ventura County(Based on 77 reports) 59.7%
- California(Based on 3,784 reports) 48.6%
Dusk
- Simi Valley(Based on 5 reports) 20.0%
- Ventura County(Based on 77 reports) 2.6%
- California(Based on 3,784 reports) 2.4%
Clear
- Simi Valley(Based on 5 reports) 100.0%
- Ventura County(Based on 77 reports) 93.5%
- California(Based on 3,787 reports) 93.1%
| # | Date | Location | Vehicles | Drunk persons | Fatalites | Persons | Pedestrians |
|---|
| 1 | Feb 1, 1994 05:38 PM | Cochran St | 2 | - | 1
| 4 | - |
| 2 | Apr 15, 1994 10:20 PM | Whitsombav | 1 | 1
| 1 | 2 | 1 |
| 3 | May 3, 1994 08:44 PM | Losangeles | 2 | 1
| 1 | 3 | - |
| 4 | Jun 29, 1994 03:47 PM | Madera Rd | 3 | 1
| 2 | 5 | - |
| 5 | Nov 15, 1994 05:04 PM | Losangeles | 1 | - | 1
| 3 | 1 |
Simi Valley fatal car crash and road traffic accident list for 1993
- Fatal accident count7
- Vehicles involved in fatal accidents9
- Fatal accidents involving drunk persons5
- Fatalities7
- Persons involved in fatal accidents12
Daylight
- Simi Valley(Based on 7 reports) 57.1%
- Ventura County(Based on 62 reports) 46.8%
- California(Based on 3,682 reports) 46.1%
Dark - Lighted
- Simi Valley(Based on 7 reports) 42.9%
- Ventura County(Based on 62 reports) 27.4%
- California(Based on 3,682 reports) 24.0%
Clear
- Simi Valley(Based on 7 reports) 100.0%
- Ventura County(Based on 63 reports) 95.2%
- California(Based on 3,687 reports) 93.4%
| # | Date | Location | Vehicles | Drunk persons | Fatalites | Persons | Pedestrians |
|---|
| 1 | Mar 18, 1993 01:03 PM | Lysanderav | 2 | - | 1
| 2 | - |
| 2 | Mar 7, 1993 10:29 PM | Losangeles | 1 | 1
| 1 | 2 | - |
| 3 | Apr 28, 1993 01:30 PM | 118 | 1 | 1
| 1 | 1 | - |
| 4 | Jun 10, 1993 11:17 PM | Walnut St | 2 | - | 1
| 3 | - |
| 5 | Jun 28, 1993 07:47 PM | First St | 1 | 1
| 1 | 1 | - |
| 6 | Aug 8, 1993 06:12 PM | Kuehner Dr | 1 | 1
| 1 | 1 | - |
| 7 | Dec 28, 1993 09:41 PM | Royal Ave | 1 | 1
| 1 | 2 | - |
Simi Valley fatal car crash and road traffic accident list for 1992
- Fatal accident count4
- Vehicles involved in fatal accidents9
- Fatal accidents involving drunk persons3
- Fatalities4
- Persons involved in fatal accidents18
Dark - Lighted
- Simi Valley(Based on 4 reports) 75.0%
- Ventura County(Based on 70 reports) 22.9%
- California(Based on 3,717 reports) 25.2%
Dark - Not Lighted
- Simi Valley(Based on 4 reports) 25.0%
- Ventura County(Based on 70 reports) 24.3%
- California(Based on 3,717 reports) 25.6%
Clear
- Simi Valley(Based on 4 reports) 100.0%
- Ventura County(Based on 70 reports) 94.3%
- California(Based on 3,722 reports) 92.3%
| # | Date | Location | Vehicles | Drunk persons | Fatalites | Persons | Pedestrians |
|---|
| 1 | Aug 9, 1992 01:53 AM | Losangeles | 1 | 1
| 1 | 1 | - |
| 2 | Aug 23, 1992 02:00 AM | 118 | 1 | 1
| 1 | 6 | - |
| 3 | Sep 20, 1992 00:20 AM | Losangeles | 2 | 1
| 1 | 3 | - |
| 4 | Nov 12, 1992 05:29 PM | 118 | 5 | - | 1
| 8 | - |
Simi Valley fatal car crash and road traffic accident list for 1991
- Fatal accident count5
- Vehicles involved in fatal accidents7
- Fatal accidents involving drunk persons1
- Fatalities5
- Persons involved in fatal accidents14
- Pedestrians involved in fatal accidents3
Daylight
- Simi Valley(Based on 5 reports) 40.0%
- Ventura County(Based on 63 reports) 42.9%
- California(Based on 4,189 reports) 45.2%
Dark - Lighted
- Simi Valley(Based on 5 reports) 40.0%
- Ventura County(Based on 63 reports) 25.4%
- California(Based on 4,189 reports) 25.1%
Dark - Not Lighted
- Simi Valley(Based on 5 reports) 20.0%
- Ventura County(Based on 63 reports) 28.6%
- California(Based on 4,189 reports) 25.8%
Clear
- Simi Valley(Based on 5 reports) 80.0%
- Ventura County(Based on 63 reports) 92.1%
- California(Based on 4,194 reports) 93.7%
Rain
- Simi Valley(Based on 5 reports) 20.0%
- Ventura County(Based on 63 reports) 3.2%
- California(Based on 4,194 reports) 4.2%
| # | Date | Location | Vehicles | Drunk persons | Fatalites | Persons | Pedestrians |
|---|
| 1 | Feb 27, 1991 09:55 PM | 118 | 1 | - | 1
| 2 | 1 |
| 2 | Mar 28, 1991 04:11 PM | Tirarejada | 2 | - | 1
| 6 | - |
| 3 | Jul 19, 1991 10:05 PM | First St | 1 | - | 1
| 1 | - |
| 4 | Jul 30, 1991 03:01 PM | Maderaroad | 2 | 1
| 1 | 2 | - |
| 5 | Nov 11, 1991 06:42 PM | Cochran St | 1 | - | 1
| 3 | 2 |
Simi Valley fatal car crash and road traffic accident list for 1990
- Fatal accident count9
- Vehicles involved in fatal accidents14
- Fatal accidents involving drunk persons3
- Fatalities9
- Persons involved in fatal accidents22
Daylight
- Simi Valley(Based on 9 reports) 44.4%
- Ventura County(Based on 79 reports) 53.2%
- California(Based on 4,679 reports) 44.7%
Dark - Lighted
- Simi Valley(Based on 9 reports) 33.3%
- Ventura County(Based on 79 reports) 16.5%
- California(Based on 4,679 reports) 25.0%
Dark - Not Lighted
- Simi Valley(Based on 9 reports) 11.1%
- Ventura County(Based on 79 reports) 26.6%
- California(Based on 4,679 reports) 26.6%
Dusk
- Simi Valley(Based on 9 reports) 11.1%
- Ventura County(Based on 79 reports) 1.3%
- California(Based on 4,679 reports) 2.0%
Clear
- Simi Valley(Based on 9 reports) 100.0%
- Ventura County(Based on 79 reports) 98.7%
- California(Based on 4,685 reports) 95.4%
| # | Date | Location | Vehicles | Drunk persons | Fatalites | Persons | Pedestrians |
|---|
| 1 | Feb 9, 1990 03:39 PM | Kuehnerave | 2 | 1
| 1 | 2 | - |
| 2 | Jun 14, 1990 12:50 AM | 118 | 3 | - | 1
| 7 | - |
| 3 | Jul 1, 1990 02:45 AM | 118 | 1 | - | 1
| 1 | - |
| 4 | Aug 12, 1990 01:14 AM | Hempstead | 1 | 1
| 1 | 2 | - |
| 5 | Sep 15, 1990 06:05 PM | Royal Ave | 1 | - | 1
| 2 | - |
| 6 | Sep 18, 1990 05:47 PM | Royal Ave | 2 | - | 1
| 2 | - |
| 7 | Nov 11, 1990 08:57 PM | Royal St | 1 | - | 1
| 2 | - |
| 8 | Dec 15, 1990 01:24 AM | Terorejada | 1 | 1
| 1 | 1 | - |
| 9 | Dec 19, 1990 05:00 PM | Maderaroad | 2 | - | 1
| 3 | - |
Simi Valley fatal car crash and road traffic accident list for 1989
- Fatal accident count14
- Vehicles involved in fatal accidents21
- Fatal accidents involving drunk persons4
- Fatalities15
- Persons involved in fatal accidents41
Daylight
- Simi Valley(Based on 14 reports) 57.1%
- Ventura County(Based on 95 reports) 46.3%
- California(Based on 4,869 reports) 43.8%
Dark - Lighted
- Simi Valley(Based on 14 reports) 42.9%
- Ventura County(Based on 95 reports) 27.4%
- California(Based on 4,869 reports) 22.2%
Clear
- Simi Valley(Based on 14 reports) 100.0%
- Ventura County(Based on 95 reports) 91.6%
- California(Based on 4,877 reports) 94.5%
| # | Date | Location | Vehicles | Drunk persons | Fatalites | Persons | Pedestrians |
|---|
| 1 | Jan 27, 1989 12:09 AM | Fitzgerald | 2 | - | 1
| 3 | - |
| 2 | Mar 11, 1989 08:13 PM | Cochran St | 1 | 1
| 1 | 2 | - |
| 3 | Mar 18, 1989 11:38 PM | 1st Street | 1 | 1
| 1 | 2 | - |
| 4 | Jan 27, 1989 10:51 PM | Fitzgerald | 1 | - | 1
| 5 | - |
| 5 | Apr 20, 1989 04:15 PM | Losangeles | 1 | - | 1
| 2 | - |
| 6 | Apr 6, 1989 09:59 AM | Tapocanyon | 1 | - | 1
| 2 | - |
| 7 | Mar 28, 1989 04:08 PM | Erringerrd | 1 | - | 1
| 2 | - |
| 8 | Jun 21, 1989 07:56 AM | Sycamoredr | 2 | - | 1
| 3 | - |
| 9 | Jul 5, 1989 04:20 PM | Sequoiaave | 1 | 1
| 1 | 1 | - |
| 10 | Jul 30, 1989 03:33 AM | Royal St | 2 | 1
| 1 | 3 | - |
| 11 | Nov 1, 1989 07:18 PM | Yosemiteav | 1 | - | 1
| 2 | - |
| 12 | Nov 24, 1989 03:13 PM | 118 | 5 | - | 2
| 12 | - |
| 13 | Dec 9, 1989 02:45 PM | 118 | 1 | - | 1
| 1 | - |
| 14 | Nov 30, 1989 05:44 PM | Fitzgerald | 1 | - | 1
| 1 | - |
Simi Valley fatal car crash and road traffic accident list for 1988
- Fatal accident count7
- Vehicles involved in fatal accidents8
- Fatal accidents involving drunk persons4
- Fatalities9
- Persons involved in fatal accidents15
Dark - Not Lighted
- Simi Valley(Based on 7 reports) 42.9%
- Ventura County(Based on 83 reports) 36.1%
- California(Based on 4,868 reports) 28.0%
Dark - Lighted
- Simi Valley(Based on 7 reports) 42.9%
- Ventura County(Based on 83 reports) 21.7%
- California(Based on 4,868 reports) 24.1%
Daylight
- Simi Valley(Based on 7 reports) 14.3%
- Ventura County(Based on 83 reports) 37.3%
- California(Based on 4,868 reports) 43.7%
Clear
- Simi Valley(Based on 7 reports) 100.0%
- Ventura County(Based on 84 reports) 95.2%
- California(Based on 4,875 reports) 94.0%
| # | Date | Location | Vehicles | Drunk persons | Fatalites | Persons | Pedestrians |
|---|
| 1 | Mar 12, 1988 10:25 PM | 118 | 1 | 1
| 3 | 5 | - |
| 2 | Aug 8, 1988 10:34 PM | Alamo St | 2 | 1
| 1 | 2 | - |
| 3 | Aug 13, 1988 87:99 PM | 118 | 1 | 1
| 1 | 1 | - |
| 4 | Aug 30, 1988 09:13 PM | Tapostreet | 1 | - | 1
| 2 | - |
| 5 | Jul 2, 1988 03:25 AM | Lysanderav | 1 | 1
| 1 | 1 | - |
| 6 | Nov 9, 1988 08:00 AM | 118 | 1 | - | 1
| 1 | - |
| 7 | Dec 11, 1988 03:26 AM | Royal Ave | 1 | - | 1
| 3 | - |
Simi Valley fatal car crash and road traffic accident list for 1987
- Fatal accident count10
- Vehicles involved in fatal accidents15
- Fatal accidents involving drunk persons5
- Fatalities11
- Persons involved in fatal accidents25
Dark - Lighted
- Simi Valley(Based on 10 reports) 50.0%
- Ventura County(Based on 90 reports) 18.9%
- California(Based on 4,923 reports) 23.5%
Dark - Not Lighted
- Simi Valley(Based on 10 reports) 40.0%
- Ventura County(Based on 90 reports) 33.3%
- California(Based on 4,923 reports) 28.9%
Daylight
- Simi Valley(Based on 10 reports) 10.0%
- Ventura County(Based on 90 reports) 45.6%
- California(Based on 4,923 reports) 43.9%
Clear
- Simi Valley(Based on 10 reports) 90.0%
- Ventura County(Based on 90 reports) 95.6%
- California(Based on 4,935 reports) 93.0%
Rain
- Simi Valley(Based on 10 reports) 10.0%
- Ventura County(Based on 90 reports) 3.3%
- California(Based on 4,935 reports) 5.3%
| # | Date | Location | Vehicles | Drunk persons | Fatalites | Persons | Pedestrians |
|---|
| 1 | Feb 7, 1987 09:27 PM | Losangeles | 2 | 1
| 1 | 5 | - |
| 2 | Jan 17, 1987 06:36 PM | Erringerrd | 2 | 1
| 1 | 3 | - |
| 3 | Apr 1, 1987 87:99 PM | 118 | 1 | 1
| 1 | 1 | - |
| 4 | May 4, 1987 00:10 AM | 118 | 1 | 1
| 1 | 1 | - |
| 5 | Jun 26, 1987 10:46 PM | Second St | 1 | 1
| 1 | 1 | - |
| 6 | Aug 19, 1987 05:13 PM | Cochran St | 1 | - | 1
| 2 | - |
| 7 | Sep 10, 1987 05:30 AM | 118 | 2 | - | 2
| 5 | - |
| 8 | Nov 4, 1987 07:21 PM | 118 | 1 | - | 1
| 2 | - |
| 9 | Oct 30, 1987 05:40 PM | Alamo St | 3 | - | 1
| 3 | - |
| 10 | Dec 7, 1987 06:38 PM | Maderaroad | 1 | - | 1
| 2 | - |
Simi Valley fatal car crash and road traffic accident list for 1986
- Fatal accident count4
- Vehicles involved in fatal accidents5
- Fatal accidents involving drunk persons2
- Fatalities6
- Persons involved in fatal accidents12
Daylight
- Simi Valley(Based on 4 reports) 50.0%
- Ventura County(Based on 101 reports) 42.6%
- California(Based on 4,674 reports) 44.7%
Dark - Lighted
- Simi Valley(Based on 4 reports) 50.0%
- Ventura County(Based on 101 reports) 16.8%
- California(Based on 4,674 reports) 23.4%
Clear
- Simi Valley(Based on 4 reports) 100.0%
- Ventura County(Based on 101 reports) 90.1%
- California(Based on 4,683 reports) 93.3%
| # | Date | Location | Vehicles | Drunk persons | Fatalites | Persons | Pedestrians |
|---|
| 1 | Feb 17, 1986 10:07 PM | Losangeles | 1 | 1
| 1 | 2 | - |
| 2 | Jan 201986 03:50 PM | | 1 | - | 1
| 2 | - |
| 3 | May 29, 1986 02:55 AM | Cochran St | 1 | 1
| 1 | 1 | - |
| 4 | Sep 11, 1986 02:59 PM | First St | 2 | - | 3
| 7 | - |
Simi Valley fatal car crash and road traffic accident list for 1985
- Fatal accident count7
- Vehicles involved in fatal accidents12
- Fatal accidents involving drunk persons1
- Fatalities8
- Persons involved in fatal accidents21
Daylight
- Simi Valley(Based on 7 reports) 42.9%
- Ventura County(Based on 92 reports) 52.2%
- California(Based on 4,436 reports) 44.6%
Dark - Lighted
- Simi Valley(Based on 7 reports) 28.6%
- Ventura County(Based on 92 reports) 17.4%
- California(Based on 4,436 reports) 24.5%
Dark - Not Lighted
- Simi Valley(Based on 7 reports) 14.3%
- Ventura County(Based on 92 reports) 28.3%
- California(Based on 4,436 reports) 26.8%
Dusk
- Simi Valley(Based on 7 reports) 14.3%
- Ventura County(Based on 92 reports) 2.2%
- California(Based on 4,436 reports) 2.4%
Clear
- Simi Valley(Based on 7 reports) 85.7%
- Ventura County(Based on 92 reports) 92.4%
- California(Based on 4,447 reports) 92.9%
Fog, Smog, Smoke
- Simi Valley(Based on 7 reports) 14.3%
- Ventura County(Based on 92 reports) 3.3%
- California(Based on 4,447 reports) 2.7%
| # | Date | Location | Vehicles | Drunk persons | Fatalites | Persons | Pedestrians |
|---|
| 1 | Feb 21, 1985 09:07 PM | Royalave | 1 | - | 1
| 3 | - |
| 2 | Jun 17, 1985 05:50 PM | Losanglsav | 2 | - | 1
| 2 | - |
| 3 | Jun 18, 1985 09:43 PM | Alamo St | 2 | - | 1
| 3 | - |
| 4 | Jul 1, 1985 04:32 PM | Erringerrd | 3 | - | 1
| 4 | - |
| 5 | Aug 9, 1985 06:48 AM | Losanglsrd | 1 | 1
| 2 | 2 | - |
| 6 | Sep 3, 1985 12:50 AM | Longbranch | 1 | - | 1
| 5 | - |
| 7 | Nov 1, 1985 04:58 PM | Royal Ave | 2 | - | 1
| 2 | - |
Simi Valley fatal car crash and road traffic accident list for 1984
- Fatal accident count8
- Vehicles involved in fatal accidents11
- Fatal accidents involving drunk persons4
- Fatalities9
- Persons involved in fatal accidents20
Dark - Lighted
- Simi Valley(Based on 8 reports) 50.0%
- Ventura County(Based on 89 reports) 15.7%
- California(Based on 4,504 reports) 24.2%
Daylight
- Simi Valley(Based on 8 reports) 37.5%
- Ventura County(Based on 89 reports) 38.2%
- California(Based on 4,504 reports) 43.0%
Dawn
- Simi Valley(Based on 8 reports) 12.5%
- Ventura County(Based on 89 reports) 2.2%
- California(Based on 4,504 reports) 1.1%
Clear
- Simi Valley(Based on 8 reports) 100.0%
- Ventura County(Based on 89 reports) 98.9%
- California(Based on 4,517 reports) 93.9%
| # | Date | Location | Vehicles | Drunk persons | Fatalites | Persons | Pedestrians |
|---|
| 1 | Jan 22, 1984 02:30 AM | Losanglsav | 1 | 1
| 1 | 1 | - |
| 2 | Apr 11984 04:50 AM | | 1 | 1
| 1 | 1 | - |
| 3 | May 1, 1984 07:34 PM | Fitzgerald | 2 | 1
| 1 | 3 | - |
| 4 | Jun 21, 1984 07:37 AM | Losanglsav | 2 | - | 1
| 4 | - |
| 5 | Aug 25, 1984 01:11 PM | Losanglsav | 1 | 1
| 2 | 2 | - |
| 6 | Jul 31, 1984 11:16 PM | Royal Ave | 1 | - | 1
| 2 | - |
| 7 | Dec 20, 1984 06:39 AM | Cochran St | 2 | - | 1
| 3 | - |
| 8 | Dec 21, 1984 11:03 PM | Fourth St | 1 | - | 1
| 4 | - |
Simi Valley fatal car crash and road traffic accident list for 1983
- Fatal accident count13
- Vehicles involved in fatal accidents19
- Fatal accidents involving drunk persons11
- Fatalities16
- Persons involved in fatal accidents35
Dark - Lighted
- Simi Valley(Based on 13 reports) 38.5%
- Ventura County(Based on 95 reports) 21.1%
- California(Based on 4,082 reports) 23.9%
Daylight
- Simi Valley(Based on 13 reports) 23.1%
- Ventura County(Based on 95 reports) 38.9%
- California(Based on 4,082 reports) 42.4%
Dark - Not Lighted
- Simi Valley(Based on 13 reports) 23.1%
- Ventura County(Based on 95 reports) 30.5%
- California(Based on 4,082 reports) 29.8%
Dusk
- Simi Valley(Based on 13 reports) 7.7%
- Ventura County(Based on 95 reports) 5.3%
- California(Based on 4,082 reports) 2.3%
Dawn
- Simi Valley(Based on 13 reports) 7.7%
- Ventura County(Based on 95 reports) 4.2%
- California(Based on 4,082 reports) 1.6%
Clear
- Simi Valley(Based on 13 reports) 92.3%
- Ventura County(Based on 95 reports) 93.7%
- California(Based on 4,089 reports) 89.6%
Rain
- Simi Valley(Based on 13 reports) 7.7%
- Ventura County(Based on 95 reports) 4.2%
- California(Based on 4,089 reports) 8.5%
| # | Date | Location | Vehicles | Drunk persons | Fatalites | Persons | Pedestrians |
|---|
| 1 | Jan 3, 1983 06:31 AM | Yosemiteav | 1 | - | 1
| 2 | - |
| 2 | Feb 23, 1983 02:04 PM | Losangeles | 2 | - | 1
| 3 | - |
| 3 | May 71983 01:00 AM | | 1 | 1
| 1 | 2 | - |
| 4 | Jun 21, 1983 08:10 PM | Losanglsav | 2 | 1
| 1 | 6 | - |
| 5 | Jun 30, 1983 03:15 PM | Losanglsav | 2 | 1
| 1 | 5 | - |
| 6 | Jun 25, 1983 10:21 PM | Tierarejda | 1 | 1
| 1 | 2 | - |
| 7 | Jul 5, 1983 10:23 PM | Cochranst | 1 | 1
| 1 | 2 | - |
| 8 | Jul 30, 1983 01:43 AM | Sycamoredr | 2 | 1
| 1 | 3 | - |
| 9 | Aug 24, 1983 07:50 PM | Losanglsav | 2 | 1
| 1 | 2 | - |
| 10 | Sep 24, 1983 01:50 AM | Wlosangles | 1 | 1
| 2 | 2 | - |
| 11 | Oct 221983 01:00 AM | | 1 | 1
| 1 | 1 | - |
| 12 | Nov 10, 1983 04:42 PM | Elmonte Dr | 1 | 1
| 1 | 1 | - |
| 13 | Dec 24, 1983 04:10 PM | Madera Rd | 2 | 1
| 3 | 4 | - |
Simi Valley fatal car crash and road traffic accident list for 1982
- Fatal accident count7
- Vehicles involved in fatal accidents8
- Fatal accidents involving drunk persons2
- Fatalities7
- Persons involved in fatal accidents18
Dark - Lighted
- Simi Valley(Based on 7 reports) 57.1%
- Ventura County(Based on 76 reports) 25.0%
- California(Based on 4,116 reports) 27.0%
Daylight
- Simi Valley(Based on 7 reports) 42.9%
- Ventura County(Based on 76 reports) 32.9%
- California(Based on 4,116 reports) 39.7%
Clear
- Simi Valley(Based on 7 reports) 100.0%
- Ventura County(Based on 76 reports) 92.1%
- California(Based on 4,119 reports) 90.8%
| # | Date | Location | Vehicles | Drunk persons | Fatalites | Persons | Pedestrians |
|---|
| 1 | Apr 20, 1982 05:46 PM | Royalave | 1 | - | 1
| 2 | - |
| 2 | May 121982 05:05 AM | | 1 | - | 1
| 1 | - |
| 3 | May 24, 1982 05:38 PM | Olsenroad | 1 | - | 1
| 2 | - |
| 4 | Jul 10, 1982 01:48 AM | Losangeles | 1 | 1
| 1 | 4 | - |
| 5 | Nov 11, 1982 08:35 PM | Cochranst | 1 | - | 1
| 2 | - |
| 6 | Nov 22, 1982 05:48 PM | Royalave | 1 | - | 1
| 3 | - |
| 7 | Dec 21, 1982 10:18 AM | Losangeles | 2 | 1
| 1 | 4 | - |
Simi Valley fatal car crash and road traffic accident list for 1981
- Fatal accident count12
- Vehicles involved in fatal accidents21
- Fatal accidents involving drunk persons6
- Fatalities16
- Persons involved in fatal accidents26
Daylight
- Simi Valley(Based on 12 reports) 41.7%
- Ventura County(Based on 87 reports) 35.6%
- California(Based on 4,670 reports) 39.8%
Dark - Lighted
- Simi Valley(Based on 12 reports) 33.3%
- Ventura County(Based on 87 reports) 34.5%
- California(Based on 4,670 reports) 26.4%
Dark - Not Lighted
- Simi Valley(Based on 12 reports) 25.0%
- Ventura County(Based on 87 reports) 26.4%
- California(Based on 4,670 reports) 30.3%
Clear
- Simi Valley(Based on 12 reports) 83.3%
- Ventura County(Based on 87 reports) 89.7%
- California(Based on 4,670 reports) 93.0%
Rain
- Simi Valley(Based on 12 reports) 16.7%
- Ventura County(Based on 87 reports) 5.7%
- California(Based on 4,670 reports) 4.8%
Simi Valley fatal car crash and road traffic accident list for 1980
- Fatal accident count6
- Vehicles involved in fatal accidents10
- Fatal accidents involving drunk persons2
- Fatalities6
- Persons involved in fatal accidents12
Daylight
- Simi Valley(Based on 6 reports) 66.7%
- Ventura County(Based on 108 reports) 37.0%
- California(Based on 4,928 reports) 39.5%
Dark - Not Lighted
- Simi Valley(Based on 6 reports) 16.7%
- Ventura County(Based on 108 reports) 38.9%
- California(Based on 4,928 reports) 31.3%
Dark - Lighted
- Simi Valley(Based on 6 reports) 16.7%
- Ventura County(Based on 108 reports) 17.6%
- California(Based on 4,928 reports) 25.8%
Clear
- Simi Valley(Based on 6 reports) 83.3%
- Ventura County(Based on 108 reports) 90.7%
- California(Based on 4,930 reports) 93.0%
Fog, Smog, Smoke
- Simi Valley(Based on 6 reports) 16.7%
- Ventura County(Based on 108 reports) 3.7%
- California(Based on 4,930 reports) 1.8%
Simi Valley fatal car crash and road traffic accident list for 1979
- Fatal accident count4
- Vehicles involved in fatal accidents8
- Fatal accidents involving drunk persons2
- Fatalities4
- Persons involved in fatal accidents15
Daylight
- Simi Valley(Based on 4 reports) 75.0%
- Ventura County(Based on 94 reports) 44.7%
- California(Based on 4,970 reports) 41.5%
Dark - Lighted
- Simi Valley(Based on 4 reports) 25.0%
- Ventura County(Based on 94 reports) 19.1%
- California(Based on 4,970 reports) 25.7%
Clear
- Simi Valley(Based on 4 reports) 75.0%
- Ventura County(Based on 95 reports) 94.7%
- California(Based on 4,975 reports) 92.9%
Rain
- Simi Valley(Based on 4 reports) 25.0%
- Ventura County(Based on 95 reports) 4.2%
- California(Based on 4,975 reports) 5.1%
Simi Valley fatal car crash and road traffic accident list for 1978
- Fatal accident count10
- Vehicles involved in fatal accidents13
- Fatal accidents involving drunk persons3
- Fatalities10
- Persons involved in fatal accidents26
Daylight
- Simi Valley(Based on 10 reports) 70.0%
- Ventura County(Based on 101 reports) 46.5%
- California(Based on 4,722 reports) 42.5%
Dark - Not Lighted
- Simi Valley(Based on 10 reports) 20.0%
- Ventura County(Based on 101 reports) 32.7%
- California(Based on 4,722 reports) 30.1%
Dark - Unknown Lighting
- Simi Valley(Based on 10 reports) 10.0%
- Ventura County(Based on 101 reports) 3.0%
- California(Based on 4,722 reports) 3.6%
Clear
- Simi Valley(Based on 10 reports) 90.0%
- Ventura County(Based on 101 reports) 89.1%
- California(Based on 4,724 reports) 90.7%
Rain
- Simi Valley(Based on 10 reports) 10.0%
- Ventura County(Based on 101 reports) 5.9%
- California(Based on 4,724 reports) 6.6%
Simi Valley fatal car crash and road traffic accident list for 1977
- Fatal accident count6
- Vehicles involved in fatal accidents8
- Fatal accidents involving drunk persons3
- Fatalities6
- Persons involved in fatal accidents11
Daylight
- Simi Valley(Based on 6 reports) 50.0%
- Ventura County(Based on 95 reports) 51.6%
- California(Based on 4,347 reports) 40.0%
Dark - Lighted
- Simi Valley(Based on 6 reports) 33.3%
- Ventura County(Based on 95 reports) 12.6%
- California(Based on 4,347 reports) 23.7%
Dark - Not Lighted
- Simi Valley(Based on 6 reports) 16.7%
- Ventura County(Based on 95 reports) 31.6%
- California(Based on 4,347 reports) 32.9%
Clear
- Simi Valley(Based on 6 reports) 100.0%
- Ventura County(Based on 95 reports) 96.8%
- California(Based on 4,351 reports) 93.2%
Simi Valley fatal car crash and road traffic accident list for 1976
- Fatal accident count13
- Vehicles involved in fatal accidents20
- Fatal accidents involving drunk persons5
- Fatalities17
- Persons involved in fatal accidents41
Daylight
- Simi Valley(Based on 13 reports) 69.2%
- Ventura County(Based on 77 reports) 50.6%
- California(Based on 3,663 reports) 42.8%
Dark - Lighted
- Simi Valley(Based on 13 reports) 30.8%
- Ventura County(Based on 77 reports) 26.0%
- California(Based on 3,663 reports) 24.5%
Clear
- Simi Valley(Based on 13 reports) 92.3%
- Ventura County(Based on 77 reports) 92.2%
- California(Based on 3,667 reports) 91.8%
Rain
- Simi Valley(Based on 13 reports) 7.7%
- Ventura County(Based on 77 reports) 3.9%
- California(Based on 3,667 reports) 4.8%
Simi Valley fatal car crash and road traffic accident list for 1975
- Fatal accident count13
- Vehicles involved in fatal accidents20
- Fatal accidents involving drunk persons5
- Fatalities17
- Persons involved in fatal accidents41
Daylight
- Simi Valley(Based on 13 reports) 69.2%
- Ventura County(Based on 77 reports) 50.6%
- California(Based on 3,663 reports) 42.8%
Dark - Lighted
- Simi Valley(Based on 13 reports) 30.8%
- Ventura County(Based on 77 reports) 26.0%
- California(Based on 3,663 reports) 24.5%
Clear
- Simi Valley(Based on 13 reports) 92.3%
- Ventura County(Based on 77 reports) 92.2%
- California(Based on 3,667 reports) 91.8%
Rain
- Simi Valley(Based on 13 reports) 7.7%
- Ventura County(Based on 77 reports) 3.9%
- California(Based on 3,667 reports) 4.8%