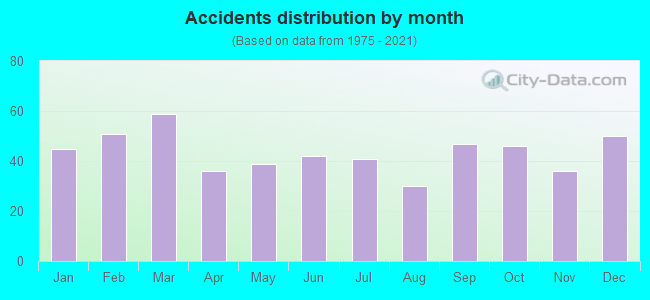
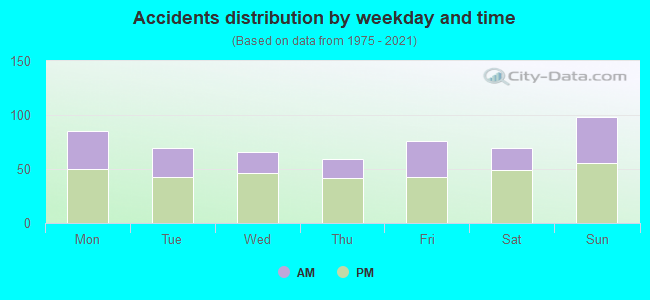
Fatal car crashes and road traffic accidents in Oxnard, California
- Fatal car crash and road traffic accident statistics for 2021
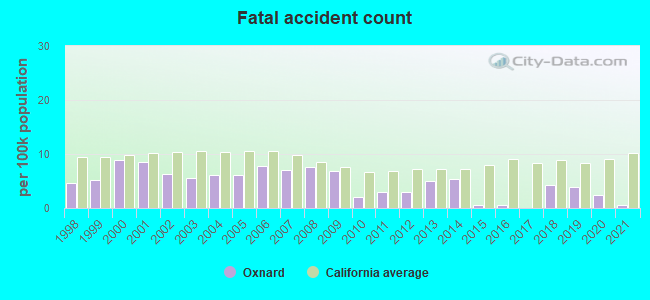
- Fatal accident count1
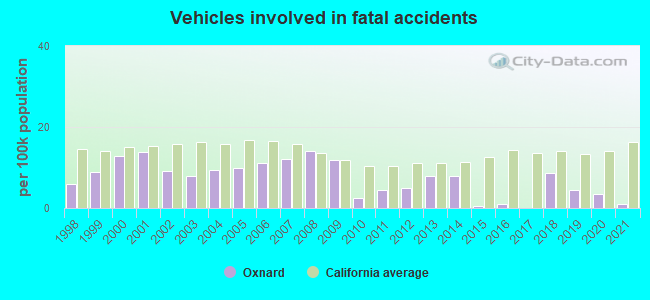
- Vehicles involved in fatal accidents2
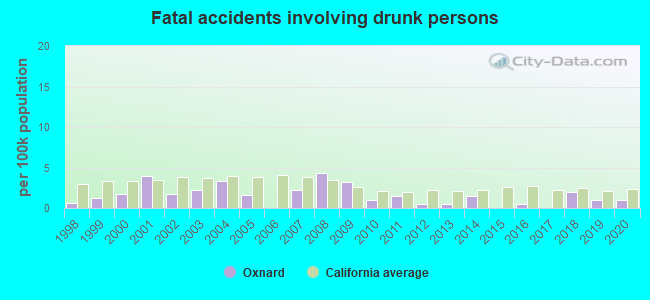
- Fatal accidents involving drunk persons0
- Fatalities1
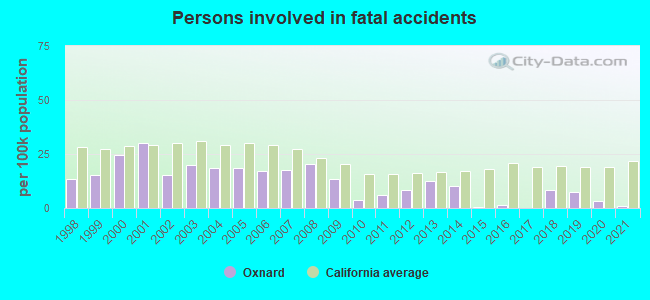
- Persons involved in fatal accidents2
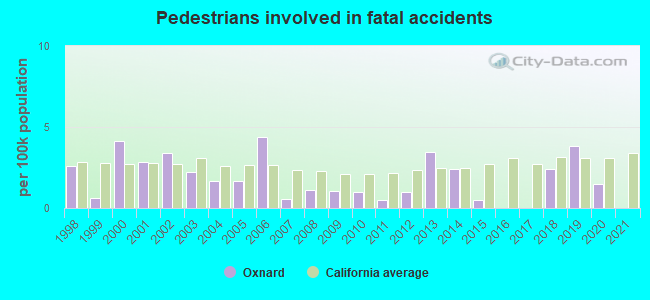
- Pedestrians involved in fatal accidents0
- Fatal car crash and road traffic accident statistics for 2020
- Fatal accident count5
- Vehicles involved in fatal accidents7
- Fatal accidents involving drunk persons2
- Fatalities5
- Persons involved in fatal accidents7
- Pedestrians involved in fatal accidents3
- Fatal car crash and road traffic accident statistics for 2019
- Fatal accident count8
- Vehicles involved in fatal accidents9
- Fatal accidents involving drunk persons2
- Fatalities8
- Persons involved in fatal accidents15
- Pedestrians involved in fatal accidents8
- Fatal car crash and road traffic accident statistics for 2018
- Fatal accident count9
- Vehicles involved in fatal accidents18
- Fatal accidents involving drunk persons4
- Fatalities10
- Persons involved in fatal accidents17
- Pedestrians involved in fatal accidents5
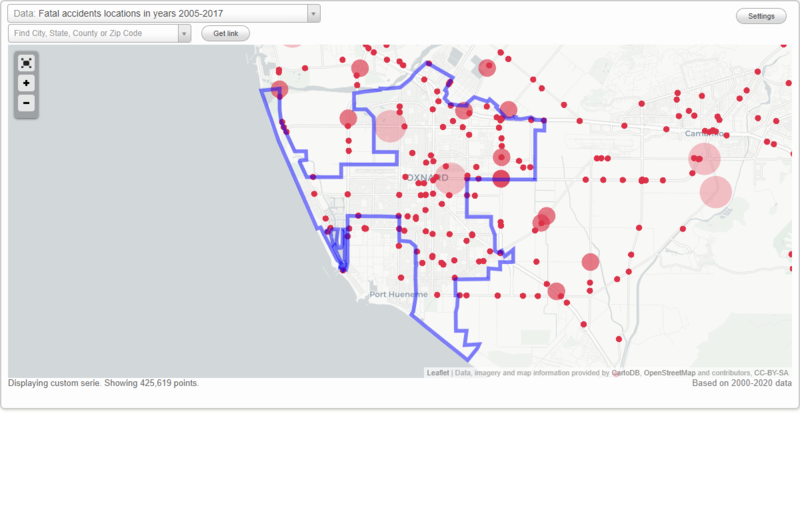
Data:
Latest news about accidents in Oxnard, CA collected exclusively by city-data.com from local newspapers, TV, and radio stations
No street view available for this location
Oxnard fatal accident statistics for 1998 - 2021
Average EMS response time
- Oxnard(Based on 3 reports) 3.7 mins
- Ventura County(Based on 29 reports) 9.7 mins
- California(Based on 2,270 reports) 9.8 mins
Average hospital transport time
- Oxnard(Based on 2 reports) 16.0 mins
- Ventura County(Based on 11 reports) 39.6 mins
- California(Based on 1,048 reports) 53.1 mins
Daylight
- Oxnard(Based on 521 reports) 43.0%
- Ventura County(Based on 3,291 reports) 48.2%
- California(Based on 177,072 reports) 43.9%
Dark - Lighted
- Oxnard(Based on 521 reports) 39.3%
- Ventura County(Based on 3,291 reports) 21.0%
- California(Based on 177,072 reports) 25.4%
Dark - Not Lighted
- Oxnard(Based on 521 reports) 12.3%
- Ventura County(Based on 3,291 reports) 25.8%
- California(Based on 177,072 reports) 26.6%
Dusk
- Oxnard(Based on 521 reports) 2.5%
- Ventura County(Based on 3,291 reports) 2.7%
- California(Based on 177,072 reports) 2.1%
Dawn
- Oxnard(Based on 521 reports) 2.3%
- Ventura County(Based on 3,291 reports) 1.8%
- California(Based on 177,072 reports) 1.6%
Dark - Unknown Lighting
- Oxnard(Based on 521 reports) 0.6%
- Ventura County(Based on 3,291 reports) 0.5%
- California(Based on 177,072 reports) 0.5%
Clear
- Oxnard(Based on 522 reports) 93.5%
- Ventura County(Based on 3,296 reports) 92.0%
- California(Based on 177,248 reports) 91.0%
Rain
- Oxnard(Based on 522 reports) 4.0%
- Ventura County(Based on 3,296 reports) 4.3%
- California(Based on 177,248 reports) 4.8%
Fog, Smog, Smoke
- Oxnard(Based on 522 reports) 1.5%
- Ventura County(Based on 3,296 reports) 1.3%
- California(Based on 177,248 reports) 1.1%
Unknown
- Oxnard(Based on 522 reports) 1.0%
- Ventura County(Based on 3,296 reports) 2.2%
- California(Based on 177,248 reports) 2.6%

Oxnard fatal car crash and road traffic accident list for 2021
Oxnard fatal car crash and road traffic accident list for 2020
- Fatal accident count5
- Vehicles involved in fatal accidents7
- Fatal accidents involving drunk persons2
- Fatalities5
- Persons involved in fatal accidents7
- Pedestrians involved in fatal accidents3
Dark - Lighted
- Oxnard(Based on 5 reports) 80.0%
- Ventura County(Based on 52 reports) 28.8%
- California(Based on 3,555 reports) 31.5%
Daylight
- Oxnard(Based on 5 reports) 20.0%
- Ventura County(Based on 52 reports) 42.3%
- California(Based on 3,555 reports) 38.6%
Clear
- Oxnard(Based on 5 reports) 100.0%
- Ventura County(Based on 52 reports) 90.4%
- California(Based on 3,547 reports) 87.8%
Oxnard fatal car crash and road traffic accident list for 2019
- Fatal accident count8
- Vehicles involved in fatal accidents9
- Fatal accidents involving drunk persons2
- Fatalities8
- Persons involved in fatal accidents15
- Pedestrians involved in fatal accidents8
Daylight
- Oxnard(Based on 8 reports) 50.0%
- Ventura County(Based on 43 reports) 44.2%
- California(Based on 3,314 reports) 38.4%
Dark - Lighted
- Oxnard(Based on 8 reports) 37.5%
- Ventura County(Based on 43 reports) 27.9%
- California(Based on 3,314 reports) 31.1%
Dawn
- Oxnard(Based on 8 reports) 12.5%
- Ventura County(Based on 43 reports) 4.7%
- California(Based on 3,314 reports) 2.4%
Clear
- Oxnard(Based on 8 reports) 87.5%
- Ventura County(Based on 43 reports) 81.4%
- California(Based on 3,313 reports) 79.4%
Unknown
- Oxnard(Based on 8 reports) 12.5%
- Ventura County(Based on 43 reports) 14.0%
- California(Based on 3,313 reports) 14.9%
| # | Date | Location | Vehicles | Drunk persons | Fatalites | Persons | Pedestrians |
|---|
| 1 | Jul 20, 2019 01:23 PM | Victoria Av | 1 | 1
| 1 | 1 | - |
| 2 | Jun 18, 2019 05:30 AM | Hemlock St, Seaside Dr | 1 | - | 1
| 4 | 1 |
| 3 | Aug 25, 2019 01:03 PM | Gonzales Rd, Patterson Rd | 2 | - | 1
| 3 | - |
| 4 | Aug 1, 2019 08:49 PM | Pleasant Valley Rd, Cloyne St | 1 | 1
| 1 | 3 | 1 |
| 5 | Jun 10, 2019 00:52 AM | Saviers Rd, Thomas Ave | 1 | - | 1
| 1 | 1 |
| 6 | Sep 23, 2019 09:45 PM | Oxnard Bl, Ash St | 1 | - | 1
| 1 | 1 |
| 7 | Oct 25, 2019 01:01 PM | N C St | 1 | - | 1
| 1 | 1 |
| 8 | Sep 30, 2019 07:40 AM | Cooper Rd, Anita Av | 1 | - | 1
| 1 | 3 |
Oxnard fatal car crash and road traffic accident list for 2018
- Fatal accident count9
- Vehicles involved in fatal accidents18
- Fatal accidents involving drunk persons4
- Fatalities10
- Persons involved in fatal accidents17
- Pedestrians involved in fatal accidents5
Dark - Lighted
- Oxnard(Based on 9 reports) 77.8%
- Ventura County(Based on 51 reports) 29.4%
- California(Based on 3,483 reports) 32.2%
Daylight
- Oxnard(Based on 9 reports) 22.2%
- Ventura County(Based on 51 reports) 51.0%
- California(Based on 3,483 reports) 39.4%
Clear
- Oxnard(Based on 9 reports) 88.9%
- Ventura County(Based on 51 reports) 84.3%
- California(Based on 3,478 reports) 85.0%
Unknown
- Oxnard(Based on 9 reports) 11.1%
- Ventura County(Based on 51 reports) 13.7%
- California(Based on 3,478 reports) 11.5%
| # | Date | Location | Vehicles | Drunk persons | Fatalites | Persons | Pedestrians |
|---|
| 1 | Mar 29, 2018 08:21 PM | Cooper Rd, Grant Ave | 1 | 1
| 1 | 1 | 1 |
| 2 | Jul 20, 2018 09:25 PM | Oxnard Blvd | 1 | 1
| 1 | 2 | 1 |
| 3 | Jun 2, 2018 01:13 AM | Channel Islands Blvd | 9 | 1
| 1 | 5 | - |
| 4 | Feb 10, 2018 11:49 PM | Oxnard Bl | 1 | - | 1
| 1 | 1 |
| 5 | Jun 23, 2018 01:16 AM | Gonzales Rd | 1 | - | 1
| 1 | - |
| 6 | Dec 26, 2018 05:54 PM | H St, Janetwood Dr | 1 | - | 1
| 1 | 1 |
| 7 | May 12, 2018 05:02 PM | Auto Center Dr | 1 | - | 1
| 1 | - |
| 8 | May 30, 2018 07:09 AM | Channel Islands Bl | 1 | 1
| 1 | 1 | 1 |
| 9 | Sep 3, 2018 11:30 PM | Victoria Ave | 2 | - | 2
| 4 | - |
Oxnard fatal car crash and road traffic accident list for 2016
| # | Date | Location | Vehicles | Drunk persons | Fatalites | Persons | Pedestrians |
|---|
| 1 | Oct 29, 2016 01:55 AM | Cr-Harbor Blvd | 2 | 1
| 2 | 3 | - |
Oxnard fatal car crash and road traffic accident list for 2015
| # | Date | Location | Vehicles | Drunk persons | Fatalites | Persons | Pedestrians |
|---|
| 1 | Jan 22, 2015 06:28 AM | J St | 1 | - | 1
| 1 | 1 |
Oxnard fatal car crash and road traffic accident list for 2014
- Fatal accident count11
- Vehicles involved in fatal accidents16
- Fatal accidents involving drunk persons3
- Fatalities12
- Persons involved in fatal accidents21
- Pedestrians involved in fatal accidents5
Dark - Lighted
- Oxnard(Based on 11 reports) 54.5%
- Ventura County(Based on 44 reports) 27.3%
- California(Based on 2,819 reports) 29.9%
Daylight
- Oxnard(Based on 11 reports) 36.4%
- Ventura County(Based on 44 reports) 47.7%
- California(Based on 2,819 reports) 42.9%
Dark - Not Lighted
- Oxnard(Based on 11 reports) 9.1%
- Ventura County(Based on 44 reports) 22.7%
- California(Based on 2,819 reports) 22.6%
Clear
- Oxnard(Based on 11 reports) 90.9%
- Ventura County(Based on 45 reports) 88.9%
- California(Based on 2,819 reports) 84.2%
Unknown
- Oxnard(Based on 11 reports) 9.1%
- Ventura County(Based on 45 reports) 11.1%
- California(Based on 2,819 reports) 13.6%
| # | Date | Location | Vehicles | Drunk persons | Fatalites | Persons | Pedestrians |
|---|
| 1 | Mar 29, 2014 09:28 PM | 5th Street, K Street | 2 | 1
| 1 | 2 | - |
| 2 | Jan 26, 2014 02:09 AM | Rose Ave | 1 | 1
| 1 | 1 | 1 |
| 3 | Mar 22, 2014 06:09 AM | Rice Ave, Camino Del Sol | 3 | - | 1
| 5 | - |
| 4 | Apr 19, 2014 05:30 AM | 7th St, F St | 1 | - | 1
| 1 | 1 |
| 5 | Apr 18, 2014 11:12 PM | Vineyard Avenue, Esplanade Drive | 2 | - | 1
| 3 | - |
| 6 | May 1, 2014 06:44 PM | N Ventura Rd | 1 | - | 1
| 1 | - |
| 7 | May 12, 2014 10:28 AM | A St, Deodar Ave | 1 | - | 1
| 1 | 1 |
| 8 | Jun 3, 2014 07:26 PM | Rice Ave | 1 | - | 2
| 2 | - |
| 9 | Jun 3, 2014 11:20 PM | Wooley Rd | 1 | - | 1
| 1 | 1 |
| 10 | Sep 18, 2014 07:07 AM | Wooley Road, Novato Dr | 1 | - | 1
| 1 | 1 |
| 11 | Nov 5, 2014 11:12 PM | Victoria Ave, Gonzales Rd | 2 | 1
| 1 | 3 | - |
Oxnard fatal car crash and road traffic accident list for 2013
- Fatal accident count10
- Vehicles involved in fatal accidents16
- Fatal accidents involving drunk persons1
- Fatalities10
- Persons involved in fatal accidents25
- Pedestrians involved in fatal accidents7
Dark - Lighted
- Oxnard(Based on 10 reports) 50.0%
- Ventura County(Based on 61 reports) 18.0%
- California(Based on 2,765 reports) 26.6%
Daylight
- Oxnard(Based on 10 reports) 40.0%
- Ventura County(Based on 61 reports) 54.1%
- California(Based on 2,765 reports) 44.7%
Dark - Not Lighted
- Oxnard(Based on 10 reports) 10.0%
- Ventura County(Based on 61 reports) 21.3%
- California(Based on 2,765 reports) 24.0%
Clear
- Oxnard(Based on 10 reports) 90.0%
- Ventura County(Based on 61 reports) 90.2%
- California(Based on 2,760 reports) 88.1%
Fog, Smog, Smoke
- Oxnard(Based on 10 reports) 10.0%
- Ventura County(Based on 61 reports) 3.3%
- California(Based on 2,760 reports) 0.9%
| # | Date | Location | Vehicles | Drunk persons | Fatalites | Persons | Pedestrians |
|---|
| 1 | Feb 3, 2013 05:42 PM | C St, Linden Dr | 1 | - | 1
| 1 | 1 |
| 2 | Feb 12, 2013 03:51 PM | Victoria Ave, Wooley Rd | 2 | - | 1
| 3 | - |
| 3 | May 28, 2013 08:36 PM | Pleasent Vly Rd | 1 | - | 1
| 2 | 1 |
| 4 | Dec 19, 2013 06:12 PM | C St | 1 | - | 1
| 4 | 1 |
| 5 | Mar 12, 2013 09:25 PM | Channel Islands Blvd | 1 | - | 1
| 3 | 1 |
| 6 | Sep 20, 2013 10:50 PM | Hemlock St, Capstan Dr | 1 | - | 1
| 1 | 1 |
| 7 | Oct 6, 2013 01:01 AM | Saviers Road | 2 | 1
| 1 | 2 | - |
| 8 | Oct 29, 2013 04:56 PM | Ventura Rd | 2 | - | 1
| 1 | 1 |
| 9 | May 24, 2013 08:47 PM | Rose Ave | 3 | - | 1
| 6 | - |
| 10 | Oct 21, 2013 08:02 AM | Rose Ave | 2 | - | 1
| 2 | 1 |
Oxnard fatal car crash and road traffic accident list for 2012
- Fatal accident count6
- Vehicles involved in fatal accidents10
- Fatal accidents involving drunk persons1
- Fatalities6
- Persons involved in fatal accidents17
- Pedestrians involved in fatal accidents2
Daylight
- Oxnard(Based on 6 reports) 66.7%
- Ventura County(Based on 46 reports) 69.6%
- California(Based on 2,727 reports) 44.2%
Dark - Lighted
- Oxnard(Based on 6 reports) 33.3%
- Ventura County(Based on 46 reports) 17.4%
- California(Based on 2,727 reports) 27.5%
Clear
- Oxnard(Based on 6 reports) 83.3%
- Ventura County(Based on 46 reports) 91.3%
- California(Based on 2,728 reports) 82.3%
Unknown
- Oxnard(Based on 6 reports) 16.7%
- Ventura County(Based on 46 reports) 6.5%
- California(Based on 2,728 reports) 15.0%
Oxnard fatal car crash and road traffic accident list for 2011
- Fatal accident count6
- Vehicles involved in fatal accidents9
- Fatal accidents involving drunk persons3
- Fatalities7
- Persons involved in fatal accidents12
- Pedestrians involved in fatal accidents1
Daylight
- Oxnard(Based on 6 reports) 50.0%
- Ventura County(Based on 62 reports) 43.5%
- California(Based on 2,591 reports) 45.3%
Dark - Lighted
- Oxnard(Based on 6 reports) 33.3%
- Ventura County(Based on 62 reports) 21.0%
- California(Based on 2,591 reports) 28.1%
Dusk
- Oxnard(Based on 6 reports) 16.7%
- Ventura County(Based on 62 reports) 3.2%
- California(Based on 2,591 reports) 2.4%
Clear
- Oxnard(Based on 6 reports) 83.3%
- Ventura County(Based on 62 reports) 88.7%
- California(Based on 2,581 reports) 81.3%
Unknown
- Oxnard(Based on 6 reports) 16.7%
- Ventura County(Based on 62 reports) 9.7%
- California(Based on 2,581 reports) 15.1%
Oxnard fatal car crash and road traffic accident list for 2010
- Fatal accident count4
- Vehicles involved in fatal accidents5
- Fatal accidents involving drunk persons2
- Fatalities5
- Persons involved in fatal accidents7
- Pedestrians involved in fatal accidents2
Daylight
- Oxnard(Based on 4 reports) 50.0%
- Ventura County(Based on 40 reports) 52.5%
- California(Based on 2,501 reports) 42.5%
Dark - Not Lighted
- Oxnard(Based on 4 reports) 25.0%
- Ventura County(Based on 40 reports) 25.0%
- California(Based on 2,501 reports) 24.4%
Dark - Lighted
- Oxnard(Based on 4 reports) 25.0%
- Ventura County(Based on 40 reports) 20.0%
- California(Based on 2,501 reports) 28.1%
Clear
- Oxnard(Based on 4 reports) 100.0%
- Ventura County(Based on 40 reports) 72.5%
- California(Based on 2,495 reports) 77.2%
Oxnard fatal car crash and road traffic accident list for 2009
- Fatal accident count13
- Vehicles involved in fatal accidents22
- Fatal accidents involving drunk persons6
- Fatalities15
- Persons involved in fatal accidents25
- Pedestrians involved in fatal accidents2
Dark - Lighted
- Oxnard(Based on 13 reports) 53.8%
- Ventura County(Based on 57 reports) 26.3%
- California(Based on 2,811 reports) 26.0%
Daylight
- Oxnard(Based on 13 reports) 30.8%
- Ventura County(Based on 57 reports) 52.6%
- California(Based on 2,811 reports) 45.3%
Dawn
- Oxnard(Based on 13 reports) 7.7%
- Ventura County(Based on 57 reports) 3.5%
- California(Based on 2,811 reports) 1.8%
Dark - Not Lighted
- Oxnard(Based on 13 reports) 7.7%
- Ventura County(Based on 57 reports) 15.8%
- California(Based on 2,811 reports) 24.1%
Clear
- Oxnard(Based on 13 reports) 100.0%
- Ventura County(Based on 57 reports) 94.7%
- California(Based on 2,816 reports) 94.7%
| # | Date | Location | Vehicles | Drunk persons | Fatalites | Persons | Pedestrians |
|---|
| 1 | Jan 15, 2009 05:00 PM | Sr-1 | 2 | 1
| 1 | 3 | - |
| 2 | Feb 7, 2009 07:46 PM | Channel Islands Bl, Olds Rd | 1 | - | 1
| 2 | 1 |
| 3 | Feb 15, 2009 11:59 PM | Sr-1 | 1 | 1
| 1 | 2 | - |
| 4 | Jan 27, 2009 06:13 AM | Rice Ave, Latigo Ave | 3 | - | 1
| 3 | - |
| 5 | Apr 30, 2009 09:35 AM | Us-101 | 2 | - | 1
| 2 | - |
| 6 | Jun 6, 2009 10:15 AM | Sr-1 Ramp | 1 | - | 1
| 1 | - |
| 7 | Aug 6, 2009 07:05 AM | Us-101 | 1 | - | 1
| 1 | - |
| 8 | Aug 1, 2009 02:29 AM | Rice Ave, Sr-101 Ramp | 1 | 1
| 1 | 1 | - |
| 9 | Sep 15, 2009 02:11 AM | Ventura Rd, Forrest Park Bl | 1 | 1
| 1 | 1 | - |
| 10 | Oct 11, 2009 01:16 AM | Bonita Ave | 4 | 1
| 1 | 1 | - |
| 11 | Nov 10, 2009 08:43 PM | Gonzales Rd | 1 | 1
| 3 | 4 | - |
| 12 | Nov 10, 2009 05:49 PM | Bard Rd | 1 | - | 1
| 2 | 1 |
| 13 | Dec 23, 2009 04:43 PM | Hemlock St | 3 | - | 1
| 2 | - |
Oxnard fatal car crash and road traffic accident list for 2008
- Fatal accident count14
- Vehicles involved in fatal accidents26
- Fatal accidents involving drunk persons8
- Fatalities16
- Persons involved in fatal accidents38
- Pedestrians involved in fatal accidents2
Daylight
- Oxnard(Based on 14 reports) 42.9%
- Ventura County(Based on 65 reports) 56.9%
- California(Based on 3,141 reports) 45.7%
Dark - Lighted
- Oxnard(Based on 14 reports) 28.6%
- Ventura County(Based on 65 reports) 18.5%
- California(Based on 3,141 reports) 25.0%
Dark - Not Lighted
- Oxnard(Based on 14 reports) 21.4%
- Ventura County(Based on 65 reports) 20.0%
- California(Based on 3,141 reports) 25.2%
Dusk
- Oxnard(Based on 14 reports) 7.1%
- Ventura County(Based on 65 reports) 3.1%
- California(Based on 3,141 reports) 2.0%
Clear
- Oxnard(Based on 14 reports) 100.0%
- Ventura County(Based on 65 reports) 95.4%
- California(Based on 3,145 reports) 94.2%
| # | Date | Location | Vehicles | Drunk persons | Fatalites | Persons | Pedestrians |
|---|
| 1 | Feb 25, 2008 11:55 AM | Hueneme Rd | 3 | - | 1
| 3 | - |
| 2 | Feb 26, 2008 07:40 AM | Santa Lucia Ave | 2 | - | 1
| 7 | 1 |
| 3 | Mar 13, 2008 11:30 PM | Ocean Dr, San Nicolas Ave | 1 | 1
| 1 | 1 | - |
| 4 | Apr 27, 2008 02:19 AM | Sr-34, Diaz Ave | 1 | - | 3
| 3 | - |
| 5 | Apr 21, 2008 07:27 PM | Gonzales Rd, Sonata Dr | 2 | 1
| 1 | 3 | - |
| 6 | Jul 12, 2008 04:04 AM | Auto Center Dr | 1 | 1
| 1 | 1 | - |
| 7 | Jun 1, 2008 04:29 PM | Sr-1 | 2 | - | 1
| 2 | - |
| 8 | Oct 18, 2008 01:45 AM | J St | 3 | 1
| 1 | 1 | - |
| 9 | Sep 6, 2008 03:41 PM | Wooley Rd, C St | 2 | 1
| 1 | 2 | - |
| 10 | Sep 3, 2008 05:45 AM | C St, Elm St | 1 | - | 1
| 2 | 1 |
| 11 | Sep 22, 2008 03:19 PM | Camino Del Sol, Rice Ave | 2 | - | 1
| 2 | - |
| 12 | Mar 14, 2008 05:51 PM | Gonzales Rd | 3 | - | 1
| 3 | - |
| 13 | Oct 26, 2008 01:05 AM | Harbor Bl, Channel Islands Bl | 1 | 1
| 1 | 2 | - |
| 14 | Dec 6, 2008 11:02 PM | Sr-1, 6th St | 2 | 2
| 1 | 6 | - |
Oxnard fatal car crash and road traffic accident list for 2007
- Fatal accident count13
- Vehicles involved in fatal accidents22
- Fatal accidents involving drunk persons4
- Fatalities13
- Persons involved in fatal accidents32
- Pedestrians involved in fatal accidents1
Daylight
- Oxnard(Based on 12 reports) 41.7%
- Ventura County(Based on 71 reports) 47.9%
- California(Based on 3,574 reports) 46.4%
Dark - Lighted
- Oxnard(Based on 12 reports) 41.7%
- Ventura County(Based on 71 reports) 23.9%
- California(Based on 3,574 reports) 25.2%
Dawn
- Oxnard(Based on 12 reports) 8.3%
- Ventura County(Based on 71 reports) 4.2%
- California(Based on 3,574 reports) 1.8%
Dark - Not Lighted
- Oxnard(Based on 12 reports) 8.3%
- Ventura County(Based on 71 reports) 22.5%
- California(Based on 3,574 reports) 24.2%
Clear
- Oxnard(Based on 13 reports) 100.0%
- Ventura County(Based on 72 reports) 90.3%
- California(Based on 3,591 reports) 95.4%
| # | Date | Location | Vehicles | Drunk persons | Fatalites | Persons | Pedestrians |
|---|
| 1 | Jan 20, 2007 05:02 PM | Sr-34 | 1 | - | 1
| 1 | - |
| 2 | Jan 29, 2007 08:32 PM | Wooley Rd, Rose Ave | 2 | - | 1
| 3 | - |
| 3 | Jan 18, 2007 00:38 AM | Channel Islands Blvd, Ventura Rd | 3 | 1
| 1 | 4 | - |
| 4 | Mar 18, 2007 08:16 PM | Sr-232 | 1 | - | 1
| 2 | 1 |
| 5 | May 6, 2007 04:27 AM | Rice Ave | 1 | - | 1
| 3 | - |
| 6 | Apr 21, 2007 05:13 AM | Gonzales Rd | 1 | - | 1
| 1 | - |
| 7 | May 3, 2007 10:07 AM | Almendra Pl | 1 | - | 1
| 2 | - |
| 8 | Jul 7, 2007 10:30 PM | J St, Yucca St | 3 | 1
| 1 | 5 | - |
| 9 | Jun 12, 2007 10:43 AM | Us-101, Del Norte Blvd | 1 | - | 1
| 1 | - |
| 10 | Jun 29, 2007 04:57 AM | Rose Ave, Eastman Ave | 2 | - | 1
| 4 | - |
| 11 | Jul 3, 2007 09:27 AM | Gonzales Rd, Entrada Dr | 4 | - | 1
| 4 | - |
| 12 | Sep 30, 2007 03:03 PM | Bard Rd | 1 | 1
| 1 | 1 | - |
| 13 | Dec 24, 2007 04:25 AM | Rice Ave | 1 | 1
| 1 | 1 | - |
Oxnard fatal car crash and road traffic accident list for 2006
- Fatal accident count14
- Vehicles involved in fatal accidents20
- Fatalities14
- Persons involved in fatal accidents31
- Pedestrians involved in fatal accidents8
Daylight
- Oxnard(Based on 14 reports) 85.7%
- Ventura County(Based on 74 reports) 56.8%
- California(Based on 3,824 reports) 45.4%
Dark - Lighted
- Oxnard(Based on 14 reports) 14.3%
- Ventura County(Based on 74 reports) 20.3%
- California(Based on 3,824 reports) 25.2%
Clear
- Oxnard(Based on 14 reports) 100.0%
- Ventura County(Based on 74 reports) 91.9%
- California(Based on 3,839 reports) 93.9%
| # | Date | Location | Vehicles | Drunk persons | Fatalites | Persons | Pedestrians |
|---|
| 1 | Jan 24, 2006 04:03 PM | Bard Rd, Justin Way | 1 | - | 1
| 4 | 1 |
| 2 | Feb 6, 2006 06:24 AM | Sr-34 | 1 | - | 1
| 2 | 1 |
| 3 | Feb 6, 2006 07:37 PM | Sr-1, Sr-232 | 1 | - | 1
| 2 | 1 |
| 4 | Feb 15, 2006 02:07 PM | Harbor Blvd, Costa De Oro | 2 | - | 1
| 2 | - |
| 5 | Apr 19, 2006 08:08 AM | Camino Del Sol, Kinetic Dr | 2 | - | 1
| 2 | - |
| 6 | Jun 26, 2006 02:09 PM | Saviers Rd | 1 | - | 1
| 2 | 1 |
| 7 | Mar 9, 2006 07:24 AM | Doris Ave, H St | 1 | - | 1
| 2 | 1 |
| 8 | May 13, 2006 03:15 PM | Avocado Ave, Persimmon Ln | 1 | - | 1
| 2 | 1 |
| 9 | Jul 2, 2006 06:39 PM | Sr-232, Stroube St | 1 | - | 1
| 2 | 1 |
| 10 | Jun 6, 2006 10:32 AM | Us-101 | 2 | - | 1
| 2 | - |
| 11 | Sep 6, 2006 08:53 PM | Harbor Blvd | 2 | - | 1
| 3 | - |
| 12 | Aug 21, 2006 07:07 AM | Victoria Ave | 3 | - | 1
| 3 | - |
| 13 | Sep 25, 2006 02:13 PM | Ventura Rd, Wooley Rd | 1 | - | 1
| 2 | 1 |
| 14 | Nov 27, 2006 06:13 AM | 5th St | 1 | - | 1
| 1 | - |
Oxnard fatal car crash and road traffic accident list for 2005
- Fatal accident count11
- Vehicles involved in fatal accidents18
- Fatal accidents involving drunk persons3
- Fatalities13
- Persons involved in fatal accidents34
- Pedestrians involved in fatal accidents3
Dark - Lighted
- Oxnard(Based on 11 reports) 54.5%
- Ventura County(Based on 63 reports) 25.4%
- California(Based on 3,842 reports) 24.4%
Daylight
- Oxnard(Based on 11 reports) 45.5%
- Ventura County(Based on 63 reports) 57.1%
- California(Based on 3,842 reports) 46.3%
Clear
- Oxnard(Based on 11 reports) 90.9%
- Ventura County(Based on 63 reports) 90.5%
- California(Based on 3,849 reports) 92.3%
Rain
- Oxnard(Based on 11 reports) 9.1%
- Ventura County(Based on 63 reports) 9.5%
- California(Based on 3,849 reports) 5.8%
| # | Date | Location | Vehicles | Drunk persons | Fatalites | Persons | Pedestrians |
|---|
| 1 | Jan 5, 2005 05:23 PM | Barn Rd | 1 | 1
| 1 | 3 | 2 |
| 2 | Feb 5, 2005 03:12 PM | Del Norte Blvd, Sturgis Rd | 2 | - | 1
| 10 | - |
| 3 | Mar 10, 2005 02:41 PM | Wooley Rd, C St | 2 | - | 1
| 2 | - |
| 4 | May 1, 2005 04:38 AM | Rose Ave, Tiesa Ln | 1 | - | 1
| 2 | - |
| 5 | Apr 1, 2005 12:45 AM | Us-101 | 2 | - | 1
| 1 | - |
| 6 | Mar 21, 2005 11:16 PM | Saviers Rd, Channel Islands Blvd | 2 | 1
| 1 | 3 | - |
| 7 | Jul 24, 2005 06:30 PM | Balboa St | 1 | - | 1
| 2 | 1 |
| 8 | Sep 25, 2005 01:51 AM | Rice Ave, Sr-34 | 2 | - | 2
| 5 | - |
| 9 | Oct 19, 2005 07:14 PM | Justin Way | 2 | - | 1
| 1 | - |
| 10 | Sep 27, 2005 04:25 PM | Us-101 Ramp | 2 | - | 2
| 4 | - |
| 11 | Dec 23, 2005 01:00 AM | Harbor Blvd | 1 | 1
| 1 | 1 | - |
Oxnard fatal car crash and road traffic accident list for 2004
- Fatal accident count11
- Vehicles involved in fatal accidents17
- Fatal accidents involving drunk persons6
- Fatalities11
- Persons involved in fatal accidents34
- Pedestrians involved in fatal accidents3
Daylight
- Oxnard(Based on 11 reports) 54.5%
- Ventura County(Based on 66 reports) 53.0%
- California(Based on 3,720 reports) 47.3%
Dark - Lighted
- Oxnard(Based on 11 reports) 27.3%
- Ventura County(Based on 66 reports) 19.7%
- California(Based on 3,720 reports) 23.6%
Dark - Not Lighted
- Oxnard(Based on 11 reports) 9.1%
- Ventura County(Based on 66 reports) 22.7%
- California(Based on 3,720 reports) 24.7%
Dawn
- Oxnard(Based on 11 reports) 9.1%
- Ventura County(Based on 66 reports) 1.5%
- California(Based on 3,720 reports) 2.0%
Clear
- Oxnard(Based on 11 reports) 100.0%
- Ventura County(Based on 66 reports) 89.4%
- California(Based on 3,727 reports) 93.5%
| # | Date | Location | Vehicles | Drunk persons | Fatalites | Persons | Pedestrians |
|---|
| 1 | Jan 11, 2004 03:50 AM | Sr-118, Santa Clara Ave | 1 | 1
| 1 | 1 | - |
| 2 | Feb 25, 2004 07:58 AM | Ventura Rd, Teal Club Rd | 2 | - | 1
| 4 | - |
| 3 | Apr 29, 2004 10:15 PM | 5th St | 1 | 1
| 1 | 1 | - |
| 4 | May 25, 2004 04:42 AM | Rice Ave | 1 | - | 1
| 3 | - |
| 5 | May 19, 2004 04:27 PM | 3rd St, Garfield Ave | 4 | - | 1
| 5 | - |
| 6 | Jul 25, 2004 02:55 PM | C St | 1 | 1
| 1 | 2 | 1 |
| 7 | Sep 3, 2004 06:05 PM | Ventura Rd, 2nd St | 3 | - | 1
| 8 | - |
| 8 | Oct 8, 2004 05:00 PM | Camino Del Sol | 1 | 1
| 1 | 3 | - |
| 9 | Oct 18, 2004 07:23 PM | Channel Islands Blvd | 1 | 1
| 1 | 3 | 1 |
| 10 | Oct 25, 2004 03:44 PM | Hamilton Ave | 1 | - | 1
| 2 | 1 |
| 11 | Dec 8, 2004 08:57 PM | Richmond Ave | 1 | 1
| 1 | 2 | - |
Oxnard fatal car crash and road traffic accident list for 2003
- Fatal accident count10
- Vehicles involved in fatal accidents14
- Fatal accidents involving drunk persons4
- Fatalities10
- Persons involved in fatal accidents36
- Pedestrians involved in fatal accidents4
Daylight
- Oxnard(Based on 10 reports) 60.0%
- Ventura County(Based on 72 reports) 54.2%
- California(Based on 3,724 reports) 48.3%
Dark - Lighted
- Oxnard(Based on 10 reports) 30.0%
- Ventura County(Based on 72 reports) 15.3%
- California(Based on 3,724 reports) 22.7%
Dark - Not Lighted
- Oxnard(Based on 10 reports) 10.0%
- Ventura County(Based on 72 reports) 26.4%
- California(Based on 3,724 reports) 25.5%
Clear
- Oxnard(Based on 10 reports) 100.0%
- Ventura County(Based on 72 reports) 94.4%
- California(Based on 3,731 reports) 93.3%
| # | Date | Location | Vehicles | Drunk persons | Fatalites | Persons | Pedestrians |
|---|
| 1 | Jan 11, 2003 08:51 PM | Auto Center Dr | 1 | 1
| 1 | 1 | - |
| 2 | Jan 10, 2003 04:42 PM | Rose Ave | 1 | - | 1
| 2 | 1 |
| 3 | Feb 3, 2003 06:40 PM | Channel Island Blvd | 1 | 1
| 1 | 2 | 1 |
| 4 | Mar 28, 2003 04:40 PM | Rice Ave | 2 | - | 1
| 4 | 1 |
| 5 | Apr 15, 2003 05:51 AM | 5th St | 1 | - | 1
| 2 | 1 |
| 6 | Apr 23, 2003 01:49 PM | Hueneme Rd | 2 | - | 1
| 14 | - |
| 7 | Sep 4, 2003 06:30 PM | Channel Islands Blvd | 2 | - | 1
| 2 | - |
| 8 | Sep 8, 2003 01:35 AM | Hueneme Rd | 1 | 1
| 1 | 2 | - |
| 9 | Nov 22, 2003 01:15 PM | Pleasant Valley Rd | 1 | 1
| 1 | 1 | - |
| 10 | Jun 23, 2003 11:29 AM | Sr-34 | 2 | - | 1
| 6 | - |
Oxnard fatal car crash and road traffic accident list for 2002
- Fatal accident count11
- Vehicles involved in fatal accidents16
- Fatal accidents involving drunk persons3
- Fatalities11
- Persons involved in fatal accidents27
- Pedestrians involved in fatal accidents6
Dark - Lighted
- Oxnard(Based on 11 reports) 63.6%
- Ventura County(Based on 62 reports) 25.8%
- California(Based on 3,640 reports) 22.7%
Dawn
- Oxnard(Based on 11 reports) 18.2%
- Ventura County(Based on 62 reports) 4.8%
- California(Based on 3,640 reports) 1.8%
Daylight
- Oxnard(Based on 11 reports) 9.1%
- Ventura County(Based on 62 reports) 43.5%
- California(Based on 3,640 reports) 46.9%
Dark - Not Lighted
- Oxnard(Based on 11 reports) 9.1%
- Ventura County(Based on 62 reports) 19.4%
- California(Based on 3,640 reports) 26.0%
Clear
- Oxnard(Based on 11 reports) 100.0%
- Ventura County(Based on 62 reports) 95.2%
- California(Based on 3,654 reports) 93.8%
| # | Date | Location | Vehicles | Drunk persons | Fatalites | Persons | Pedestrians |
|---|
| 1 | Feb 23, 2002 06:49 PM | Pleasant Valley Rd | 1 | 1
| 1 | 2 | 1 |
| 2 | Jan 1, 2002 04:20 AM | Ventura Rd | 1 | 1
| 1 | 2 | 1 |
| 3 | Mar 16, 2002 09:48 PM | Sr-1 | 1 | - | 1
| 2 | 1 |
| 4 | Aug 2, 2002 05:24 AM | Harbor Blvd | 2 | - | 1
| 2 | - |
| 5 | Mar 23, 2002 00:03 AM | Sr-1 | 2 | - | 1
| 4 | - |
| 6 | Oct 10, 2002 05:15 AM | Santa Clara Ave | 2 | - | 1
| 2 | - |
| 7 | Oct 16, 2002 06:58 PM | Rose Ave | 2 | - | 1
| 3 | 1 |
| 8 | Nov 21, 2002 01:51 AM | 5th St | 2 | 1
| 1 | 4 | - |
| 9 | Dec 10, 2002 06:24 AM | Gonzales Rd | 1 | - | 1
| 1 | - |
| 10 | Dec 20, 2002 06:17 AM | Ventura Rd | 1 | - | 1
| 3 | 1 |
| 11 | Sep 14, 2002 04:15 PM | C St | 1 | - | 1
| 2 | 1 |
Oxnard fatal car crash and road traffic accident list for 2001
- Fatal accident count15
- Vehicles involved in fatal accidents24
- Fatal accidents involving drunk persons7
- Fatalities17
- Persons involved in fatal accidents53
- Pedestrians involved in fatal accidents5
Daylight
- Oxnard(Based on 15 reports) 53.3%
- Ventura County(Based on 65 reports) 56.9%
- California(Based on 3,532 reports) 48.8%
Dark - Lighted
- Oxnard(Based on 15 reports) 33.3%
- Ventura County(Based on 65 reports) 18.5%
- California(Based on 3,532 reports) 22.6%
Dusk
- Oxnard(Based on 15 reports) 6.7%
- Ventura County(Based on 65 reports) 4.6%
- California(Based on 3,532 reports) 2.2%
Dark - Not Lighted
- Oxnard(Based on 15 reports) 6.7%
- Ventura County(Based on 65 reports) 18.5%
- California(Based on 3,532 reports) 24.3%
Clear
- Oxnard(Based on 15 reports) 86.7%
- Ventura County(Based on 66 reports) 89.4%
- California(Based on 3,543 reports) 92.0%
Rain
- Oxnard(Based on 15 reports) 13.3%
- Ventura County(Based on 66 reports) 9.1%
- California(Based on 3,543 reports) 6.0%
| # | Date | Location | Vehicles | Drunk persons | Fatalites | Persons | Pedestrians |
|---|
| 1 | Jan 20, 2001 11:00 PM | Statham Blvd | 1 | 1
| 1 | 2 | - |
| 2 | Apr 17, 2001 03:33 PM | Rice Ave | 1 | - | 2
| 2 | - |
| 3 | Mar 30, 2001 05:50 PM | 3rd Street | 3 | - | 1
| 5 | - |
| 4 | May 18, 2001 01:47 PM | Sr-232 | 2 | - | 1
| 3 | - |
| 5 | May 22, 2001 01:00 PM | Sr-232 | 1 | 1
| 1 | 2 | 1 |
| 6 | Aug 4, 2001 11:35 AM | Victoria Ave | 2 | - | 1
| 5 | - |
| 7 | Jul 8, 2001 03:04 PM | Rice Ave | 4 | - | 1
| 10 | - |
| 8 | Sep 26, 2001 05:34 PM | Ventura Rd | 2 | - | 2
| 4 | - |
| 9 | Jul 15, 2001 03:39 PM | Hueneme Rd | 1 | 1
| 1 | 1 | - |
| 10 | Nov 24, 2001 09:44 AM | A St | 1 | - | 1
| 2 | 1 |
| 11 | Jun 28, 2001 08:50 PM | 3rd St | 1 | - | 1
| 7 | 1 |
| 12 | Dec 9, 2001 11:48 PM | Rose Ave | 2 | 1
| 1 | 2 | - |
| 13 | Dec 22, 2001 01:42 AM | Commercial Ave | 1 | 1
| 1 | 3 | - |
| 14 | Dec 21, 2001 06:10 AM | Pleasant Valley Rd | 1 | 1
| 1 | 3 | 1 |
| 15 | Sep 22, 2001 09:10 PM | Wooley Rd | 1 | 1
| 1 | 2 | 1 |
Oxnard fatal car crash and road traffic accident list for 2000
- Fatal accident count15
- Vehicles involved in fatal accidents22
- Fatal accidents involving drunk persons3
- Fatalities15
- Persons involved in fatal accidents42
- Pedestrians involved in fatal accidents7
Daylight
- Oxnard(Based on 15 reports) 53.3%
- Ventura County(Based on 83 reports) 47.0%
- California(Based on 3,343 reports) 48.2%
Dark - Lighted
- Oxnard(Based on 15 reports) 40.0%
- Ventura County(Based on 83 reports) 25.3%
- California(Based on 3,343 reports) 22.7%
Dark - Not Lighted
- Oxnard(Based on 15 reports) 6.7%
- Ventura County(Based on 83 reports) 24.1%
- California(Based on 3,343 reports) 24.9%
Clear
- Oxnard(Based on 15 reports) 93.3%
- Ventura County(Based on 83 reports) 92.8%
- California(Based on 3,348 reports) 93.2%
Rain
- Oxnard(Based on 15 reports) 6.7%
- Ventura County(Based on 83 reports) 6.0%
- California(Based on 3,348 reports) 4.9%
| # | Date | Location | Vehicles | Drunk persons | Fatalites | Persons | Pedestrians |
|---|
| 1 | Feb 27, 2000 02:40 AM | Plesant Valley Road | 1 | 1
| 1 | 1 | - |
| 2 | Apr 2, 2000 03:25 AM | Sr-1 | 1 | 1
| 1 | 2 | 1 |
| 3 | May 19, 2000 02:25 PM | Sr-34 | 1 | - | 1
| 2 | 1 |
| 4 | Jul 27, 2000 08:47 PM | Saviers Rd | 1 | - | 1
| 2 | 1 |
| 5 | Jun 30, 2000 02:05 PM | Sr-232 | 1 | - | 1
| 1 | - |
| 6 | Mar 8, 2000 05:34 AM | Us-101 | 3 | - | 1
| 3 | - |
| 7 | Sep 12, 2000 02:42 PM | Private Roadway | 1 | - | 1
| 1 | - |
| 8 | Oct 10, 2000 05:12 PM | Santa Clara Ave | 2 | - | 1
| 5 | - |
| 9 | Oct 7, 2000 01:30 PM | Sr-34 | 2 | - | 1
| 3 | - |
| 10 | Nov 16, 2000 06:50 AM | Pleasant Valley Rd | 2 | - | 1
| 5 | - |
| 11 | Dec 11, 2000 06:15 AM | Rose Ave | 2 | - | 1
| 5 | - |
| 12 | Dec 20, 2000 08:35 AM | 4th St | 1 | - | 1
| 2 | 1 |
| 13 | Dec 28, 2000 05:30 AM | Hueneme Rd | 2 | - | 1
| 4 | - |
| 14 | Nov 16, 2000 04:30 PM | Wagon Wheel Rd | 1 | - | 1
| 3 | 2 |
| 15 | Dec 31, 2000 05:35 PM | Channel Island Blvd | 1 | 1
| 1 | 3 | 1 |
Oxnard fatal car crash and road traffic accident list for 1999
- Fatal accident count8
- Vehicles involved in fatal accidents14
- Fatal accidents involving drunk persons2
- Fatalities8
- Persons involved in fatal accidents24
- Pedestrians involved in fatal accidents1
Daylight
- Oxnard(Based on 8 reports) 62.5%
- Ventura County(Based on 53 reports) 54.7%
- California(Based on 3,137 reports) 48.1%
Dark - Lighted
- Oxnard(Based on 8 reports) 37.5%
- Ventura County(Based on 53 reports) 18.9%
- California(Based on 3,137 reports) 22.8%
Clear
- Oxnard(Based on 8 reports) 87.5%
- Ventura County(Based on 53 reports) 98.1%
- California(Based on 3,148 reports) 93.8%
Fog, Smog, Smoke
- Oxnard(Based on 8 reports) 12.5%
- Ventura County(Based on 53 reports) 1.9%
- California(Based on 3,148 reports) 1.4%
| # | Date | Location | Vehicles | Drunk persons | Fatalites | Persons | Pedestrians |
|---|
| 1 | Jun 1, 1999 06:15 AM | Sr-1 | 1 | - | 1
| 1 | - |
| 2 | Jul 9, 1999 05:34 PM | C St | 1 | - | 1
| 2 | 1 |
| 3 | Jun 2, 1999 12:15 AM | Gonzalez Rd | 1 | - | 1
| 3 | - |
| 4 | Oct 15, 1999 10:49 PM | Auto Center Drive | 2 | 1
| 1 | 2 | - |
| 5 | Oct 22, 1999 06:17 AM | Rose Ave | 2 | - | 1
| 4 | - |
| 6 | Dec 10, 1999 04:11 PM | Hueneme Rd | 2 | - | 1
| 2 | - |
| 7 | Dec 20, 1999 09:09 AM | Gonzalez Rr | 3 | - | 1
| 5 | - |
| 8 | Dec 21, 1999 07:38 PM | Rice Ave | 2 | 1
| 1 | 5 | - |
Oxnard fatal car crash and road traffic accident list for 1998
- Fatal accident count7
- Vehicles involved in fatal accidents9
- Fatal accidents involving drunk persons1
- Fatalities8
- Persons involved in fatal accidents21
- Pedestrians involved in fatal accidents4
Dark - Lighted
- Oxnard(Based on 7 reports) 57.1%
- Ventura County(Based on 56 reports) 23.2%
- California(Based on 3,110 reports) 22.2%
Daylight
- Oxnard(Based on 7 reports) 42.9%
- Ventura County(Based on 56 reports) 53.6%
- California(Based on 3,110 reports) 49.0%
Clear
- Oxnard(Based on 7 reports) 100.0%
- Ventura County(Based on 56 reports) 94.6%
- California(Based on 3,112 reports) 89.7%
| # | Date | Location | Vehicles | Drunk persons | Fatalites | Persons | Pedestrians |
|---|
| 1 | Jan 11, 1998 08:31 PM | Us-101 | 1 | - | 1
| 5 | 1 |
| 2 | Feb 25, 1998 06:33 PM | Rose Ave | 1 | - | 1
| 2 | 1 |
| 3 | Feb 28, 1998 10:13 AM | Channel Island Blvd | 2 | - | 1
| 3 | - |
| 4 | Jul 23, 1998 08:46 PM | Ventura Rd | 1 | 1
| 1 | 2 | - |
| 5 | Jun 20, 1998 11:51 AM | Rice Ave | 2 | - | 2
| 4 | - |
| 6 | Nov 23, 1998 09:59 AM | Ventura Road | 1 | - | 1
| 2 | 1 |
| 7 | Dec 14, 1998 09:41 PM | Sr-1 | 1 | - | 1
| 3 | 1 |
Oxnard fatal car crash and road traffic accident list for 1997
- Fatal accident count10
- Vehicles involved in fatal accidents14
- Fatal accidents involving drunk persons3
- Fatalities11
- Persons involved in fatal accidents33
- Pedestrians involved in fatal accidents5
Daylight
- Oxnard(Based on 10 reports) 60.0%
- Ventura County(Based on 58 reports) 62.1%
- California(Based on 3,271 reports) 49.1%
Dusk
- Oxnard(Based on 10 reports) 20.0%
- Ventura County(Based on 58 reports) 3.4%
- California(Based on 3,271 reports) 2.3%
Dark - Lighted
- Oxnard(Based on 10 reports) 10.0%
- Ventura County(Based on 58 reports) 19.0%
- California(Based on 3,271 reports) 21.9%
Dark - Not Lighted
- Oxnard(Based on 10 reports) 10.0%
- Ventura County(Based on 58 reports) 12.1%
- California(Based on 3,271 reports) 24.6%
Clear
- Oxnard(Based on 10 reports) 100.0%
- Ventura County(Based on 58 reports) 96.6%
- California(Based on 3,279 reports) 93.8%
| # | Date | Location | Vehicles | Drunk persons | Fatalites | Persons | Pedestrians |
|---|
| 1 | Feb 19, 1997 07:41 AM | Hill St | 1 | - | 1
| 2 | 1 |
| 2 | Mar 23997 07:30 AM | 1 | 1 | - | 1
| 2 | - |
| 3 | Mar 15, 1997 08:20 AM | Saviers Rd | 1 | - | 1
| 2 | 1 |
| 4 | May 17, 1997 07:58 PM | Wooley Rd | 2 | 1
| 1 | 3 | - |
| 5 | May 10997 04:19 PM | 1 | 1 | 1
| 1 | 2 | 1 |
| 6 | Jun 15, 1997 09:59 PM | Hueneme Rd | 2 | 1
| 2 | 7 | - |
| 7 | Jul 10, 1997 10:55 AM | Patterson | 2 | - | 1
| 5 | - |
| 8 | May 21, 1997 08:56 PM | Saviers Rd | 2 | - | 1
| 5 | 1 |
| 9 | Aug 24, 1997 07:15 PM | 34 | 1 | - | 1
| 2 | 1 |
| 10 | Sep 26, 1997 03:15 AM | 101 | 1 | - | 1
| 3 | - |
Oxnard fatal car crash and road traffic accident list for 1996
- Fatal accident count12
- Vehicles involved in fatal accidents25
- Fatal accidents involving drunk persons6
- Fatalities12
- Persons involved in fatal accidents50
- Pedestrians involved in fatal accidents3
Daylight
- Oxnard(Based on 12 reports) 41.7%
- Ventura County(Based on 63 reports) 49.2%
- California(Based on 3,568 reports) 46.5%
Dark - Lighted
- Oxnard(Based on 12 reports) 41.7%
- Ventura County(Based on 63 reports) 25.4%
- California(Based on 3,568 reports) 23.8%
Dawn
- Oxnard(Based on 12 reports) 8.3%
- Ventura County(Based on 63 reports) 6.3%
- California(Based on 3,568 reports) 2.2%
Dark - Not Lighted
- Oxnard(Based on 12 reports) 8.3%
- Ventura County(Based on 63 reports) 17.5%
- California(Based on 3,568 reports) 25.2%
Clear
- Oxnard(Based on 12 reports) 83.3%
- Ventura County(Based on 63 reports) 92.1%
- California(Based on 3,576 reports) 91.7%
Rain
- Oxnard(Based on 12 reports) 8.3%
- Ventura County(Based on 63 reports) 6.3%
- California(Based on 3,576 reports) 6.4%
Fog, Smog, Smoke
- Oxnard(Based on 12 reports) 8.3%
- Ventura County(Based on 63 reports) 1.6%
- California(Based on 3,576 reports) 1.3%
| # | Date | Location | Vehicles | Drunk persons | Fatalites | Persons | Pedestrians |
|---|
| 1 | Mar 21, 1996 04:35 PM | 101 | 3 | - | 1
| 4 | - |
| 2 | Mar 9, 1996 03:08 AM | 34 | 1 | 1
| 1 | 2 | - |
| 3 | May 2, 1996 08:34 PM | Rice Ave | 2 | 2
| 1 | 2 | - |
| 4 | May 8996 12:39 AM | 1 | 4 | - | 1
| 6 | - |
| 5 | Jul 11, 1996 12:19 AM | 101 | 2 | - | 1
| 4 | - |
| 6 | Jul 8, 1996 04:12 AM | Saviers Rd | 1 | - | 1
| 2 | 1 |
| 7 | Sep 7, 1996 10:00 PM | Saviers Rd | 2 | 1
| 1 | 11 | - |
| 8 | Nov 12, 1996 04:15 PM | Rice Ave | 2 | - | 1
| 2 | - |
| 9 | Oct 8, 1996 06:32 AM | Camino Del | 1 | - | 1
| 3 | 1 |
| 10 | Dec 11, 1996 05:31 PM | K Street | 1 | - | 1
| 2 | 1 |
| 11 | Oct 1, 1996 04:25 PM | Ventura Rd | 4 | 1
| 1 | 8 | - |
| 12 | Nov 22, 1996 06:45 PM | 101 | 2 | 1
| 1 | 4 | - |
Oxnard fatal car crash and road traffic accident list for 1995
- Fatal accident count15
- Vehicles involved in fatal accidents24
- Fatal accidents involving drunk persons9
- Fatalities16
- Persons involved in fatal accidents49
- Pedestrians involved in fatal accidents3
Daylight
- Oxnard(Based on 15 reports) 33.3%
- Ventura County(Based on 75 reports) 48.0%
- California(Based on 3,669 reports) 46.7%
Dark - Not Lighted
- Oxnard(Based on 15 reports) 33.3%
- Ventura County(Based on 75 reports) 30.7%
- California(Based on 3,669 reports) 26.2%
Dark - Lighted
- Oxnard(Based on 15 reports) 26.7%
- Ventura County(Based on 75 reports) 16.0%
- California(Based on 3,669 reports) 22.9%
Dawn
- Oxnard(Based on 15 reports) 6.7%
- Ventura County(Based on 75 reports) 4.0%
- California(Based on 3,669 reports) 1.9%
Clear
- Oxnard(Based on 15 reports) 93.3%
- Ventura County(Based on 75 reports) 96.0%
- California(Based on 3,669 reports) 91.0%
Rain
- Oxnard(Based on 15 reports) 6.7%
- Ventura County(Based on 75 reports) 4.0%
- California(Based on 3,669 reports) 7.0%
| # | Date | Location | Vehicles | Drunk persons | Fatalites | Persons | Pedestrians |
|---|
| 1 | Jan 22, 1995 09:30 AM | 34 | 2 | - | 1
| 6 | - |
| 2 | Jan 10, 1995 05:40 PM | 2nd St | 1 | - | 1
| 2 | 1 |
| 3 | Mar 5995 05:55 PM | 1 | 2 | 1
| 1 | 2 | - |
| 4 | Mar 12, 1995 04:00 PM | Saviers Rd | 1 | - | 1
| 2 | 1 |
| 5 | Mar 12, 1995 09:00 PM | Hueneme Rd | 1 | 1
| 1 | 4 | - |
| 6 | Mar 25, 1995 02:00 AM | Hueneme Rd | 2 | 1
| 1 | 5 | - |
| 7 | May 28, 1995 00:10 AM | Rose Ave | 2 | 1
| 1 | 6 | - |
| 8 | Jun 10, 1995 11:25 PM | Hueneme Rd | 2 | 2
| 2 | 6 | - |
| 9 | Jul 9, 1995 02:23 PM | C Street | 1 | - | 1
| 2 | 1 |
| 10 | Aug 31, 1995 05:53 AM | Hueneme Rd | 2 | - | 1
| 6 | - |
| 11 | Jul 12, 1995 10:58 AM | Rice Ave | 2 | - | 1
| 2 | - |
| 12 | Sep 9, 1995 07:45 PM | Harbor Bl | 1 | 1
| 1 | 1 | - |
| 13 | Sep 26, 1995 11:10 AM | Pleasantly | 2 | - | 1
| 2 | - |
| 14 | Dec 6, 1995 02:04 AM | Ventura Rd | 2 | 1
| 1 | 2 | - |
| 15 | Dec 4, 1995 01:30 AM | Hueneme Rd | 1 | 1
| 1 | 1 | - |
Oxnard fatal car crash and road traffic accident list for 1994
- Fatal accident count11
- Vehicles involved in fatal accidents16
- Fatal accidents involving drunk persons3
- Fatalities11
- Persons involved in fatal accidents35
- Pedestrians involved in fatal accidents6
Daylight
- Oxnard(Based on 11 reports) 54.5%
- Ventura County(Based on 77 reports) 59.7%
- California(Based on 3,784 reports) 48.6%
Dark - Lighted
- Oxnard(Based on 11 reports) 27.3%
- Ventura County(Based on 77 reports) 14.3%
- California(Based on 3,784 reports) 23.3%
Dark - Not Lighted
- Oxnard(Based on 11 reports) 18.2%
- Ventura County(Based on 77 reports) 20.8%
- California(Based on 3,784 reports) 23.9%
Clear
- Oxnard(Based on 11 reports) 81.8%
- Ventura County(Based on 77 reports) 93.5%
- California(Based on 3,787 reports) 93.1%
Rain
- Oxnard(Based on 11 reports) 18.2%
- Ventura County(Based on 77 reports) 5.2%
- California(Based on 3,787 reports) 5.1%
| # | Date | Location | Vehicles | Drunk persons | Fatalites | Persons | Pedestrians |
|---|
| 1 | Jan 13, 1994 02:20 PM | 5th Street | 1 | - | 1
| 3 | 2 |
| 2 | Mar 24, 1994 03:14 PM | Ventura Rd | 1 | 1
| 1 | 2 | - |
| 3 | Mar 6, 1994 04:10 AM | Hueneme Rd | 1 | 1
| 1 | 5 | - |
| 4 | Apr 22, 1994 04:55 PM | Fournierst | 1 | - | 1
| 3 | 1 |
| 5 | May 7994 02:20 AM | 1 | 1 | 1
| 1 | 2 | 1 |
| 6 | Jul 4, 1994 12:20 AM | Chanlislds | 2 | - | 1
| 3 | - |
| 7 | Aug 1, 1994 03:42 PM | Ventura Rd | 2 | - | 1
| 5 | - |
| 8 | Sep 20, 1994 05:45 AM | Rice Ave | 2 | - | 1
| 4 | - |
| 9 | Oct 25, 1994 10:58 AM | Ventura Rd | 3 | - | 1
| 4 | - |
| 10 | Nov 17994 05:35 AM | 1 | 1 | - | 1
| 2 | 1 |
| 11 | Dec 3, 1994 09:20 PM | Patriciast | 1 | - | 1
| 2 | 1 |
Oxnard fatal car crash and road traffic accident list for 1993
- Fatal accident count14
- Vehicles involved in fatal accidents16
- Fatal accidents involving drunk persons6
- Fatalities15
- Persons involved in fatal accidents35
- Pedestrians involved in fatal accidents13
Dark - Lighted
- Oxnard(Based on 14 reports) 57.1%
- Ventura County(Based on 62 reports) 27.4%
- California(Based on 3,682 reports) 24.0%
Daylight
- Oxnard(Based on 14 reports) 28.6%
- Ventura County(Based on 62 reports) 46.8%
- California(Based on 3,682 reports) 46.1%
Dark - Not Lighted
- Oxnard(Based on 14 reports) 14.3%
- Ventura County(Based on 62 reports) 25.8%
- California(Based on 3,682 reports) 26.0%
Clear
- Oxnard(Based on 14 reports) 100.0%
- Ventura County(Based on 63 reports) 95.2%
- California(Based on 3,687 reports) 93.4%
| # | Date | Location | Vehicles | Drunk persons | Fatalites | Persons | Pedestrians |
|---|
| 1 | Jan 10, 1993 05:45 PM | Hemlock St | 1 | - | 1
| 4 | 1 |
| 2 | Mar 21, 1993 09:35 PM | Channelisl | 1 | 1
| 1 | 2 | 1 |
| 3 | Mar 27, 1993 01:45 AM | Rose Ave | 2 | 1
| 1 | 2 | - |
| 4 | Apr 30, 1993 08:06 PM | Ventura Rd | 1 | - | 1
| 3 | 1 |
| 5 | May 2993 01:41 AM | 1 | 1 | 1
| 2 | 4 | 3 |
| 6 | May 15993 03:15 AM | 1 | 1 | - | 1
| 2 | 1 |
| 7 | Jun 30, 1993 08:58 PM | Wooleyroad | 1 | 1
| 1 | 2 | 1 |
| 8 | Jul 10, 1993 04:25 PM | Thrid St | 1 | - | 1
| 2 | 1 |
| 9 | Oct 1993 03:10 PM | 1 | 2 | - | 1
| 5 | - |
| 10 | Oct 30, 1993 05:45 AM | Plsntvlyrd | 1 | - | 1
| 2 | 1 |
| 11 | Oct 28, 1993 09:54 AM | Wooley Rd | 1 | - | 1
| 3 | 2 |
| 12 | Oct 31, 1993 02:13 AM | Victoriaav | 1 | - | 1
| 2 | 1 |
| 13 | Nov 7, 1993 09:38 PM | 34 | 1 | 1
| 1 | 1 | - |
| 14 | Dec 20, 1993 08:55 PM | Rice Ave | 1 | 1
| 1 | 1 | - |
Oxnard fatal car crash and road traffic accident list for 1992
- Fatal accident count10
- Vehicles involved in fatal accidents13
- Fatal accidents involving drunk persons1
- Fatalities10
- Persons involved in fatal accidents30
- Pedestrians involved in fatal accidents6
Dark - Lighted
- Oxnard(Based on 10 reports) 80.0%
- Ventura County(Based on 70 reports) 22.9%
- California(Based on 3,717 reports) 25.2%
Daylight
- Oxnard(Based on 10 reports) 10.0%
- Ventura County(Based on 70 reports) 48.6%
- California(Based on 3,717 reports) 45.5%
Dark - Not Lighted
- Oxnard(Based on 10 reports) 10.0%
- Ventura County(Based on 70 reports) 24.3%
- California(Based on 3,717 reports) 25.6%
Clear
- Oxnard(Based on 10 reports) 90.0%
- Ventura County(Based on 70 reports) 94.3%
- California(Based on 3,722 reports) 92.3%
Rain
- Oxnard(Based on 10 reports) 10.0%
- Ventura County(Based on 70 reports) 5.7%
- California(Based on 3,722 reports) 6.3%
| # | Date | Location | Vehicles | Drunk persons | Fatalites | Persons | Pedestrians |
|---|
| 1 | Jan 8, 1992 06:00 PM | Offshorest | 1 | - | 1
| 2 | 1 |
| 2 | Jan 11, 1992 11:17 PM | Delnortebl | 1 | - | 1
| 1 | - |
| 3 | Jan 13, 1992 06:20 PM | Channelisl | 1 | - | 1
| 2 | 1 |
| 4 | Mar 15, 1992 11:47 PM | Ventura Rd | 1 | - | 1
| 1 | - |
| 5 | Mar 17, 1992 09:00 PM | Hemlock St | 1 | - | 1
| 2 | 1 |
| 6 | Mar 29, 1992 06:10 PM | 34 | 3 | 1
| 1 | 13 | - |
| 7 | Apr 17992 10:15 PM | 1 | 1 | - | 1
| 2 | 1 |
| 8 | Jun 6, 1992 09:17 PM | 34 | 1 | - | 1
| 2 | 1 |
| 9 | Dec 2, 1992 04:03 PM | Bard Road | 1 | - | 1
| 2 | 1 |
| 10 | Dec 29, 1992 06:15 AM | Hueneme Rd | 2 | - | 1
| 3 | - |
Oxnard fatal car crash and road traffic accident list for 1991
- Fatal accident count15
- Vehicles involved in fatal accidents27
- Fatal accidents involving drunk persons6
- Fatalities15
- Persons involved in fatal accidents46
- Pedestrians involved in fatal accidents4
Daylight
- Oxnard(Based on 15 reports) 53.3%
- Ventura County(Based on 63 reports) 42.9%
- California(Based on 4,189 reports) 45.2%
Dark - Lighted
- Oxnard(Based on 15 reports) 33.3%
- Ventura County(Based on 63 reports) 25.4%
- California(Based on 4,189 reports) 25.1%
Dusk
- Oxnard(Based on 15 reports) 6.7%
- Ventura County(Based on 63 reports) 3.2%
- California(Based on 4,189 reports) 2.1%
Dark - Not Lighted
- Oxnard(Based on 15 reports) 6.7%
- Ventura County(Based on 63 reports) 28.6%
- California(Based on 4,189 reports) 25.8%
Clear
- Oxnard(Based on 15 reports) 93.3%
- Ventura County(Based on 63 reports) 92.1%
- California(Based on 4,194 reports) 93.7%
Rain
- Oxnard(Based on 15 reports) 6.7%
- Ventura County(Based on 63 reports) 3.2%
- California(Based on 4,194 reports) 4.2%
| # | Date | Location | Vehicles | Drunk persons | Fatalites | Persons | Pedestrians |
|---|
| 1 | Feb 16, 1991 08:25 PM | Bard Road | 1 | 1
| 1 | 3 | - |
| 2 | Mar 9, 1991 01:20 PM | 101 | 2 | - | 1
| 3 | - |
| 3 | Mar 23, 1991 08:20 PM | Vineyardav | 1 | 1
| 1 | 3 | 1 |
| 4 | Apr 5991 09:47 PM | 1 | 1 | - | 1
| 2 | 1 |
| 5 | Apr 5, 1991 06:39 PM | 34 | 3 | 1
| 1 | 4 | - |
| 6 | Jun 30, 1991 08:22 PM | Ventura Rd | 2 | 1
| 1 | 2 | - |
| 7 | Jul 3991 03:01 PM | 1 | 1 | - | 1
| 3 | 2 |
| 8 | Jul 15, 1991 10:02 PM | 34 | 2 | 1
| 1 | 2 | - |
| 9 | Jul 22, 1991 02:23 PM | Rose Ave | 2 | - | 1
| 3 | - |
| 10 | Aug 28, 1991 12:05 AM | Viadelnrte | 4 | - | 1
| 4 | - |
| 11 | Sep 2, 1991 07:05 PM | 101 | 1 | - | 1
| 7 | - |
| 12 | Sep 5, 1991 02:19 PM | Victoriaav | 2 | - | 1
| 3 | - |
| 13 | Sep 11, 1991 08:05 PM | Hueneme Rd | 1 | - | 1
| 1 | - |
| 14 | Dec 26, 1991 07:05 AM | Hueneme Rd | 2 | - | 1
| 2 | - |
| 15 | Dec 28, 1991 08:21 PM | Pleasntvly | 2 | 1
| 1 | 4 | - |
Oxnard fatal car crash and road traffic accident list for 1990
- Fatal accident count11
- Vehicles involved in fatal accidents15
- Fatal accidents involving drunk persons4
- Fatalities11
- Persons involved in fatal accidents28
Daylight
- Oxnard(Based on 11 reports) 45.5%
- Ventura County(Based on 79 reports) 53.2%
- California(Based on 4,679 reports) 44.7%
Dark - Lighted
- Oxnard(Based on 11 reports) 45.5%
- Ventura County(Based on 79 reports) 16.5%
- California(Based on 4,679 reports) 25.0%
Dark - Not Lighted
- Oxnard(Based on 11 reports) 9.1%
- Ventura County(Based on 79 reports) 26.6%
- California(Based on 4,679 reports) 26.6%
Clear
- Oxnard(Based on 11 reports) 90.9%
- Ventura County(Based on 79 reports) 98.7%
- California(Based on 4,685 reports) 95.4%
Fog, Smog, Smoke
- Oxnard(Based on 11 reports) 9.1%
- Ventura County(Based on 79 reports) 1.3%
- California(Based on 4,685 reports) 0.7%
| # | Date | Location | Vehicles | Drunk persons | Fatalites | Persons | Pedestrians |
|---|
| 1 | Jan 12, 1990 03:29 PM | Plesantvly | 1 | - | 1
| 3 | - |
| 2 | Feb 9, 1990 08:07 PM | Saviers Rd | 2 | 1
| 1 | 4 | - |
| 3 | Feb 26, 1990 00:03 AM | Hueneme Rd | 1 | 1
| 1 | 1 | - |
| 4 | Jan 28, 1990 02:00 PM | 5th Street | 1 | - | 1
| 2 | - |
| 5 | May 19, 1990 05:58 PM | Ventura Rd | 3 | 1
| 1 | 5 | - |
| 6 | Jun 4, 1990 10:50 AM | Alley | 1 | - | 1
| 2 | - |
| 7 | Jul 16, 1990 06:55 PM | Hillstreet | 1 | - | 1
| 2 | - |
| 8 | Sep 23, 1990 00:29 AM | Saviers Rd | 1 | - | 1
| 2 | - |
| 9 | Oct 15, 1990 08:06 PM | Saviers Rd | 1 | 1
| 1 | 2 | - |
| 10 | Nov 21990 07:30 PM | 1 | 1 | - | 1
| 3 | - |
| 11 | Dec 28990 05:57 PM | 1 | 2 | - | 1
| 2 | - |
Oxnard fatal car crash and road traffic accident list for 1989
- Fatal accident count14
- Vehicles involved in fatal accidents20
- Fatal accidents involving drunk persons8
- Fatalities14
- Persons involved in fatal accidents51
Average EMS response time
- Oxnard(Based on 2 reports) 4.0 mins
- Ventura County(Based on 3 reports) 4.3 mins
- California(Based on 195 reports) 7.4 mins
Dark - Lighted
- Oxnard(Based on 14 reports) 50.0%
- Ventura County(Based on 95 reports) 27.4%
- California(Based on 4,869 reports) 22.2%
Daylight
- Oxnard(Based on 14 reports) 21.4%
- Ventura County(Based on 95 reports) 46.3%
- California(Based on 4,869 reports) 43.8%
Dark - Not Lighted
- Oxnard(Based on 14 reports) 21.4%
- Ventura County(Based on 95 reports) 20.0%
- California(Based on 4,869 reports) 29.5%
Dawn
- Oxnard(Based on 14 reports) 7.1%
- Ventura County(Based on 95 reports) 6.3%
- California(Based on 4,869 reports) 1.9%
Clear
- Oxnard(Based on 14 reports) 85.7%
- Ventura County(Based on 95 reports) 91.6%
- California(Based on 4,877 reports) 94.5%
Rain
- Oxnard(Based on 14 reports) 14.3%
- Ventura County(Based on 95 reports) 5.3%
- California(Based on 4,877 reports) 3.0%
| # | Date | Location | Vehicles | Drunk persons | Fatalites | Persons | Pedestrians |
|---|
| 1 | Jan 24, 1989 10:58 PM | Rice Ave | 3 | 1
| 1 | 7 | - |
| 2 | Feb 8, 1989 03:45 PM | Gonzalesrd | 1 | 1
| 1 | 1 | - |
| 3 | Mar 3, 1989 08:03 PM | 101 | 2 | - | 1
| 8 | - |
| 4 | Feb 25, 1989 01:15 PM | Hueneme Rd | 1 | 1
| 1 | 3 | - |
| 5 | Jan 14, 1989 06:45 PM | Ventura Rd | 1 | - | 1
| 5 | - |
| 6 | Mar 21, 1989 11:50 PM | 101 | 1 | 1
| 1 | 3 | - |
| 7 | Mar 28, 1989 06:05 AM | 7th Street | 2 | - | 1
| 3 | - |
| 8 | Mar 20, 1989 09:03 PM | Gonzalesrd | 1 | 1
| 1 | 4 | - |
| 9 | Jul 6989 11:45 PM | 1 | 2 | 1
| 1 | 3 | - |
| 10 | Aug 12, 1989 02:07 AM | C Street | 1 | - | 1
| 2 | - |
| 11 | Aug 27989 12:21 AM | 1 | 1 | - | 1
| 5 | - |
| 12 | Oct 15, 1989 07:51 PM | Pleasntvly | 2 | 1
| 1 | 4 | - |
| 13 | Nov 26989 01:56 AM | 1 | 1 | - | 1
| 1 | - |
| 14 | Dec 30989 02:15 AM | 1 | 1 | 1
| 1 | 2 | - |
Oxnard fatal car crash and road traffic accident list for 1988
- Fatal accident count16
- Vehicles involved in fatal accidents20
- Fatal accidents involving drunk persons4
- Fatalities16
- Persons involved in fatal accidents43
Dark - Lighted
- Oxnard(Based on 16 reports) 43.8%
- Ventura County(Based on 83 reports) 21.7%
- California(Based on 4,868 reports) 24.1%
Daylight
- Oxnard(Based on 16 reports) 37.5%
- Ventura County(Based on 83 reports) 37.3%
- California(Based on 4,868 reports) 43.7%
Dark - Not Lighted
- Oxnard(Based on 16 reports) 12.5%
- Ventura County(Based on 83 reports) 36.1%
- California(Based on 4,868 reports) 28.0%
Dawn
- Oxnard(Based on 16 reports) 6.3%
- Ventura County(Based on 83 reports) 2.4%
- California(Based on 4,868 reports) 1.6%
Clear
- Oxnard(Based on 16 reports) 93.8%
- Ventura County(Based on 84 reports) 95.2%
- California(Based on 4,875 reports) 94.0%
Fog, Smog, Smoke
- Oxnard(Based on 16 reports) 6.3%
- Ventura County(Based on 84 reports) 1.2%
- California(Based on 4,875 reports) 1.4%
| # | Date | Location | Vehicles | Drunk persons | Fatalites | Persons | Pedestrians |
|---|
| 1 | Feb 9, 1988 11:16 PM | Wooleyroad | 1 | - | 1
| 2 | - |
| 2 | Jan 14, 1988 03:50 PM | 101 | 3 | - | 1
| 7 | - |
| 3 | Mar 18, 1988 03:13 AM | Saviers Rd | 1 | 1
| 1 | 1 | - |
| 4 | Feb 6, 1988 10:20 PM | 101 | 1 | - | 1
| 2 | - |
| 5 | May 11988 00:57 AM | 1 | 1 | - | 1
| 2 | - |
| 6 | Jun 8, 1988 09:09 PM | Pleasntvly | 1 | 1
| 1 | 4 | - |
| 7 | Jun 13, 1988 10:19 PM | Ventura Rd | 1 | - | 1
| 2 | - |
| 8 | Jun 17, 1988 11:42 AM | Laurel St | 1 | 1
| 1 | 1 | - |
| 9 | Jun 27, 1988 02:04 PM | Pacificave | 2 | - | 1
| 2 | - |
| 10 | Apr 25, 1988 06:02 PM | Ventura Rd | 1 | - | 1
| 2 | - |
| 11 | Oct 2988 08:12 AM | 1 | 1 | - | 1
| 1 | - |
| 12 | Oct 6, 1988 09:25 AM | 101 | 1 | - | 1
| 2 | - |
| 13 | Oct 9988 08:56 PM | 1 | 1 | 1
| 1 | 2 | - |
| 14 | Aug 13, 1988 10:40 PM | Cloyne St | 1 | - | 1
| 9 | - |
| 15 | Oct 30988 01:32 AM | 1 | 1 | - | 1
| 2 | - |
| 16 | Aug 3, 1988 06:42 PM | J Street | 2 | - | 1
| 2 | - |
Oxnard fatal car crash and road traffic accident list for 1987
- Fatal accident count13
- Vehicles involved in fatal accidents25
- Fatal accidents involving drunk persons2
- Fatalities13
- Persons involved in fatal accidents37
Daylight
- Oxnard(Based on 13 reports) 53.8%
- Ventura County(Based on 90 reports) 45.6%
- California(Based on 4,923 reports) 43.9%
Dark - Lighted
- Oxnard(Based on 13 reports) 23.1%
- Ventura County(Based on 90 reports) 18.9%
- California(Based on 4,923 reports) 23.5%
Dark - Not Lighted
- Oxnard(Based on 13 reports) 15.4%
- Ventura County(Based on 90 reports) 33.3%
- California(Based on 4,923 reports) 28.9%
Dusk
- Oxnard(Based on 13 reports) 7.7%
- Ventura County(Based on 90 reports) 1.1%
- California(Based on 4,923 reports) 2.1%
Clear
- Oxnard(Based on 13 reports) 92.3%
- Ventura County(Based on 90 reports) 95.6%
- California(Based on 4,935 reports) 93.0%
Rain
- Oxnard(Based on 13 reports) 7.7%
- Ventura County(Based on 90 reports) 3.3%
- California(Based on 4,935 reports) 5.3%
| # | Date | Location | Vehicles | Drunk persons | Fatalites | Persons | Pedestrians |
|---|
| 1 | Jan 13, 1987 12:25 AM | Julian St | 1 | - | 1
| 2 | - |
| 2 | Feb 9, 1987 05:42 PM | Doris Ave | 2 | - | 1
| 2 | - |
| 3 | Feb 21, 1987 07:29 PM | 101 | 1 | - | 1
| 1 | - |
| 4 | Apr 4987 06:40 AM | 1 | 3 | - | 1
| 4 | - |
| 5 | Apr 2987 10:10 PM | 1 | 2 | - | 1
| 5 | - |
| 6 | May 15, 1987 12:55 AM | Gonzalesrd | 2 | - | 1
| 3 | - |
| 7 | May 18, 1987 00:30 AM | Redwood St | 1 | 1
| 1 | 1 | - |
| 8 | Jun 4, 1987 08:15 PM | 101 | 1 | - | 1
| 3 | - |
| 9 | Jun 2, 1987 12:55 AM | El Rio Rd | 2 | - | 1
| 2 | - |
| 10 | Sep 7, 1987 11:38 PM | Rose Ave | 2 | 1
| 1 | 2 | - |
| 11 | Sep 15, 1987 10:10 AM | 232 | 4 | - | 1
| 5 | - |
| 12 | Nov 28, 1987 07:45 AM | Hueneme Rd | 2 | - | 1
| 2 | - |
| 13 | Dec 11, 1987 07:42 AM | Roseavenue | 2 | - | 1
| 5 | - |
Oxnard fatal car crash and road traffic accident list for 1986
- Fatal accident count21
- Vehicles involved in fatal accidents31
- Fatal accidents involving drunk persons9
- Fatalities23
- Persons involved in fatal accidents54
Daylight
- Oxnard(Based on 21 reports) 61.9%
- Ventura County(Based on 101 reports) 42.6%
- California(Based on 4,674 reports) 44.7%
Dark - Lighted
- Oxnard(Based on 21 reports) 28.6%
- Ventura County(Based on 101 reports) 16.8%
- California(Based on 4,674 reports) 23.4%
Dark - Not Lighted
- Oxnard(Based on 21 reports) 9.5%
- Ventura County(Based on 101 reports) 33.7%
- California(Based on 4,674 reports) 27.9%
Clear
- Oxnard(Based on 21 reports) 95.2%
- Ventura County(Based on 101 reports) 90.1%
- California(Based on 4,683 reports) 93.3%
Rain
- Oxnard(Based on 21 reports) 4.8%
- Ventura County(Based on 101 reports) 7.9%
- California(Based on 4,683 reports) 4.7%
| # | Date | Location | Vehicles | Drunk persons | Fatalites | Persons | Pedestrians |
|---|
| 1 | Jan 271986 05:55 PM | | 2 | - | 1
| 3 | - |
| 2 | Mar 20, 1986 05:45 PM | Plsntvlyrd | 2 | - | 1
| 4 | - |
| 3 | Feb 22, 1986 04:30 PM | Channelisl | 2 | - | 1
| 2 | - |
| 4 | Feb 14, 1986 11:00 PM | Victoriaav | 1 | 1
| 1 | 2 | - |
| 5 | Apr 20, 1986 07:55 PM | Roseavenue | 1 | - | 1
| 3 | - |
| 6 | May 181986 03:05 PM | | 1 | - | 1
| 2 | - |
| 7 | Jun 6, 1986 09:20 PM | Chanlislbl | 1 | - | 1
| 2 | - |
| 8 | Jul 3, 1986 04:05 PM | Napoleonav | 1 | - | 1
| 3 | - |
| 9 | Jul 10, 1986 11:35 AM | La Canada | 1 | - | 1
| 2 | - |
| 10 | Jul 29, 1986 12:45 AM | Wooley Rd | 2 | - | 1
| 2 | - |
| 11 | Sep 8, 1986 04:36 PM | Sturgis Rd | 1 | 1
| 1 | 2 | - |
| 12 | Sep 29, 1986 05:45 PM | Wooley Rd | 2 | 1
| 2 | 3 | - |
| 13 | Oct 18, 1986 00:16 AM | Ventura Rd | 2 | 1
| 1 | 3 | - |
| 14 | Nov 161986 10:40 PM | | 2 | 2
| 1 | 2 | - |
| 15 | Nov 201986 06:20 PM | | 1 | - | 1
| 3 | - |
| 16 | Dec 18, 1986 02:10 PM | Ventura Rd | 3 | - | 1
| 4 | - |
| 17 | Dec 20, 1986 11:50 PM | Wooleyroad | 1 | - | 1
| 3 | - |
| 18 | Dec 24, 1986 02:40 PM | Rose Ave | 2 | 1
| 2 | 3 | - |
| 19 | Dec 21, 1986 02:05 PM | Sanjuanave | 1 | 1
| 1 | 2 | - |
| 20 | Dec 2, 1986 04:23 PM | Plesantvly | 1 | - | 1
| 2 | - |
| 21 | Dec 30, 1986 01:45 PM | Hemlock St | 1 | 1
| 1 | 2 | - |
Oxnard fatal car crash and road traffic accident list for 1985
- Fatal accident count15
- Vehicles involved in fatal accidents22
- Fatal accidents involving drunk persons6
- Fatalities15
- Persons involved in fatal accidents34
Daylight
- Oxnard(Based on 15 reports) 46.7%
- Ventura County(Based on 92 reports) 52.2%
- California(Based on 4,436 reports) 44.6%
Dark - Lighted
- Oxnard(Based on 15 reports) 26.7%
- Ventura County(Based on 92 reports) 17.4%
- California(Based on 4,436 reports) 24.5%
Dark - Not Lighted
- Oxnard(Based on 15 reports) 20.0%
- Ventura County(Based on 92 reports) 28.3%
- California(Based on 4,436 reports) 26.8%
Dusk
- Oxnard(Based on 15 reports) 6.7%
- Ventura County(Based on 92 reports) 2.2%
- California(Based on 4,436 reports) 2.4%
Clear
- Oxnard(Based on 15 reports) 100.0%
- Ventura County(Based on 92 reports) 92.4%
- California(Based on 4,447 reports) 92.9%
| # | Date | Location | Vehicles | Drunk persons | Fatalites | Persons | Pedestrians |
|---|
| 1 | Feb 251985 06:43 PM | | 1 | - | 1
| 3 | - |
| 2 | Jan 291985 01:30 PM | | 2 | - | 1
| 2 | - |
| 3 | Mar 61985 02:25 AM | | 2 | - | 1
| 2 | - |
| 4 | Mar 22, 1985 01:35 PM | K Street | 1 | - | 1
| 2 | - |
| 5 | Mar 31, 1985 06:25 PM | Harborblvd | 2 | 1
| 1 | 5 | - |
| 6 | Apr 17, 1985 03:10 PM | Marquitast | 2 | 1
| 1 | 2 | - |
| 7 | Apr 201985 02:25 AM | | 2 | - | 1
| 2 | - |
| 8 | Apr 261985 08:25 AM | | 1 | - | 1
| 1 | - |
| 9 | May 5, 1985 00:01 AM | Wooley Rd | 2 | 2
| 1 | 2 | - |
| 10 | Aug 8, 1985 02:20 AM | Harborblvd | 1 | 1
| 1 | 3 | - |
| 11 | Aug 111985 01:10 PM | | 1 | 1
| 1 | 1 | - |
| 12 | Aug 1, 1985 08:44 PM | Wooley Rd | 1 | - | 1
| 3 | - |
| 13 | Aug 301985 02:00 PM | | 2 | - | 1
| 2 | - |
| 14 | Oct 141985 10:45 PM | | 1 | - | 1
| 2 | - |
| 15 | Oct 31, 1985 07:15 AM | Cooper Rd | 1 | - | 1
| 2 | - |
Oxnard fatal car crash and road traffic accident list for 1984
- Fatal accident count7
- Vehicles involved in fatal accidents10
- Fatal accidents involving drunk persons5
- Fatalities8
- Persons involved in fatal accidents16
Daylight
- Oxnard(Based on 7 reports) 42.9%
- Ventura County(Based on 89 reports) 38.2%
- California(Based on 4,504 reports) 43.0%
Dusk
- Oxnard(Based on 7 reports) 28.6%
- Ventura County(Based on 89 reports) 5.6%
- California(Based on 4,504 reports) 2.2%
Dark - Not Lighted
- Oxnard(Based on 7 reports) 14.3%
- Ventura County(Based on 89 reports) 38.2%
- California(Based on 4,504 reports) 29.5%
Dark - Lighted
- Oxnard(Based on 7 reports) 14.3%
- Ventura County(Based on 89 reports) 15.7%
- California(Based on 4,504 reports) 24.2%
Clear
- Oxnard(Based on 7 reports) 100.0%
- Ventura County(Based on 89 reports) 98.9%
- California(Based on 4,517 reports) 93.9%
| # | Date | Location | Vehicles | Drunk persons | Fatalites | Persons | Pedestrians |
|---|
| 1 | Jan 23, 1984 08:20 AM | Centralave | 1 | 1
| 1 | 1 | - |
| 2 | Mar 291984 06:55 AM | | 2 | - | 2
| 4 | - |
| 3 | Jun 10, 1984 08:20 PM | Colonia Rd | 1 | 1
| 1 | 2 | - |
| 4 | Jun 23, 1984 08:15 PM | Victoriaav | 2 | 2
| 1 | 3 | - |
| 5 | Aug 23, 1984 03:00 AM | Ventura Rd | 1 | - | 1
| 2 | - |
| 6 | Sep 22, 1984 02:00 AM | Riceavenue | 2 | 1
| 1 | 2 | - |
| 7 | Dec 281984 03:54 PM | | 1 | - | 1
| 2 | - |
Oxnard fatal car crash and road traffic accident list for 1983
- Fatal accident count14
- Vehicles involved in fatal accidents21
- Fatal accidents involving drunk persons5
- Fatalities15
- Persons involved in fatal accidents35
Daylight
- Oxnard(Based on 14 reports) 42.9%
- Ventura County(Based on 95 reports) 38.9%
- California(Based on 4,082 reports) 42.4%
Dark - Lighted
- Oxnard(Based on 14 reports) 35.7%
- Ventura County(Based on 95 reports) 21.1%
- California(Based on 4,082 reports) 23.9%
Dark - Not Lighted
- Oxnard(Based on 14 reports) 14.3%
- Ventura County(Based on 95 reports) 30.5%
- California(Based on 4,082 reports) 29.8%
Dawn
- Oxnard(Based on 14 reports) 7.1%
- Ventura County(Based on 95 reports) 4.2%
- California(Based on 4,082 reports) 1.6%
Clear
- Oxnard(Based on 14 reports) 92.9%
- Ventura County(Based on 95 reports) 93.7%
- California(Based on 4,089 reports) 89.6%
Fog, Smog, Smoke
- Oxnard(Based on 14 reports) 7.1%
- Ventura County(Based on 95 reports) 2.1%
- California(Based on 4,089 reports) 1.3%
| # | Date | Location | Vehicles | Drunk persons | Fatalites | Persons | Pedestrians |
|---|
| 1 | Feb 17, 1983 07:40 AM | Hstreet | 1 | - | 1
| 2 | - |
| 2 | Jan 26, 1983 06:48 AM | Venturard | 2 | 1
| 1 | 3 | - |
| 3 | Mar 11983 08:35 PM | | 1 | 1
| 1 | 1 | - |
| 4 | Feb 11, 1983 11:34 AM | Vnturfrtrd | 1 | - | 1
| 2 | - |
| 5 | Mar 23, 1983 07:50 AM | Chanelisbl | 2 | - | 1
| 6 | - |
| 6 | Apr 27, 1983 06:20 PM | Thirdst | 1 | - | 1
| 2 | - |
| 7 | Apr 28, 1983 11:55 PM | Chanelisln | 2 | - | 1
| 2 | - |
| 8 | Jun 9, 1983 01:30 PM | Sobankdr | 1 | 1
| 1 | 1 | - |
| 9 | Jul 301983 03:35 AM | | 1 | - | 1
| 2 | - |
| 10 | Aug 301983 08:00 PM | | 2 | 1
| 2 | 3 | - |
| 11 | Aug 30, 1983 02:50 PM | Venturard | 3 | - | 1
| 4 | - |
| 12 | Nov 11, 1983 07:15 PM | Sixth St | 1 | - | 1
| 2 | - |
| 13 | Nov 28, 1983 05:20 PM | Wooleyroad | 1 | 1
| 1 | 2 | - |
| 14 | Dec 10, 1983 04:00 AM | Roseavenue | 2 | - | 1
| 3 | - |
Oxnard fatal car crash and road traffic accident list for 1982
- Fatal accident count11
- Vehicles involved in fatal accidents15
- Fatal accidents involving drunk persons4
- Fatalities15
- Persons involved in fatal accidents31
Dark - Lighted
- Oxnard(Based on 11 reports) 54.5%
- Ventura County(Based on 76 reports) 25.0%
- California(Based on 4,116 reports) 27.0%
Daylight
- Oxnard(Based on 11 reports) 36.4%
- Ventura County(Based on 76 reports) 32.9%
- California(Based on 4,116 reports) 39.7%
Dusk
- Oxnard(Based on 11 reports) 9.1%
- Ventura County(Based on 76 reports) 2.6%
- California(Based on 4,116 reports) 2.4%
Clear
- Oxnard(Based on 11 reports) 90.9%
- Ventura County(Based on 76 reports) 92.1%
- California(Based on 4,119 reports) 90.8%
Rain
- Oxnard(Based on 11 reports) 9.1%
- Ventura County(Based on 76 reports) 5.3%
- California(Based on 4,119 reports) 6.9%
| # | Date | Location | Vehicles | Drunk persons | Fatalites | Persons | Pedestrians |
|---|
| 1 | Jan 11982 02:32 AM | | 1 | - | 1
| 2 | - |
| 2 | Mar 5, 1982 05:59 PM | Alvaradost | 1 | - | 1
| 2 | - |
| 3 | Feb 28, 1982 08:04 PM | Venturard | 2 | 2
| 1 | 2 | - |
| 4 | May 11, 1982 06:00 PM | Roseavenue | 2 | - | 3
| 4 | - |
| 5 | Jun 11, 1982 05:00 PM | Garydrive | 2 | - | 2
| 5 | - |
| 6 | Jul 41982 04:25 AM | | 1 | - | 1
| 4 | - |
| 7 | Jul 18, 1982 11:39 PM | Cstreet | 1 | - | 1
| 2 | - |
| 8 | Sep 18, 1982 04:30 PM | Deodarave | 1 | 1
| 1 | 1 | - |
| 9 | Oct 12, 1982 12:00 AM | Huenemerd | 2 | 1
| 1 | 3 | - |
| 10 | Nov 151982 10:00 PM | | 1 | - | 1
| 3 | - |
| 11 | Nov 29, 1982 05:29 PM | Venturard | 1 | - | 2
| 3 | - |
Oxnard fatal car crash and road traffic accident list for 1981
- Fatal accident count19
- Vehicles involved in fatal accidents31
- Fatal accidents involving drunk persons18
- Fatalities20
- Persons involved in fatal accidents48
Dark - Lighted
- Oxnard(Based on 19 reports) 78.9%
- Ventura County(Based on 87 reports) 34.5%
- California(Based on 4,670 reports) 26.4%
Daylight
- Oxnard(Based on 19 reports) 10.5%
- Ventura County(Based on 87 reports) 35.6%
- California(Based on 4,670 reports) 39.8%
Dark - Not Lighted
- Oxnard(Based on 19 reports) 10.5%
- Ventura County(Based on 87 reports) 26.4%
- California(Based on 4,670 reports) 30.3%
Clear
- Oxnard(Based on 19 reports) 84.2%
- Ventura County(Based on 87 reports) 89.7%
- California(Based on 4,670 reports) 93.0%
Fog, Smog, Smoke
- Oxnard(Based on 19 reports) 10.5%
- Ventura County(Based on 87 reports) 4.6%
- California(Based on 4,670 reports) 1.7%
Rain
- Oxnard(Based on 19 reports) 5.3%
- Ventura County(Based on 87 reports) 5.7%
- California(Based on 4,670 reports) 4.8%
Oxnard fatal car crash and road traffic accident list for 1980
- Fatal accident count27
- Vehicles involved in fatal accidents38
- Fatal accidents involving drunk persons12
- Fatalities30
- Persons involved in fatal accidents64
Daylight
- Oxnard(Based on 27 reports) 37.0%
- Ventura County(Based on 108 reports) 37.0%
- California(Based on 4,928 reports) 39.5%
Dark - Not Lighted
- Oxnard(Based on 27 reports) 33.3%
- Ventura County(Based on 108 reports) 38.9%
- California(Based on 4,928 reports) 31.3%
Dark - Lighted
- Oxnard(Based on 27 reports) 22.2%
- Ventura County(Based on 108 reports) 17.6%
- California(Based on 4,928 reports) 25.8%
Dusk
- Oxnard(Based on 27 reports) 7.4%
- Ventura County(Based on 108 reports) 4.6%
- California(Based on 4,928 reports) 2.5%
Clear
- Oxnard(Based on 27 reports) 88.9%
- Ventura County(Based on 108 reports) 90.7%
- California(Based on 4,930 reports) 93.0%
Rain
- Oxnard(Based on 27 reports) 11.1%
- Ventura County(Based on 108 reports) 4.6%
- California(Based on 4,930 reports) 4.8%
Oxnard fatal car crash and road traffic accident list for 1979
- Fatal accident count8
- Vehicles involved in fatal accidents14
- Fatal accidents involving drunk persons6
- Fatalities8
- Persons involved in fatal accidents20
Dark - Lighted
- Oxnard(Based on 8 reports) 50.0%
- Ventura County(Based on 94 reports) 19.1%
- California(Based on 4,970 reports) 25.7%
Dark - Not Lighted
- Oxnard(Based on 8 reports) 37.5%
- Ventura County(Based on 94 reports) 33.0%
- California(Based on 4,970 reports) 29.4%
Daylight
- Oxnard(Based on 8 reports) 12.5%
- Ventura County(Based on 94 reports) 44.7%
- California(Based on 4,970 reports) 41.5%
Clear
- Oxnard(Based on 8 reports) 87.5%
- Ventura County(Based on 95 reports) 94.7%
- California(Based on 4,975 reports) 92.9%
Rain
- Oxnard(Based on 8 reports) 12.5%
- Ventura County(Based on 95 reports) 4.2%
- California(Based on 4,975 reports) 5.1%
Oxnard fatal car crash and road traffic accident list for 1978
- Fatal accident count18
- Vehicles involved in fatal accidents27
- Fatal accidents involving drunk persons11
- Fatalities19
- Persons involved in fatal accidents40
Daylight
- Oxnard(Based on 18 reports) 33.3%
- Ventura County(Based on 101 reports) 46.5%
- California(Based on 4,722 reports) 42.5%
Dark - Lighted
- Oxnard(Based on 18 reports) 33.3%
- Ventura County(Based on 101 reports) 17.8%
- California(Based on 4,722 reports) 23.9%
Dark - Not Lighted
- Oxnard(Based on 18 reports) 27.8%
- Ventura County(Based on 101 reports) 32.7%
- California(Based on 4,722 reports) 30.1%
Dark - Unknown Lighting
- Oxnard(Based on 18 reports) 5.6%
- Ventura County(Based on 101 reports) 3.0%
- California(Based on 4,722 reports) 3.6%
Clear
- Oxnard(Based on 18 reports) 94.4%
- Ventura County(Based on 101 reports) 89.1%
- California(Based on 4,724 reports) 90.7%
Rain
- Oxnard(Based on 18 reports) 5.6%
- Ventura County(Based on 101 reports) 5.9%
- California(Based on 4,724 reports) 6.6%
Oxnard fatal car crash and road traffic accident list for 1977
- Fatal accident count15
- Vehicles involved in fatal accidents20
- Fatal accidents involving drunk persons9
- Fatalities16
- Persons involved in fatal accidents40
Daylight
- Oxnard(Based on 15 reports) 60.0%
- Ventura County(Based on 95 reports) 51.6%
- California(Based on 4,347 reports) 40.0%
Dark - Lighted
- Oxnard(Based on 15 reports) 20.0%
- Ventura County(Based on 95 reports) 12.6%
- California(Based on 4,347 reports) 23.7%
Dark - Unknown Lighting
- Oxnard(Based on 15 reports) 13.3%
- Ventura County(Based on 95 reports) 4.2%
- California(Based on 4,347 reports) 3.4%
Dark - Not Lighted
- Oxnard(Based on 15 reports) 6.7%
- Ventura County(Based on 95 reports) 31.6%
- California(Based on 4,347 reports) 32.9%
Clear
- Oxnard(Based on 15 reports) 100.0%
- Ventura County(Based on 95 reports) 96.8%
- California(Based on 4,351 reports) 93.2%
Oxnard fatal car crash and road traffic accident list for 1976
- Fatal accident count11
- Vehicles involved in fatal accidents16
- Fatal accidents involving drunk persons3
- Fatalities11
- Persons involved in fatal accidents24
Daylight
- Oxnard(Based on 11 reports) 63.6%
- Ventura County(Based on 77 reports) 50.6%
- California(Based on 3,663 reports) 42.8%
Dark - Lighted
- Oxnard(Based on 11 reports) 36.4%
- Ventura County(Based on 77 reports) 26.0%
- California(Based on 3,663 reports) 24.5%
Clear
- Oxnard(Based on 11 reports) 100.0%
- Ventura County(Based on 77 reports) 92.2%
- California(Based on 3,667 reports) 91.8%
Oxnard fatal car crash and road traffic accident list for 1975
- Fatal accident count11
- Vehicles involved in fatal accidents16
- Fatal accidents involving drunk persons3
- Fatalities11
- Persons involved in fatal accidents24
Daylight
- Oxnard(Based on 11 reports) 63.6%
- Ventura County(Based on 77 reports) 50.6%
- California(Based on 3,663 reports) 42.8%
Dark - Lighted
- Oxnard(Based on 11 reports) 36.4%
- Ventura County(Based on 77 reports) 26.0%
- California(Based on 3,663 reports) 24.5%
Clear
- Oxnard(Based on 11 reports) 100.0%
- Ventura County(Based on 77 reports) 92.2%
- California(Based on 3,667 reports) 91.8%