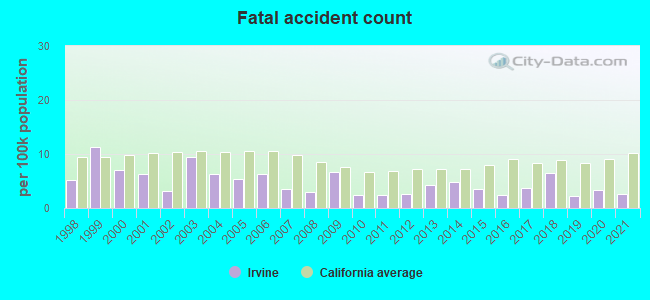
Fatal car crashes and road traffic accidents in Irvine, California
- Fatal car crash and road traffic accident statistics for 2021
- Fatal accident count8
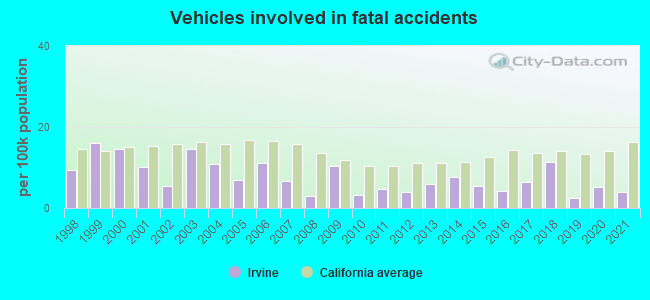
- Vehicles involved in fatal accidents12
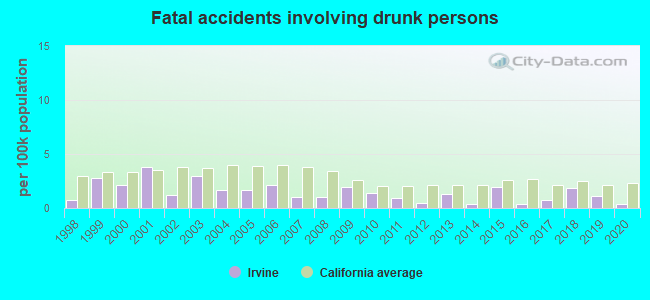
- Fatal accidents involving drunk persons0
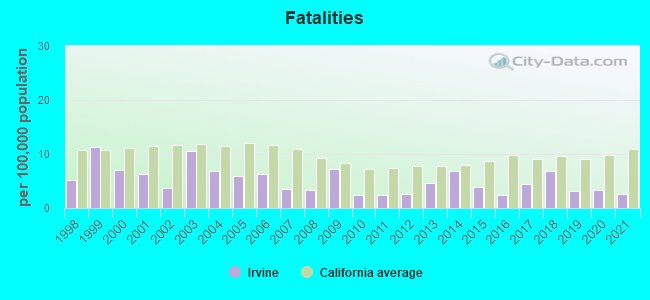
- Fatalities8
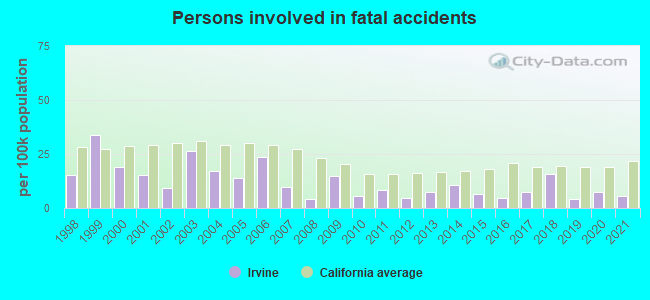
- Persons involved in fatal accidents17
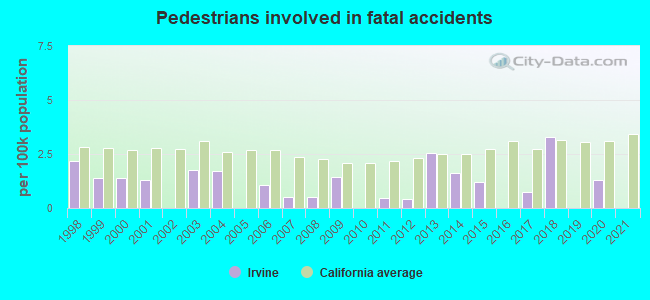
- Pedestrians involved in fatal accidents0
- Fatal car crash and road traffic accident statistics for 2020
- Fatal accident count10
- Vehicles involved in fatal accidents16
- Fatal accidents involving drunk persons1
- Fatalities10
- Persons involved in fatal accidents23
- Pedestrians involved in fatal accidents4
- Fatal car crash and road traffic accident statistics for 2019
- Fatal accident count6
- Vehicles involved in fatal accidents7
- Fatal accidents involving drunk persons3
- Fatalities9
- Persons involved in fatal accidents11
- Pedestrians involved in fatal accidents0
- Fatal car crash and road traffic accident statistics for 2018
- Fatal accident count18
- Vehicles involved in fatal accidents31
- Fatal accidents involving drunk persons5
- Fatalities19
- Persons involved in fatal accidents43
- Pedestrians involved in fatal accidents9
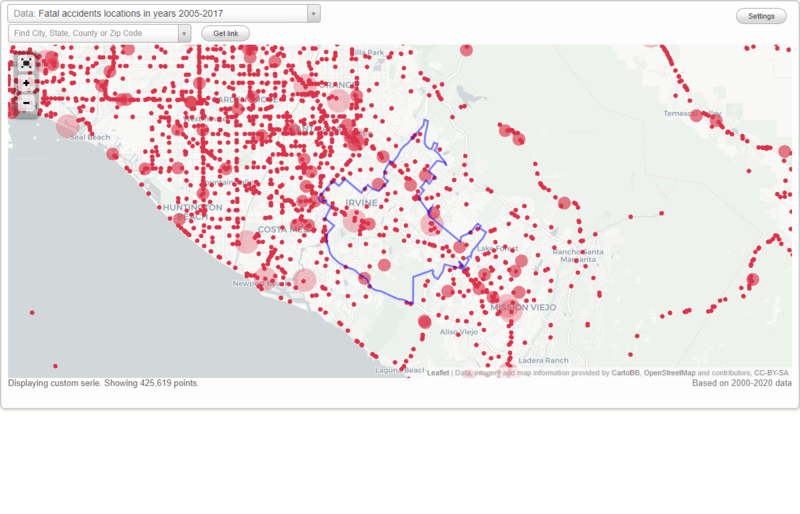
Data:
Latest news about accidents in Irvine, CA collected exclusively by city-data.com from local newspapers, TV, and radio stations
No street view available for this location
Irvine fatal accident statistics for 1998 - 2021
Average EMS response time
- Irvine(Based on 4 reports) 7.3 mins
- Orange County(Based on 104 reports) 9.3 mins
- California(Based on 2,270 reports) 9.8 mins
Average hospital transport time
- Irvine(Based on 3 reports) 36.0 mins
- Orange County(Based on 50 reports) 56.1 mins
- California(Based on 1,048 reports) 53.1 mins
Daylight
- Irvine(Based on 491 reports) 41.5%
- Orange County(Based on 9,273 reports) 38.3%
- California(Based on 177,072 reports) 43.9%
Dark - Lighted
- Irvine(Based on 491 reports) 35.8%
- Orange County(Based on 9,273 reports) 42.7%
- California(Based on 177,072 reports) 25.4%
Dark - Not Lighted
- Irvine(Based on 491 reports) 19.1%
- Orange County(Based on 9,273 reports) 15.0%
- California(Based on 177,072 reports) 26.6%
Dusk
- Irvine(Based on 491 reports) 1.6%
- Orange County(Based on 9,273 reports) 2.2%
- California(Based on 177,072 reports) 2.1%
Dawn
- Irvine(Based on 491 reports) 1.2%
- Orange County(Based on 9,273 reports) 1.4%
- California(Based on 177,072 reports) 1.6%
Dark - Unknown Lighting
- Irvine(Based on 491 reports) 0.6%
- Orange County(Based on 9,273 reports) 0.4%
- California(Based on 177,072 reports) 0.5%
Clear
- Irvine(Based on 491 reports) 88.6%
- Orange County(Based on 9,281 reports) 91.8%
- California(Based on 177,248 reports) 91.0%
Rain
- Irvine(Based on 491 reports) 5.5%
- Orange County(Based on 9,281 reports) 4.2%
- California(Based on 177,248 reports) 4.8%
Unknown
- Irvine(Based on 491 reports) 4.7%
- Orange County(Based on 9,281 reports) 3.2%
- California(Based on 177,248 reports) 2.6%
Fog, Smog, Smoke
- Irvine(Based on 491 reports) 1.2%
- Orange County(Based on 9,281 reports) 0.7%
- California(Based on 177,248 reports) 1.1%

Irvine fatal car crash and road traffic accident list for 2021
- Fatal accident count8
- Vehicles involved in fatal accidents12
- Fatalities8
- Persons involved in fatal accidents17
Daylight
- Irvine(Based on 8 reports) 62.5%
- Orange County(Based on 180 reports) 34.4%
- California(Based on 3,972 reports) 36.7%
Dark - Lighted
- Irvine(Based on 8 reports) 25.0%
- Orange County(Based on 180 reports) 51.1%
- California(Based on 3,972 reports) 31.4%
Dawn
- Irvine(Based on 8 reports) 12.5%
- Orange County(Based on 180 reports) 2.2%
- California(Based on 3,972 reports) 2.0%
Clear
- Irvine(Based on 7 reports) 85.7%
- Orange County(Based on 180 reports) 83.3%
- California(Based on 3,951 reports) 86.2%
Rain
- Irvine(Based on 7 reports) 14.3%
- Orange County(Based on 180 reports) 4.4%
- California(Based on 3,951 reports) 3.1%
| # | Date | Location | Vehicles | Drunk persons | Fatalites | Persons | Pedestrians |
|---|
| 1 | Jan 15, 2021 08:13 AM | Walnut Ave | 2 | - | 1
| 4 | - |
| 2 | Jun 13, 2021 05:25 AM | I-5 | 1 | - | 1
| 3 | - |
| 3 | Nov 21, 2021 03:28 PM | I-405 | 1 | - | 1
| 1 | - |
| 4 | Sep 27, 2021 04:05 AM | Sand Canyon Ave, Irvine Center Dr | 2 | - | 1
| 2 | - |
| 5 | Oct 21, 2021 05:26 PM | Barranca Pkwy, Culver Dr | 2 | - | 1
| 2 | - |
| 6 | Jun 20, 2021 00:49 AM | Encore, Medallion | 1 | - | 1
| 1 | - |
| 7 | Mar 10, 2021 06:36 AM | Culver Ave | 1 | - | 1
| 1 | - |
| 8 | Jun 10, 2021 05:35 PM | Sr-133 | 2 | - | 1
| 3 | - |
Irvine fatal car crash and road traffic accident list for 2020
- Fatal accident count10
- Vehicles involved in fatal accidents16
- Fatal accidents involving drunk persons1
- Fatalities10
- Persons involved in fatal accidents23
- Pedestrians involved in fatal accidents4
Daylight
- Irvine(Based on 10 reports) 70.0%
- Orange County(Based on 176 reports) 33.0%
- California(Based on 3,555 reports) 38.6%
Dark - Lighted
- Irvine(Based on 10 reports) 30.0%
- Orange County(Based on 176 reports) 48.3%
- California(Based on 3,555 reports) 31.5%
Clear
- Irvine(Based on 10 reports) 60.0%
- Orange County(Based on 176 reports) 79.5%
- California(Based on 3,547 reports) 87.8%
Unknown
- Irvine(Based on 10 reports) 30.0%
- Orange County(Based on 176 reports) 16.5%
- California(Based on 3,547 reports) 8.0%
Rain
- Irvine(Based on 10 reports) 10.0%
- Orange County(Based on 176 reports) 2.3%
- California(Based on 3,547 reports) 2.6%
| # | Date | Location | Vehicles | Drunk persons | Fatalites | Persons | Pedestrians |
|---|
| 1 | Feb 18, 2020 10:13 PM | Sr-73 | 3 | - | 1
| 3 | - |
| 2 | Jan 25, 2020 02:32 PM | Harvard Ave | 2 | - | 1
| 2 | - |
| 3 | Mar 22, 2020 10:17 AM | I-5 | 1 | - | 1
| 2 | - |
| 4 | Jul 11, 2020 09:28 AM | I-405 Ramp | 1 | - | 1
| 1 | 1 |
| 5 | May 25, 2020 09:58 AM | Portola Pkwy, Sr-261 | 1 | - | 1
| 1 | 1 |
| 6 | Aug 22, 2020 08:46 PM | Culver Dr, Main St | 2 | 1
| 1 | 5 | - |
| 7 | Jul 21, 2020 06:38 PM | Silkberry | 2 | - | 1
| 2 | 1 |
| 8 | Nov 7, 2020 07:57 AM | I-405 Ramp, Jamboree Rd | 2 | - | 1
| 2 | - |
| 9 | Sep 1, 2020 11:40 PM | I-5 | 1 | - | 1
| 1 | - |
| 10 | Nov 3, 2020 04:03 PM | I-405 | 1 | - | 1
| 4 | 1 |
Irvine fatal car crash and road traffic accident list for 2019
- Fatal accident count6
- Vehicles involved in fatal accidents7
- Fatal accidents involving drunk persons3
- Fatalities9
- Persons involved in fatal accidents11
Dark - Lighted
- Irvine(Based on 6 reports) 33.3%
- Orange County(Based on 147 reports) 46.9%
- California(Based on 3,314 reports) 31.1%
Daylight
- Irvine(Based on 6 reports) 33.3%
- Orange County(Based on 147 reports) 36.1%
- California(Based on 3,314 reports) 38.4%
Dark - Not Lighted
- Irvine(Based on 6 reports) 33.3%
- Orange County(Based on 147 reports) 11.6%
- California(Based on 3,314 reports) 25.2%
Clear
- Irvine(Based on 6 reports) 50.0%
- Orange County(Based on 147 reports) 78.9%
- California(Based on 3,313 reports) 79.4%
Unknown
- Irvine(Based on 6 reports) 50.0%
- Orange County(Based on 147 reports) 19.0%
- California(Based on 3,313 reports) 14.9%
| # | Date | Location | Vehicles | Drunk persons | Fatalites | Persons | Pedestrians |
|---|
| 1 | Jan 5, 2019 02:13 AM | Sr-73 Ramp | 1 | 1
| 1 | 1 | - |
| 2 | May 1, 2019 06:13 PM | I-405 | 1 | - | 1
| 1 | - |
| 3 | Aug 2, 2019 06:22 PM | Red Hill Ave | 1 | - | 1
| 1 | - |
| 4 | Jun 14, 2019 05:03 AM | I-5 | 2 | - | 1
| 2 | - |
| 5 | Oct 29, 2019 09:47 PM | I-5 | 1 | 1
| 2 | 2 | - |
| 6 | Nov 22, 2019 01:46 AM | Harvard Ave | 1 | 1
| 3 | 4 | - |
Irvine fatal car crash and road traffic accident list for 2018
- Fatal accident count18
- Vehicles involved in fatal accidents31
- Fatal accidents involving drunk persons5
- Fatalities19
- Persons involved in fatal accidents43
- Pedestrians involved in fatal accidents9
Dark - Lighted
- Irvine(Based on 18 reports) 55.6%
- Orange County(Based on 195 reports) 52.8%
- California(Based on 3,483 reports) 32.2%
Daylight
- Irvine(Based on 18 reports) 38.9%
- Orange County(Based on 195 reports) 34.4%
- California(Based on 3,483 reports) 39.4%
Dusk
- Irvine(Based on 18 reports) 5.6%
- Orange County(Based on 195 reports) 3.1%
- California(Based on 3,483 reports) 2.6%
Clear
- Irvine(Based on 17 reports) 88.2%
- Orange County(Based on 194 reports) 84.5%
- California(Based on 3,478 reports) 85.0%
Unknown
- Irvine(Based on 17 reports) 11.8%
- Orange County(Based on 194 reports) 13.4%
- California(Based on 3,478 reports) 11.5%
| # | Date | Location | Vehicles | Drunk persons | Fatalites | Persons | Pedestrians |
|---|
| 1 | Jan 28, 2018 06:53 PM | I-5 Ramp | 3 | - | 1
| 5 | - |
| 2 | Mar 18, 2018 01:00 AM | I-5 San Diego Fwy | 2 | 1
| 1 | 2 | 1 |
| 3 | May 16, 2018 07:59 PM | Ridgeline Dr | 1 | 1
| 1 | 1 | 4 |
| 4 | Feb 4, 2018 05:09 AM | University Dr | 1 | 1
| 1 | 1 | - |
| 5 | Jul 31, 2018 02:47 PM | Sr-241 | 1 | - | 1
| 2 | - |
| 6 | Feb 5, 2018 05:43 PM | Paseo Westpark, San Remo | 2 | - | 1
| 3 | - |
| 7 | Feb 18, 2018 10:16 PM | Blue Lake South, Springacre | 1 | - | 1
| 1 | 2 |
| 8 | Nov 2, 2018 07:22 AM | I-405 Ramp | 2 | - | 1
| 2 | - |
| 9 | Nov 2, 2018 07:31 AM | I-405 Ramp | 2 | - | 1
| 1 | - |
| 10 | Sep 13, 2018 10:11 AM | Oak Canyon, Valley Oak Dr | 2 | - | 2
| 4 | - |
| 11 | Jun 3, 2018 04:54 AM | Lake Forest Dr, Bake Pkwy | 1 | 1
| 1 | 1 | - |
| 12 | Jul 3, 2018 03:12 PM | Main St | 2 | - | 1
| 2 | - |
| 13 | Apr 5, 2018 01:07 PM | Sr-73 | 3 | - | 1
| 3 | - |
| 14 | Aug 18, 2018 00:47 AM | I-5 | 1 | 1
| 1 | 2 | - |
| 15 | Sep 23, 2018 05:11 PM | Sr-261 Ramp Jamboree Rd, Walnut Ave | 2 | - | 1
| 6 | - |
| 16 | Nov 2, 2018 07:35 PM | Bake Parkway | 1 | - | 1
| 1 | 1 |
| 17 | Nov 10, 2018 08:54 PM | Jamboree Rd | 1 | - | 1
| 1 | 1 |
| 18 | Aug 23, 2018 01:36 AM | I-5 | 3 | - | 1
| 5 | - |
Irvine fatal car crash and road traffic accident list for 2017
- Fatal accident count10
- Vehicles involved in fatal accidents17
- Fatal accidents involving drunk persons2
- Fatalities12
- Persons involved in fatal accidents20
- Pedestrians involved in fatal accidents2
Dark - Lighted
- Irvine(Based on 10 reports) 50.0%
- Orange County(Based on 164 reports) 45.1%
- California(Based on 3,300 reports) 28.8%
Daylight
- Irvine(Based on 10 reports) 40.0%
- Orange County(Based on 164 reports) 39.6%
- California(Based on 3,300 reports) 40.9%
Dark - Not Lighted
- Irvine(Based on 10 reports) 10.0%
- Orange County(Based on 164 reports) 10.4%
- California(Based on 3,300 reports) 25.4%
Clear
- Irvine(Based on 10 reports) 70.0%
- Orange County(Based on 164 reports) 76.2%
- California(Based on 3,301 reports) 83.8%
Unknown
- Irvine(Based on 10 reports) 30.0%
- Orange County(Based on 164 reports) 20.7%
- California(Based on 3,301 reports) 12.1%
| # | Date | Location | Vehicles | Drunk persons | Fatalites | Persons | Pedestrians |
|---|
| 1 | Apr 7, 2017 05:17 AM | Bake Parkway, Rockfield Blvd | 2 | - | 1
| 2 | - |
| 2 | Jan 14, 2017 05:03 PM | Lake Forest Dr, Romano | 1 | - | 1
| 1 | 1 |
| 3 | Jan 24, 2017 05:06 PM | Jeronimo Rd | 2 | - | 1
| 2 | - |
| 4 | Jul 14, 2017 03:06 AM | I-405 | 1 | - | 1
| 1 | - |
| 5 | Jan 17, 2017 05:39 AM | Main St, Siglo | 1 | - | 1
| 1 | 1 |
| 6 | Aug 22, 2017 03:17 PM | Sr-133 | 2 | - | 1
| 2 | - |
| 7 | Dec 14, 2017 03:43 AM | I-405 | 2 | - | 1
| 2 | - |
| 8 | Feb 16, 2017 07:33 PM | Cherry Ave, Trabuco Rd | 2 | - | 1
| 2 | - |
| 9 | Dec 31, 2017 09:34 AM | Irvine Blvd, Jeffrey Rd | 2 | - | 1
| 2 | - |
| 10 | Jul 1, 2017 03:06 AM | Harvard Ave, Michelson Ave | 2 | 2
| 3 | 5 | - |
Irvine fatal car crash and road traffic accident list for 2016
- Fatal accident count6
- Vehicles involved in fatal accidents11
- Fatal accidents involving drunk persons1
- Fatalities6
- Persons involved in fatal accidents12
Dark - Lighted
- Irvine(Based on 6 reports) 66.7%
- Orange County(Based on 195 reports) 57.4%
- California(Based on 3,535 reports) 31.1%
Daylight
- Irvine(Based on 6 reports) 33.3%
- Orange County(Based on 195 reports) 31.8%
- California(Based on 3,535 reports) 40.5%
Clear
- Irvine(Based on 6 reports) 83.3%
- Orange County(Based on 195 reports) 82.1%
- California(Based on 3,533 reports) 82.3%
Unknown
- Irvine(Based on 6 reports) 16.7%
- Orange County(Based on 195 reports) 15.4%
- California(Based on 3,533 reports) 14.0%
Irvine fatal car crash and road traffic accident list for 2015
- Fatal accident count9
- Vehicles involved in fatal accidents14
- Fatal accidents involving drunk persons5
- Fatalities10
- Persons involved in fatal accidents16
- Pedestrians involved in fatal accidents3
Dark - Lighted
- Irvine(Based on 9 reports) 66.7%
- Orange County(Based on 176 reports) 44.9%
- California(Based on 3,118 reports) 29.8%
Daylight
- Irvine(Based on 9 reports) 22.2%
- Orange County(Based on 176 reports) 37.5%
- California(Based on 3,118 reports) 41.2%
Dark - Not Lighted
- Irvine(Based on 9 reports) 11.1%
- Orange County(Based on 176 reports) 10.8%
- California(Based on 3,118 reports) 23.6%
Clear
- Irvine(Based on 9 reports) 66.7%
- Orange County(Based on 176 reports) 86.4%
- California(Based on 3,114 reports) 84.9%
Unknown
- Irvine(Based on 9 reports) 33.3%
- Orange County(Based on 176 reports) 11.4%
- California(Based on 3,114 reports) 12.0%
| # | Date | Location | Vehicles | Drunk persons | Fatalites | Persons | Pedestrians |
|---|
| 1 | Jan 26, 2015 10:55 PM | Shady Cyn Dr | 1 | 1
| 1 | 2 | - |
| 2 | Feb 2, 2015 09:05 PM | Sr-133 Ramp | 1 | 1
| 2 | 2 | - |
| 3 | Nov 10, 2015 01:19 AM | I-405 | 3 | 1
| 1 | 5 | - |
| 4 | Sep 9, 2015 02:28 AM | I-5 | 2 | 1
| 1 | 1 | 1 |
| 5 | Jun 22, 2015 11:07 PM | I-5 Ramp | 1 | - | 1
| 1 | - |
| 6 | Jul 16, 2015 00:40 AM | I-405 | 2 | 1
| 1 | 2 | - |
| 7 | Dec 3, 2015 05:15 AM | I-5 Ramp | 2 | - | 1
| 1 | 1 |
| 8 | Feb 8, 2015 09:47 AM | Loop Road W | 1 | - | 1
| 1 | - |
| 9 | Nov 20, 2015 03:04 PM | Bay Tree, Roosevelt | 1 | - | 1
| 1 | 1 |
Irvine fatal car crash and road traffic accident list for 2014
- Fatal accident count12
- Vehicles involved in fatal accidents19
- Fatal accidents involving drunk persons1
- Fatalities17
- Persons involved in fatal accidents27
- Pedestrians involved in fatal accidents4
Daylight
- Irvine(Based on 11 reports) 45.5%
- Orange County(Based on 161 reports) 41.6%
- California(Based on 2,819 reports) 42.9%
Dark - Lighted
- Irvine(Based on 11 reports) 36.4%
- Orange County(Based on 161 reports) 50.9%
- California(Based on 2,819 reports) 29.9%
Dusk
- Irvine(Based on 11 reports) 9.1%
- Orange County(Based on 161 reports) 2.5%
- California(Based on 2,819 reports) 2.3%
Dawn
- Irvine(Based on 11 reports) 9.1%
- Orange County(Based on 161 reports) 1.2%
- California(Based on 2,819 reports) 2.1%
Clear
- Irvine(Based on 12 reports) 75.0%
- Orange County(Based on 162 reports) 85.8%
- California(Based on 2,819 reports) 84.2%
Unknown
- Irvine(Based on 12 reports) 25.0%
- Orange County(Based on 162 reports) 12.3%
- California(Based on 2,819 reports) 13.6%
| # | Date | Location | Vehicles | Drunk persons | Fatalites | Persons | Pedestrians |
|---|
| 1 | Mar 10, 2014 09:03 PM | I-405 | 1 | - | 1
| 1 | 1 |
| 2 | Mar 17, 2014 08:03 PM | Main St | 1 | - | 1
| 1 | - |
| 3 | Apr 24, 2014 04:46 AM | I-5 | 3 | - | 2
| 5 | - |
| 4 | Aug 4, 2014 06:08 PM | I-405 | 5 | - | 1
| 6 | - |
| 5 | Feb 1, 2014 12:28 AM | Walnut Ave | 1 | - | 1
| 1 | - |
| 6 | Sep 27, 2014 12:25 AM | I-405 | 2 | - | 1
| 2 | - |
| 7 | Dec 21, 2014 87:99 PM | I-405 | 1 | 1
| 1 | 1 | - |
| 8 | Dec 9, 2014 01:20 PM | Irvine Center Dr, Culver Dr | 1 | - | 1
| 1 | - |
| 9 | Dec 10, 2014 11:03 AM | Bryan Ave | 1 | - | 1
| 1 | 1 |
| 10 | Dec 14, 2014 06:50 AM | Orchard Hills, Wolf Trail | 1 | - | 1
| 1 | - |
| 11 | Oct 31, 2014 07:10 PM | West Yale Loop, Burwood | 1 | - | 1
| 1 | 2 |
| 12 | Oct 4, 2014 02:12 AM | I-5 | 1 | - | 5
| 6 | - |
Irvine fatal car crash and road traffic accident list for 2013
- Fatal accident count10
- Vehicles involved in fatal accidents14
- Fatal accidents involving drunk persons3
- Fatalities11
- Persons involved in fatal accidents17
- Pedestrians involved in fatal accidents6
Daylight
- Irvine(Based on 10 reports) 60.0%
- Orange County(Based on 161 reports) 44.7%
- California(Based on 2,765 reports) 44.7%
Dark - Lighted
- Irvine(Based on 10 reports) 40.0%
- Orange County(Based on 161 reports) 46.6%
- California(Based on 2,765 reports) 26.6%
Clear
- Irvine(Based on 10 reports) 60.0%
- Orange County(Based on 160 reports) 86.9%
- California(Based on 2,760 reports) 88.1%
Unknown
- Irvine(Based on 10 reports) 40.0%
- Orange County(Based on 160 reports) 12.5%
- California(Based on 2,760 reports) 10.3%
| # | Date | Location | Vehicles | Drunk persons | Fatalites | Persons | Pedestrians |
|---|
| 1 | Apr 14, 2013 02:40 PM | I-405 | 2 | - | 1
| 2 | - |
| 2 | Apr 19, 2013 10:02 PM | Sr-73 Ramp | 1 | - | 1
| 2 | 1 |
| 3 | Mar 31, 2013 01:20 AM | Irvine Bl, Sand Canyon Ave | 2 | 2
| 1 | 3 | - |
| 4 | Jul 24, 2013 10:53 AM | Irvine Blvd, Alton Pkwy | 2 | - | 1
| 3 | - |
| 5 | Oct 18, 2013 10:31 AM | Cornell | 1 | - | 1
| 1 | 1 |
| 6 | Mar 8, 2013 06:19 PM | Trabuco Rd | 1 | - | 1
| 1 | 1 |
| 7 | Oct 11, 2013 06:46 AM | University Dr | 2 | - | 1
| 2 | - |
| 8 | Aug 26, 2013 00:52 AM | Sr-241 | 1 | 1
| 1 | 1 | - |
| 9 | Mar 12, 2013 07:21 AM | Eastwood | 1 | - | 2
| 1 | 2 |
| 10 | Sep 30, 2013 04:27 PM | Campus Dr | 1 | - | 1
| 1 | 1 |
Irvine fatal car crash and road traffic accident list for 2012
- Fatal accident count6
- Vehicles involved in fatal accidents9
- Fatal accidents involving drunk persons1
- Fatalities6
- Persons involved in fatal accidents11
- Pedestrians involved in fatal accidents1
Dark - Lighted
- Irvine(Based on 6 reports) 66.7%
- Orange County(Based on 147 reports) 49.0%
- California(Based on 2,727 reports) 27.5%
Daylight
- Irvine(Based on 6 reports) 33.3%
- Orange County(Based on 147 reports) 41.5%
- California(Based on 2,727 reports) 44.2%
Clear
- Irvine(Based on 6 reports) 100.0%
- Orange County(Based on 148 reports) 80.4%
- California(Based on 2,728 reports) 82.3%
Irvine fatal car crash and road traffic accident list for 2011
- Fatal accident count5
- Vehicles involved in fatal accidents10
- Fatal accidents involving drunk persons2
- Fatalities5
- Persons involved in fatal accidents18
- Pedestrians involved in fatal accidents1
Daylight
- Irvine(Based on 5 reports) 60.0%
- Orange County(Based on 127 reports) 35.4%
- California(Based on 2,591 reports) 45.3%
Dark - Lighted
- Irvine(Based on 5 reports) 40.0%
- Orange County(Based on 127 reports) 47.2%
- California(Based on 2,591 reports) 28.1%
Clear
- Irvine(Based on 5 reports) 80.0%
- Orange County(Based on 127 reports) 74.8%
- California(Based on 2,581 reports) 81.3%
Unknown
- Irvine(Based on 5 reports) 20.0%
- Orange County(Based on 127 reports) 22.0%
- California(Based on 2,581 reports) 15.1%
Irvine fatal car crash and road traffic accident list for 2010
- Fatal accident count5
- Vehicles involved in fatal accidents7
- Fatal accidents involving drunk persons3
- Fatalities5
- Persons involved in fatal accidents12
Dark - Lighted
- Irvine(Based on 5 reports) 60.0%
- Orange County(Based on 99 reports) 55.6%
- California(Based on 2,501 reports) 28.1%
Daylight
- Irvine(Based on 5 reports) 20.0%
- Orange County(Based on 99 reports) 34.3%
- California(Based on 2,501 reports) 42.5%
Dark - Unknown Lighting
- Irvine(Based on 5 reports) 20.0%
- Orange County(Based on 99 reports) 1.0%
- California(Based on 2,501 reports) 0.4%
Clear
- Irvine(Based on 5 reports) 60.0%
- Orange County(Based on 99 reports) 75.8%
- California(Based on 2,495 reports) 77.2%
Rain
- Irvine(Based on 5 reports) 40.0%
- Orange County(Based on 99 reports) 12.1%
- California(Based on 2,495 reports) 7.5%
Irvine fatal car crash and road traffic accident list for 2009
- Fatal accident count14
- Vehicles involved in fatal accidents22
- Fatal accidents involving drunk persons4
- Fatalities15
- Persons involved in fatal accidents31
- Pedestrians involved in fatal accidents3
Daylight
- Irvine(Based on 14 reports) 50.0%
- Orange County(Based on 140 reports) 40.7%
- California(Based on 2,811 reports) 45.3%
Dark - Lighted
- Irvine(Based on 14 reports) 42.9%
- Orange County(Based on 140 reports) 45.7%
- California(Based on 2,811 reports) 26.0%
Dark - Not Lighted
- Irvine(Based on 14 reports) 7.1%
- Orange County(Based on 140 reports) 9.3%
- California(Based on 2,811 reports) 24.1%
Clear
- Irvine(Based on 14 reports) 92.9%
- Orange County(Based on 141 reports) 96.5%
- California(Based on 2,816 reports) 94.7%
Rain
- Irvine(Based on 14 reports) 7.1%
- Orange County(Based on 141 reports) 2.8%
- California(Based on 2,816 reports) 4.0%
| # | Date | Location | Vehicles | Drunk persons | Fatalites | Persons | Pedestrians |
|---|
| 1 | Feb 26, 2009 06:40 PM | Fawnglen East, Deerfield Ave | 1 | - | 1
| 2 | 1 |
| 2 | Mar 7, 2009 03:26 AM | I-405 | 1 | 1
| 1 | 2 | - |
| 3 | May 1, 2009 07:50 AM | Sr-73 | 2 | - | 1
| 3 | - |
| 4 | May 25, 2009 04:52 PM | I-5 | 1 | - | 1
| 1 | - |
| 5 | May 29, 2009 11:47 AM | Havard Ave, Main St | 2 | - | 1
| 2 | - |
| 6 | Jul 27, 2009 02:28 AM | I-405 | 1 | 1
| 1 | 1 | - |
| 7 | Jul 25, 2009 01:15 PM | Walnut Ave, Wisteria | 2 | - | 1
| 2 | - |
| 8 | Aug 13, 2009 03:04 PM | Barranca Pkwy, W Yale Loop | 1 | - | 1
| 2 | 1 |
| 9 | Aug 20, 2009 11:35 PM | Shady Canyon Dr | 1 | 1
| 2 | 5 | - |
| 10 | Nov 3, 2009 09:51 PM | Irvine Center Dr, Harvard Ave | 1 | - | 1
| 2 | 1 |
| 11 | Aug 30, 2009 03:45 AM | I-405 | 1 | 1
| 1 | 1 | - |
| 12 | Nov 19, 2009 01:40 PM | Sr-261 | 1 | - | 1
| 1 | - |
| 13 | Dec 12, 2009 07:59 AM | Trabuco Rd | 1 | - | 1
| 1 | - |
| 14 | Dec 14, 2009 05:38 PM | University Dr | 6 | - | 1
| 6 | - |
Irvine fatal car crash and road traffic accident list for 2008
- Fatal accident count6
- Vehicles involved in fatal accidents6
- Fatal accidents involving drunk persons2
- Fatalities7
- Persons involved in fatal accidents9
- Pedestrians involved in fatal accidents1
Dark - Lighted
- Irvine(Based on 6 reports) 50.0%
- Orange County(Based on 153 reports) 43.8%
- California(Based on 3,141 reports) 25.0%
Daylight
- Irvine(Based on 6 reports) 33.3%
- Orange County(Based on 153 reports) 42.5%
- California(Based on 3,141 reports) 45.7%
Dark - Not Lighted
- Irvine(Based on 6 reports) 16.7%
- Orange County(Based on 153 reports) 11.1%
- California(Based on 3,141 reports) 25.2%
Clear
- Irvine(Based on 6 reports) 100.0%
- Orange County(Based on 153 reports) 94.8%
- California(Based on 3,145 reports) 94.2%
Irvine fatal car crash and road traffic accident list for 2007
- Fatal accident count7
- Vehicles involved in fatal accidents13
- Fatal accidents involving drunk persons2
- Fatalities7
- Persons involved in fatal accidents19
- Pedestrians involved in fatal accidents1
Daylight
- Irvine(Based on 7 reports) 57.1%
- Orange County(Based on 177 reports) 35.0%
- California(Based on 3,574 reports) 46.4%
Dark - Lighted
- Irvine(Based on 7 reports) 28.6%
- Orange County(Based on 177 reports) 49.2%
- California(Based on 3,574 reports) 25.2%
Dark - Not Lighted
- Irvine(Based on 7 reports) 14.3%
- Orange County(Based on 177 reports) 13.0%
- California(Based on 3,574 reports) 24.2%
Clear
- Irvine(Based on 7 reports) 100.0%
- Orange County(Based on 179 reports) 96.1%
- California(Based on 3,591 reports) 95.4%
| # | Date | Location | Vehicles | Drunk persons | Fatalites | Persons | Pedestrians |
|---|
| 1 | Mar 31, 2007 08:36 PM | Yale Ave | 1 | - | 1
| 2 | - |
| 2 | Jun 29, 2007 05:11 AM | I-405 | 2 | - | 1
| 2 | - |
| 3 | Aug 23, 2007 04:39 PM | I-405 | 3 | - | 1
| 5 | - |
| 4 | Aug 22, 2007 11:00 PM | I-5 Ramp | 2 | 1
| 1 | 2 | - |
| 5 | Oct 20, 2007 03:40 AM | I-5 | 2 | 1
| 1 | 2 | - |
| 6 | Sep 15, 2007 10:04 AM | Culver Dr | 1 | - | 1
| 2 | 1 |
| 7 | Jul 3, 2007 02:14 PM | Irvine Center Dr | 2 | - | 1
| 4 | - |
Irvine fatal car crash and road traffic accident list for 2006
- Fatal accident count12
- Vehicles involved in fatal accidents21
- Fatal accidents involving drunk persons4
- Fatalities12
- Persons involved in fatal accidents45
- Pedestrians involved in fatal accidents2
Daylight
- Irvine(Based on 11 reports) 63.6%
- Orange County(Based on 196 reports) 36.7%
- California(Based on 3,824 reports) 45.4%
Dark - Lighted
- Irvine(Based on 11 reports) 18.2%
- Orange County(Based on 196 reports) 44.4%
- California(Based on 3,824 reports) 25.2%
Dusk
- Irvine(Based on 11 reports) 9.1%
- Orange County(Based on 196 reports) 3.1%
- California(Based on 3,824 reports) 2.2%
Dark - Not Lighted
- Irvine(Based on 11 reports) 9.1%
- Orange County(Based on 196 reports) 13.8%
- California(Based on 3,824 reports) 25.2%
Clear
- Irvine(Based on 12 reports) 100.0%
- Orange County(Based on 197 reports) 95.4%
- California(Based on 3,839 reports) 93.9%
| # | Date | Location | Vehicles | Drunk persons | Fatalites | Persons | Pedestrians |
|---|
| 1 | Jan 19, 2006 02:00 PM | Sr-261 | 1 | - | 1
| 1 | - |
| 2 | Mar 24, 2006 04:39 PM | University Dr, Ridgeline Dr | 3 | - | 1
| 3 | - |
| 3 | Jun 18, 2006 11:38 PM | I-405 | 1 | - | 1
| 3 | 1 |
| 4 | Jul 2, 2006 08:20 PM | I-405 | 2 | - | 1
| 3 | - |
| 5 | Aug 12, 2006 05:02 AM | I-405 | 1 | - | 1
| 4 | - |
| 6 | Aug 8, 2006 09:15 PM | Sr-73 | 1 | 1
| 1 | 2 | - |
| 7 | Jun 14, 2006 07:01 PM | I-5 | 7 | - | 1
| 20 | - |
| 8 | Aug 3, 2006 03:20 AM | Irvine Blvd | 1 | 1
| 1 | 1 | - |
| 9 | Sep 1, 2006 08:54 AM | Michelson Dr, Butler St | 1 | - | 1
| 2 | 1 |
| 10 | Sep 28, 2006 10:36 PM | Sr-261 | 1 | 1
| 1 | 1 | - |
| 11 | Nov 12, 2006 03:30 PM | Perimeter Rd | 1 | 1
| 1 | 1 | - |
| 12 | Nov 12, 2006 04:20 PM | I-5 | 1 | - | 1
| 4 | - |
Irvine fatal car crash and road traffic accident list for 2005
- Fatal accident count10
- Vehicles involved in fatal accidents13
- Fatal accidents involving drunk persons3
- Fatalities11
- Persons involved in fatal accidents26
Dark - Lighted
- Irvine(Based on 10 reports) 60.0%
- Orange County(Based on 189 reports) 45.5%
- California(Based on 3,842 reports) 24.4%
Daylight
- Irvine(Based on 10 reports) 30.0%
- Orange County(Based on 189 reports) 36.0%
- California(Based on 3,842 reports) 46.3%
Dawn
- Irvine(Based on 10 reports) 10.0%
- Orange County(Based on 189 reports) 2.1%
- California(Based on 3,842 reports) 1.7%
Clear
- Irvine(Based on 10 reports) 100.0%
- Orange County(Based on 189 reports) 96.3%
- California(Based on 3,849 reports) 92.3%
| # | Date | Location | Vehicles | Drunk persons | Fatalites | Persons | Pedestrians |
|---|
| 1 | Apr 29, 2005 09:55 AM | Sr-73 | 1 | - | 1
| 2 | - |
| 2 | May 14, 2005 03:31 AM | Irvine Blvd | 1 | 1
| 1 | 1 | - |
| 3 | May 26, 2005 07:18 PM | Sr-73 | 1 | - | 2
| 6 | - |
| 4 | Aug 12, 2005 11:00 PM | Jamboree Rd, Walnut Ave | 1 | - | 1
| 3 | - |
| 5 | Sep 13, 2005 09:41 PM | Alton Parkway | 1 | 1
| 1 | 1 | - |
| 6 | Jul 23, 2005 02:05 AM | Sr-133 Ramp | 1 | 1
| 1 | 1 | - |
| 7 | Sep 28, 2005 01:32 AM | I-5 Ramp, Barranca Pkwy | 1 | - | 1
| 2 | - |
| 8 | Oct 23, 2005 08:36 PM | Harvard Ave, Michelson Dr | 2 | - | 1
| 5 | - |
| 9 | May 4, 2005 08:30 AM | I-405 | 2 | - | 1
| 3 | - |
| 10 | Nov 30, 2005 06:17 AM | Culver Dr, Michelson Dr | 2 | - | 1
| 2 | - |
Irvine fatal car crash and road traffic accident list for 2004
- Fatal accident count11
- Vehicles involved in fatal accidents19
- Fatal accidents involving drunk persons3
- Fatalities12
- Persons involved in fatal accidents30
- Pedestrians involved in fatal accidents3
Dark - Not Lighted
- Irvine(Based on 11 reports) 36.4%
- Orange County(Based on 200 reports) 14.5%
- California(Based on 3,720 reports) 24.7%
Dark - Lighted
- Irvine(Based on 11 reports) 27.3%
- Orange County(Based on 200 reports) 43.0%
- California(Based on 3,720 reports) 23.6%
Daylight
- Irvine(Based on 11 reports) 27.3%
- Orange County(Based on 200 reports) 37.0%
- California(Based on 3,720 reports) 47.3%
Dawn
- Irvine(Based on 11 reports) 9.1%
- Orange County(Based on 200 reports) 3.0%
- California(Based on 3,720 reports) 2.0%
Clear
- Irvine(Based on 11 reports) 72.7%
- Orange County(Based on 201 reports) 94.5%
- California(Based on 3,727 reports) 93.5%
Rain
- Irvine(Based on 11 reports) 27.3%
- Orange County(Based on 201 reports) 5.5%
- California(Based on 3,727 reports) 4.3%
| # | Date | Location | Vehicles | Drunk persons | Fatalites | Persons | Pedestrians |
|---|
| 1 | Jan 19, 2004 01:50 AM | Bake Pky, Jeronimo Rd | 1 | - | 1
| 2 | - |
| 2 | Feb 21, 2004 03:01 PM | Alton Pky, Laguna Cyn Rd | 1 | - | 1
| 2 | - |
| 3 | Feb 26, 2004 05:30 AM | I-405 | 1 | - | 1
| 1 | - |
| 4 | May 24, 2004 05:15 PM | Shady Canyon Rd | 1 | - | 1
| 2 | 1 |
| 5 | Jun 3, 2004 10:53 PM | Sr-73 | 1 | 1
| 1 | 1 | - |
| 6 | Jun 30, 2004 05:53 AM | I-5 | 2 | - | 1
| 2 | - |
| 7 | Jul 7, 2004 11:26 PM | West Yale Loop | 2 | 1
| 2 | 5 | - |
| 8 | Aug 13, 2004 06:33 AM | Culver Dr, Alton Pky | 4 | - | 1
| 4 | - |
| 9 | Sep 18, 2004 01:27 AM | I-405 | 3 | 1
| 1 | 6 | - |
| 10 | Oct 30, 2004 11:04 PM | I-5 | 1 | - | 1
| 3 | 1 |
| 11 | Dec 21, 2004 02:14 AM | I-5 | 2 | - | 1
| 2 | 1 |
Irvine fatal car crash and road traffic accident list for 2003
- Fatal accident count16
- Vehicles involved in fatal accidents25
- Fatal accidents involving drunk persons5
- Fatalities18
- Persons involved in fatal accidents45
- Pedestrians involved in fatal accidents3
Daylight
- Irvine(Based on 16 reports) 43.8%
- Orange County(Based on 197 reports) 44.2%
- California(Based on 3,724 reports) 48.3%
Dark - Lighted
- Irvine(Based on 16 reports) 43.8%
- Orange County(Based on 197 reports) 37.6%
- California(Based on 3,724 reports) 22.7%
Dark - Not Lighted
- Irvine(Based on 16 reports) 12.5%
- Orange County(Based on 197 reports) 15.7%
- California(Based on 3,724 reports) 25.5%
Clear
- Irvine(Based on 16 reports) 81.3%
- Orange County(Based on 197 reports) 92.9%
- California(Based on 3,731 reports) 93.3%
Rain
- Irvine(Based on 16 reports) 12.5%
- Orange County(Based on 197 reports) 4.1%
- California(Based on 3,731 reports) 4.6%
Fog, Smog, Smoke
- Irvine(Based on 16 reports) 6.3%
- Orange County(Based on 197 reports) 3.0%
- California(Based on 3,731 reports) 1.5%
| # | Date | Location | Vehicles | Drunk persons | Fatalites | Persons | Pedestrians |
|---|
| 1 | Jan 17, 2003 06:58 PM | Barranca Pky | 1 | - | 1
| 1 | - |
| 2 | Feb 3, 2003 04:49 PM | Bryan Ave | 1 | - | 1
| 2 | 1 |
| 3 | Feb 25, 2003 04:08 AM | I-5 | 2 | - | 1
| 1 | - |
| 4 | Aug 3, 2003 03:40 PM | I-405 | 1 | 1
| 1 | 1 | - |
| 5 | Aug 10, 2003 00:49 AM | I-405 | 1 | 1
| 1 | 1 | - |
| 6 | Jul 13, 2003 09:05 PM | Main St | 2 | - | 1
| 3 | - |
| 7 | Aug 23, 2003 12:14 AM | Main St | 2 | - | 1
| 3 | - |
| 8 | Sep 3, 2003 07:23 PM | Bryan Ave | 2 | - | 1
| 2 | - |
| 9 | Sep 20, 2003 04:35 AM | I-5 | 1 | 1
| 1 | 1 | - |
| 10 | Oct 21, 2003 10:22 AM | Culver Dr | 1 | - | 1
| 3 | 1 |
| 11 | Oct 29, 2003 11:14 AM | Sand Canyon Ave | 1 | - | 1
| 1 | - |
| 12 | Nov 1, 2003 03:20 AM | Sr-73 | 1 | - | 1
| 4 | - |
| 13 | Nov 4, 2003 07:58 AM | University Dr | 3 | - | 1
| 5 | - |
| 14 | Oct 24, 2003 06:50 PM | I-405` | 4 | 2
| 2 | 12 | - |
| 15 | Dec 8, 2003 05:07 PM | Culver Dr | 1 | - | 1
| 2 | 1 |
| 16 | Dec 21, 2003 04:25 AM | I-5 | 1 | - | 2
| 3 | - |
Irvine fatal car crash and road traffic accident list for 2002
- Fatal accident count5
- Vehicles involved in fatal accidents9
- Fatal accidents involving drunk persons2
- Fatalities6
- Persons involved in fatal accidents15
Dark - Lighted
- Irvine(Based on 5 reports) 40.0%
- Orange County(Based on 179 reports) 40.8%
- California(Based on 3,640 reports) 22.7%
Daylight
- Irvine(Based on 5 reports) 20.0%
- Orange County(Based on 179 reports) 42.5%
- California(Based on 3,640 reports) 46.9%
Dusk
- Irvine(Based on 5 reports) 20.0%
- Orange County(Based on 179 reports) 2.8%
- California(Based on 3,640 reports) 2.6%
Dark - Not Lighted
- Irvine(Based on 5 reports) 20.0%
- Orange County(Based on 179 reports) 12.8%
- California(Based on 3,640 reports) 26.0%
Clear
- Irvine(Based on 5 reports) 100.0%
- Orange County(Based on 179 reports) 96.6%
- California(Based on 3,654 reports) 93.8%
| # | Date | Location | Vehicles | Drunk persons | Fatalites | Persons | Pedestrians |
|---|
| 1 | Feb 2, 2002 10:05 PM | I-5 | 2 | 2
| 1 | 6 | - |
| 2 | Jan 26, 2002 08:07 PM | Macarthur Blvd | 2 | - | 1
| 3 | - |
| 3 | Mar 23, 2002 11:30 AM | Culver Dr | 1 | - | 1
| 1 | - |
| 4 | Apr 5, 2002 06:18 PM | Sr-73 | 3 | - | 2
| 4 | - |
| 5 | Nov 17, 2002 06:10 PM | I-405 | 1 | - | 1
| 1 | - |
Irvine fatal car crash and road traffic accident list for 2001
- Fatal accident count10
- Vehicles involved in fatal accidents16
- Fatal accidents involving drunk persons6
- Fatalities10
- Persons involved in fatal accidents24
- Pedestrians involved in fatal accidents2
Daylight
- Irvine(Based on 10 reports) 50.0%
- Orange County(Based on 185 reports) 43.2%
- California(Based on 3,532 reports) 48.8%
Dark - Lighted
- Irvine(Based on 10 reports) 30.0%
- Orange County(Based on 185 reports) 34.6%
- California(Based on 3,532 reports) 22.6%
Dark - Not Lighted
- Irvine(Based on 10 reports) 20.0%
- Orange County(Based on 185 reports) 16.8%
- California(Based on 3,532 reports) 24.3%
Clear
- Irvine(Based on 10 reports) 100.0%
- Orange County(Based on 185 reports) 96.2%
- California(Based on 3,543 reports) 92.0%
| # | Date | Location | Vehicles | Drunk persons | Fatalites | Persons | Pedestrians |
|---|
| 1 | Jan 1, 2001 12:38 AM | I-5 | 2 | - | 1
| 2 | - |
| 2 | Mar 30, 2001 04:16 PM | I-405 | 3 | 1
| 1 | 4 | - |
| 3 | Jun 1, 2001 12:20 AM | Bryan Ave | 2 | - | 1
| 4 | - |
| 4 | Jun 3, 2001 02:03 PM | Irvine Center Dr | 1 | 1
| 1 | 1 | - |
| 5 | Jul 17, 2001 09:46 PM | I-5 | 1 | 1
| 1 | 3 | 2 |
| 6 | Aug 27, 2001 05:15 AM | I-405 | 1 | 1
| 1 | 1 | - |
| 7 | Aug 25, 2001 11:34 PM | Sr-73 | 1 | 1
| 1 | 1 | - |
| 8 | Oct 18, 2001 00:22 AM | Harvard Ave | 1 | 1
| 1 | 2 | - |
| 9 | Nov 8, 2001 04:33 AM | Culver Dr | 2 | - | 1
| 2 | - |
| 10 | Dec 26, 2001 06:58 AM | Culver Dr | 2 | - | 1
| 4 | - |
Irvine fatal car crash and road traffic accident list for 2000
- Fatal accident count10
- Vehicles involved in fatal accidents21
- Fatal accidents involving drunk persons3
- Fatalities10
- Persons involved in fatal accidents27
- Pedestrians involved in fatal accidents2
Daylight
- Irvine(Based on 10 reports) 60.0%
- Orange County(Based on 156 reports) 39.7%
- California(Based on 3,343 reports) 48.2%
Dark - Not Lighted
- Irvine(Based on 10 reports) 30.0%
- Orange County(Based on 156 reports) 16.7%
- California(Based on 3,343 reports) 24.9%
Dark - Lighted
- Irvine(Based on 10 reports) 10.0%
- Orange County(Based on 156 reports) 35.9%
- California(Based on 3,343 reports) 22.7%
Clear
- Irvine(Based on 10 reports) 90.0%
- Orange County(Based on 156 reports) 93.6%
- California(Based on 3,348 reports) 93.2%
Rain
- Irvine(Based on 10 reports) 10.0%
- Orange County(Based on 156 reports) 5.8%
- California(Based on 3,348 reports) 4.9%
| # | Date | Location | Vehicles | Drunk persons | Fatalites | Persons | Pedestrians |
|---|
| 1 | Mar 9, 2000 12:00 AM | I-5 | 5 | - | 1
| 7 | - |
| 2 | Jul 13, 2000 00:51 AM | I-405 | 1 | 1
| 1 | 1 | - |
| 3 | Jun 18, 2000 03:55 PM | I-405 | 1 | - | 1
| 1 | - |
| 4 | Jul 1, 2000 11:51 AM | Macarthur Blvd | 2 | - | 1
| 2 | - |
| 5 | Aug 24, 2000 11:25 AM | Irvine Blvd | 2 | - | 1
| 2 | - |
| 6 | Nov 14, 2000 09:30 AM | I-5 | 1 | - | 1
| 2 | 1 |
| 7 | Nov 16, 2000 03:47 AM | I-5 | 2 | 1
| 1 | 2 | - |
| 8 | Jul 22, 2000 00:15 AM | Bake Pky | 3 | 1
| 1 | 4 | - |
| 9 | Oct 26, 2000 10:00 AM | I-5 | 3 | - | 1
| 4 | - |
| 10 | Dec 18, 2000 06:46 PM | Lake Rd | 1 | - | 1
| 2 | 1 |
Irvine fatal car crash and road traffic accident list for 1999
- Fatal accident count16
- Vehicles involved in fatal accidents23
- Fatal accidents involving drunk persons4
- Fatalities16
- Persons involved in fatal accidents48
- Pedestrians involved in fatal accidents2
Dark - Lighted
- Irvine(Based on 16 reports) 50.0%
- Orange County(Based on 159 reports) 48.4%
- California(Based on 3,137 reports) 22.8%
Daylight
- Irvine(Based on 16 reports) 50.0%
- Orange County(Based on 159 reports) 39.0%
- California(Based on 3,137 reports) 48.1%
Clear
- Irvine(Based on 16 reports) 93.8%
- Orange County(Based on 159 reports) 95.6%
- California(Based on 3,148 reports) 93.8%
Rain
- Irvine(Based on 16 reports) 6.3%
- Orange County(Based on 159 reports) 3.8%
- California(Based on 3,148 reports) 3.9%
| # | Date | Location | Vehicles | Drunk persons | Fatalites | Persons | Pedestrians |
|---|
| 1 | Jan 10, 1999 02:31 AM | Sr-73 | 1 | - | 1
| 2 | - |
| 2 | Mar 5, 1999 09:30 PM | Walnut Ave | 1 | 1
| 1 | 5 | 1 |
| 3 | Apr 6, 1999 04:15 AM | I-405 | 1 | - | 1
| 3 | - |
| 4 | Mar 25, 1999 12:29 AM | Alton Parkway | 1 | - | 1
| 4 | - |
| 5 | Apr 14, 1999 06:35 AM | I-5 | 2 | - | 1
| 5 | - |
| 6 | Apr 9, 1999 09:00 AM | Sr-261 | 1 | - | 1
| 1 | - |
| 7 | Jul 17, 1999 02:35 PM | Sand Canyon Ave | 1 | 1
| 1 | 1 | - |
| 8 | Oct 12, 1999 11:00 PM | Yale Ave | 1 | - | 1
| 1 | - |
| 9 | Aug 25, 1999 09:44 PM | Sand Canyon Ave | 2 | 2
| 1 | 4 | - |
| 10 | Oct 16, 1999 01:15 AM | Culver Dr | 1 | - | 1
| 2 | - |
| 11 | Oct 13, 1999 11:25 AM | Trabuco Rd | 1 | - | 1
| 1 | - |
| 12 | Dec 1, 1999 12:47 AM | I-405 | 1 | - | 1
| 1 | - |
| 13 | Dec 8, 1999 04:32 AM | I-5 | 1 | - | 1
| 2 | 1 |
| 14 | Oct 20, 1999 07:05 AM | I-5 | 4 | - | 1
| 11 | - |
| 15 | Dec 5, 1999 01:00 AM | Alton Pky | 1 | - | 1
| 2 | - |
| 16 | Dec 20, 1999 11:18 AM | Sr-133 | 3 | - | 1
| 3 | - |
Irvine fatal car crash and road traffic accident list for 1998
- Fatal accident count7
- Vehicles involved in fatal accidents13
- Fatal accidents involving drunk persons1
- Fatalities7
- Persons involved in fatal accidents21
- Pedestrians involved in fatal accidents3
Daylight
- Irvine(Based on 7 reports) 57.1%
- Orange County(Based on 149 reports) 45.0%
- California(Based on 3,110 reports) 49.0%
Dark - Lighted
- Irvine(Based on 7 reports) 28.6%
- Orange County(Based on 149 reports) 35.6%
- California(Based on 3,110 reports) 22.2%
Dusk
- Irvine(Based on 7 reports) 14.3%
- Orange County(Based on 149 reports) 4.0%
- California(Based on 3,110 reports) 2.5%
Clear
- Irvine(Based on 7 reports) 71.4%
- Orange County(Based on 149 reports) 92.6%
- California(Based on 3,112 reports) 89.7%
Rain
- Irvine(Based on 7 reports) 28.6%
- Orange County(Based on 149 reports) 7.4%
- California(Based on 3,112 reports) 8.3%
| # | Date | Location | Vehicles | Drunk persons | Fatalites | Persons | Pedestrians |
|---|
| 1 | Jan 9, 1998 05:40 PM | Barranca Pkwy | 2 | - | 1
| 3 | - |
| 2 | Apr 19, 1998 04:45 PM | Harvard Ave | 2 | 1
| 1 | 2 | - |
| 3 | May 13, 1998 11:30 AM | I-5 | 1 | - | 1
| 1 | - |
| 4 | May 9, 1998 07:30 AM | I-405 | 1 | - | 1
| 1 | - |
| 5 | Jun 23, 1998 10:01 AM | Irvine Blvd | 4 | - | 1
| 6 | - |
| 6 | Nov 17, 1998 00:09 AM | I-405 | 2 | - | 1
| 5 | 1 |
| 7 | Nov 24, 1998 04:55 PM | University Dr | 1 | - | 1
| 3 | 2 |
Irvine fatal car crash and road traffic accident list for 1997
- Fatal accident count12
- Vehicles involved in fatal accidents26
- Fatal accidents involving drunk persons1
- Fatalities15
- Persons involved in fatal accidents43
- Pedestrians involved in fatal accidents6
Dark - Not Lighted
- Irvine(Based on 12 reports) 41.7%
- Orange County(Based on 168 reports) 15.5%
- California(Based on 3,271 reports) 24.6%
Dark - Lighted
- Irvine(Based on 12 reports) 33.3%
- Orange County(Based on 168 reports) 41.1%
- California(Based on 3,271 reports) 21.9%
Daylight
- Irvine(Based on 12 reports) 25.0%
- Orange County(Based on 168 reports) 39.9%
- California(Based on 3,271 reports) 49.1%
Clear
- Irvine(Based on 12 reports) 100.0%
- Orange County(Based on 168 reports) 92.3%
- California(Based on 3,279 reports) 93.8%
| # | Date | Location | Vehicles | Drunk persons | Fatalites | Persons | Pedestrians |
|---|
| 1 | Jan 23, 1997 05:54 PM | Jeffery Rd | 1 | - | 1
| 2 | 1 |
| 2 | Feb 26, 1997 05:02 AM | Meadowwood | 1 | - | 1
| 1 | - |
| 3 | Feb 13, 1997 05:25 AM | I405 | 1 | - | 1
| 1 | - |
| 4 | Mar 9, 1997 00:25 AM | 133 | 2 | 1
| 1 | 3 | - |
| 5 | Apr 11, 1997 01:55 AM | Irvinectr | 2 | - | 1
| 2 | - |
| 6 | Apr 14, 1997 07:45 PM | Michelson | 1 | - | 1
| 2 | 1 |
| 7 | Jul 3, 1997 02:43 PM | Macarther | 2 | - | 1
| 5 | - |
| 8 | Mar 26, 1997 00:15 AM | I5 | 9 | - | 4
| 17 | - |
| 9 | Aug 20, 1997 06:30 AM | I5 | 3 | - | 1
| 5 | 3 |
| 10 | Sep 25, 1997 10:13 PM | I405 | 2 | - | 1
| 2 | - |
| 11 | Oct 27, 1997 04:00 AM | I5 | 1 | - | 1
| 2 | 1 |
| 12 | Dec 30, 1997 03:05 PM | I405 | 1 | - | 1
| 1 | - |
Irvine fatal car crash and road traffic accident list for 1996
- Fatal accident count8
- Vehicles involved in fatal accidents15
- Fatal accidents involving drunk persons1
- Fatalities11
- Persons involved in fatal accidents26
Daylight
- Irvine(Based on 8 reports) 50.0%
- Orange County(Based on 178 reports) 41.0%
- California(Based on 3,568 reports) 46.5%
Dark - Lighted
- Irvine(Based on 8 reports) 25.0%
- Orange County(Based on 178 reports) 41.0%
- California(Based on 3,568 reports) 23.8%
Dawn
- Irvine(Based on 8 reports) 12.5%
- Orange County(Based on 178 reports) 3.4%
- California(Based on 3,568 reports) 2.2%
Dark - Not Lighted
- Irvine(Based on 8 reports) 12.5%
- Orange County(Based on 178 reports) 13.5%
- California(Based on 3,568 reports) 25.2%
Clear
- Irvine(Based on 8 reports) 100.0%
- Orange County(Based on 178 reports) 95.5%
- California(Based on 3,576 reports) 91.7%
| # | Date | Location | Vehicles | Drunk persons | Fatalites | Persons | Pedestrians |
|---|
| 1 | Jan 9, 1996 10:54 AM | I405 | 3 | - | 2
| 3 | - |
| 2 | May 23, 1996 00:20 AM | Jamboreerd | 2 | 1
| 3 | 6 | - |
| 3 | May 23, 1996 11:35 PM | I405 | 1 | - | 1
| 1 | - |
| 4 | Jun 23, 1996 09:45 PM | Trabuco Rd | 1 | - | 1
| 2 | - |
| 5 | Sep 27, 1996 10:26 AM | Redhillave | 2 | - | 1
| 2 | - |
| 6 | Oct 22, 1996 11:45 AM | Culver Dr | 2 | - | 1
| 3 | - |
| 7 | Oct 26, 1996 07:40 AM | I405 | 2 | - | 1
| 7 | - |
| 8 | Nov 18, 1996 01:14 PM | Main | 2 | - | 1
| 2 | - |
Irvine fatal car crash and road traffic accident list for 1995
- Fatal accident count8
- Vehicles involved in fatal accidents17
- Fatal accidents involving drunk persons3
- Fatalities10
- Persons involved in fatal accidents26
- Pedestrians involved in fatal accidents1
Daylight
- Irvine(Based on 8 reports) 50.0%
- Orange County(Based on 161 reports) 44.7%
- California(Based on 3,669 reports) 46.7%
Dark - Lighted
- Irvine(Based on 8 reports) 25.0%
- Orange County(Based on 161 reports) 42.2%
- California(Based on 3,669 reports) 22.9%
Dark - Not Lighted
- Irvine(Based on 8 reports) 25.0%
- Orange County(Based on 161 reports) 11.8%
- California(Based on 3,669 reports) 26.2%
Clear
- Irvine(Based on 8 reports) 75.0%
- Orange County(Based on 161 reports) 93.2%
- California(Based on 3,669 reports) 91.0%
Fog, Smog, Smoke
- Irvine(Based on 8 reports) 12.5%
- Orange County(Based on 161 reports) 3.7%
- California(Based on 3,669 reports) 1.6%
Rain
- Irvine(Based on 8 reports) 12.5%
- Orange County(Based on 161 reports) 3.1%
- California(Based on 3,669 reports) 7.0%
| # | Date | Location | Vehicles | Drunk persons | Fatalites | Persons | Pedestrians |
|---|
| 1 | Jan 12, 1995 04:55 AM | Jamboreerd | 2 | - | 1
| 2 | - |
| 2 | Mar 25, 1995 01:45 AM | I405 | 1 | 1
| 1 | 3 | - |
| 3 | May 31, 1995 10:55 AM | I405 | 2 | - | 1
| 2 | - |
| 4 | Sep 10, 1995 09:51 PM | 73 | 3 | 1
| 2 | 4 | - |
| 5 | Sep 30, 1995 07:40 PM | I5 | 1 | - | 2
| 5 | - |
| 6 | Oct 1, 1995 10:30 AM | Mcarthurbl | 3 | - | 1
| 4 | - |
| 7 | Oct 2, 1995 10:50 AM | Harvard Av | 2 | - | 1
| 2 | - |
| 8 | Nov 18, 1995 07:15 AM | I5 | 3 | 1
| 1 | 4 | 1 |
Irvine fatal car crash and road traffic accident list for 1994
- Fatal accident count10
- Vehicles involved in fatal accidents18
- Fatal accidents involving drunk persons1
- Fatalities11
- Persons involved in fatal accidents25
- Pedestrians involved in fatal accidents4
Daylight
- Irvine(Based on 10 reports) 50.0%
- Orange County(Based on 172 reports) 40.7%
- California(Based on 3,784 reports) 48.6%
Dark - Lighted
- Irvine(Based on 10 reports) 40.0%
- Orange County(Based on 172 reports) 43.6%
- California(Based on 3,784 reports) 23.3%
Dark - Not Lighted
- Irvine(Based on 10 reports) 10.0%
- Orange County(Based on 172 reports) 11.6%
- California(Based on 3,784 reports) 23.9%
Clear
- Irvine(Based on 10 reports) 100.0%
- Orange County(Based on 172 reports) 94.8%
- California(Based on 3,787 reports) 93.1%
| # | Date | Location | Vehicles | Drunk persons | Fatalites | Persons | Pedestrians |
|---|
| 1 | Jan 29, 1994 03:13 AM | I405 | 2 | - | 1
| 2 | 1 |
| 2 | Jan 23, 1994 08:40 AM | I5 | 2 | 1
| 1 | 4 | - |
| 3 | Apr 2, 1994 10:25 AM | Macarthur | 2 | - | 1
| 3 | - |
| 4 | May 31, 1994 10:45 PM | Yale Ave | 2 | - | 1
| 3 | - |
| 5 | Jun 16, 1994 12:15 AM | Campus Dr | 2 | - | 2
| 3 | - |
| 6 | Sep 26, 1994 07:44 PM | Sandcynave | 1 | - | 1
| 2 | 1 |
| 7 | Sep 28, 1994 10:00 PM | I5 | 2 | - | 1
| 3 | 1 |
| 8 | Nov 7, 1994 09:40 AM | I5 | 2 | - | 1
| 2 | - |
| 9 | Nov 9, 1994 06:05 PM | Eastyalelp | 1 | - | 1
| 2 | 1 |
| 10 | Dec 1, 1994 01:38 PM | 73 | 2 | - | 1
| 1 | - |
Irvine fatal car crash and road traffic accident list for 1993
- Fatal accident count14
- Vehicles involved in fatal accidents21
- Fatal accidents involving drunk persons4
- Fatalities16
- Persons involved in fatal accidents44
- Pedestrians involved in fatal accidents6
Daylight
- Irvine(Based on 14 reports) 50.0%
- Orange County(Based on 185 reports) 36.2%
- California(Based on 3,682 reports) 46.1%
Dark - Not Lighted
- Irvine(Based on 14 reports) 28.6%
- Orange County(Based on 185 reports) 19.5%
- California(Based on 3,682 reports) 26.0%
Dark - Lighted
- Irvine(Based on 14 reports) 21.4%
- Orange County(Based on 185 reports) 42.2%
- California(Based on 3,682 reports) 24.0%
Clear
- Irvine(Based on 14 reports) 100.0%
- Orange County(Based on 185 reports) 95.7%
- California(Based on 3,687 reports) 93.4%
| # | Date | Location | Vehicles | Drunk persons | Fatalites | Persons | Pedestrians |
|---|
| 1 | Jan 4, 1993 12:15 AM | Normandie | 1 | - | 1
| 7 | 2 |
| 2 | Jan 10, 1993 09:15 PM | I5 | 1 | 1
| 1 | 1 | - |
| 3 | Feb 13, 1993 03:55 AM | Trabuco Rd | 1 | 1
| 1 | 1 | - |
| 4 | Feb 16, 1993 10:45 AM | Sanjoaquin | 1 | - | 1
| 3 | 2 |
| 5 | Mar 28, 1993 11:36 AM | Jeffrey Rd | 3 | - | 1
| 6 | - |
| 6 | May 26, 1993 04:10 PM | I405 | 2 | - | 1
| 3 | - |
| 7 | Jul 11, 1993 10:35 PM | I5 | 2 | - | 1
| 4 | 1 |
| 8 | Jul 7, 1993 03:25 PM | Irvinecndr | 2 | - | 1
| 3 | - |
| 9 | Jul 29, 1993 09:15 AM | I405 | 3 | - | 1
| 6 | - |
| 10 | Sep 6, 1993 08:00 PM | I405 | 1 | 1
| 1 | 2 | - |
| 11 | Oct 7, 1993 09:05 PM | Alton Pkwy | 1 | - | 2
| 3 | - |
| 12 | Oct 13, 1993 02:35 PM | 133 | 1 | - | 1
| 1 | - |
| 13 | Dec 24, 1993 00:30 AM | I405 | 1 | - | 1
| 2 | 1 |
| 14 | Oct 9, 1993 01:35 AM | 73 | 1 | 1
| 2 | 2 | - |
Irvine fatal car crash and road traffic accident list for 1992
- Fatal accident count10
- Vehicles involved in fatal accidents17
- Fatal accidents involving drunk persons6
- Fatalities10
- Persons involved in fatal accidents35
- Pedestrians involved in fatal accidents1
Dark - Lighted
- Irvine(Based on 10 reports) 60.0%
- Orange County(Based on 192 reports) 38.0%
- California(Based on 3,717 reports) 25.2%
Daylight
- Irvine(Based on 10 reports) 30.0%
- Orange County(Based on 192 reports) 41.1%
- California(Based on 3,717 reports) 45.5%
Dark - Not Lighted
- Irvine(Based on 10 reports) 10.0%
- Orange County(Based on 192 reports) 15.1%
- California(Based on 3,717 reports) 25.6%
Clear
- Irvine(Based on 10 reports) 80.0%
- Orange County(Based on 192 reports) 91.7%
- California(Based on 3,722 reports) 92.3%
Rain
- Irvine(Based on 10 reports) 20.0%
- Orange County(Based on 192 reports) 7.8%
- California(Based on 3,722 reports) 6.3%
| # | Date | Location | Vehicles | Drunk persons | Fatalites | Persons | Pedestrians |
|---|
| 1 | Jan 5, 1992 09:53 AM | I5 | 1 | - | 1
| 8 | - |
| 2 | May 2, 1992 09:45 AM | Culver Dr | 3 | - | 1
| 5 | - |
| 3 | Aug 8, 1992 00:35 AM | Culver Dr | 3 | 1
| 1 | 4 | - |
| 4 | Aug 12, 1992 01:55 AM | Irvinecntr | 1 | 1
| 1 | 1 | - |
| 5 | Aug 27, 1992 03:35 AM | Jamboreerd | 1 | 1
| 1 | 2 | 1 |
| 6 | Sep 3, 1992 00:45 AM | I405 | 1 | 1
| 1 | 1 | - |
| 7 | Jul 22, 1992 10:10 AM | 133 | 2 | - | 1
| 2 | - |
| 8 | Nov 4, 1992 00:55 AM | I405 | 1 | 1
| 1 | 2 | - |
| 9 | Dec 12, 1992 11:40 PM | I5 | 2 | 1
| 1 | 2 | - |
| 10 | Dec 28, 1992 00:30 AM | I5 | 2 | - | 1
| 8 | - |
Irvine fatal car crash and road traffic accident list for 1991
- Fatal accident count10
- Vehicles involved in fatal accidents23
- Fatal accidents involving drunk persons2
- Fatalities11
- Persons involved in fatal accidents39
- Pedestrians involved in fatal accidents2
Dark - Not Lighted
- Irvine(Based on 10 reports) 50.0%
- Orange County(Based on 194 reports) 18.0%
- California(Based on 4,189 reports) 25.8%
Daylight
- Irvine(Based on 10 reports) 40.0%
- Orange County(Based on 194 reports) 43.8%
- California(Based on 4,189 reports) 45.2%
Dark - Lighted
- Irvine(Based on 10 reports) 10.0%
- Orange County(Based on 194 reports) 36.1%
- California(Based on 4,189 reports) 25.1%
Clear
- Irvine(Based on 10 reports) 90.0%
- Orange County(Based on 194 reports) 93.8%
- California(Based on 4,194 reports) 93.7%
Rain
- Irvine(Based on 10 reports) 10.0%
- Orange County(Based on 194 reports) 6.2%
- California(Based on 4,194 reports) 4.2%
| # | Date | Location | Vehicles | Drunk persons | Fatalites | Persons | Pedestrians |
|---|
| 1 | Mar 1, 1991 08:30 PM | I5 | 2 | - | 1
| 5 | - |
| 2 | Feb 18, 1991 01:30 AM | Irvine Bl | 2 | 1
| 2 | 6 | - |
| 3 | Mar 20, 1991 02:00 PM | Irvinecntr | 9 | - | 1
| 10 | - |
| 4 | Mar 21, 1991 03:10 PM | 133 | 1 | - | 1
| 1 | - |
| 5 | Jun 11, 1991 06:35 AM | Michelson | 1 | - | 1
| 2 | 1 |
| 6 | Jul 3, 1991 09:04 PM | Alton Pkwy | 2 | - | 1
| 2 | - |
| 7 | Aug 4, 1991 11:10 PM | I5 | 3 | - | 1
| 8 | - |
| 8 | Sep 17, 1991 07:35 PM | Walnut Ave | 1 | - | 1
| 2 | 1 |
| 9 | Nov 17, 1991 12:30 AM | Main St | 1 | - | 1
| 2 | - |
| 10 | Dec 28, 1991 02:25 AM | I5 | 1 | 1
| 1 | 1 | - |
Irvine fatal car crash and road traffic accident list for 1990
- Fatal accident count17
- Vehicles involved in fatal accidents25
- Fatal accidents involving drunk persons6
- Fatalities22
- Persons involved in fatal accidents50
Dark - Not Lighted
- Irvine(Based on 17 reports) 41.2%
- Orange County(Based on 230 reports) 17.4%
- California(Based on 4,679 reports) 26.6%
Daylight
- Irvine(Based on 17 reports) 35.3%
- Orange County(Based on 230 reports) 36.5%
- California(Based on 4,679 reports) 44.7%
Dark - Lighted
- Irvine(Based on 17 reports) 17.6%
- Orange County(Based on 230 reports) 40.4%
- California(Based on 4,679 reports) 25.0%
Dusk
- Irvine(Based on 17 reports) 5.9%
- Orange County(Based on 230 reports) 3.9%
- California(Based on 4,679 reports) 2.0%
Clear
- Irvine(Based on 17 reports) 94.1%
- Orange County(Based on 230 reports) 95.2%
- California(Based on 4,685 reports) 95.4%
Rain
- Irvine(Based on 17 reports) 5.9%
- Orange County(Based on 230 reports) 4.3%
- California(Based on 4,685 reports) 3.5%
| # | Date | Location | Vehicles | Drunk persons | Fatalites | Persons | Pedestrians |
|---|
| 1 | Jan 17, 1990 01:15 AM | I5 | 2 | - | 3
| 4 | - |
| 2 | Jan 21, 1990 12:08 AM | Michelson | 1 | - | 1
| 1 | - |
| 3 | Mar 21, 1990 07:44 PM | Walnut Ave | 2 | 1
| 1 | 4 | - |
| 4 | Apr 29, 1990 06:11 PM | Trabuco Rd | 2 | - | 1
| 4 | - |
| 5 | Apr 19, 1990 00:10 AM | I405 | 1 | 1
| 2 | 3 | - |
| 6 | May 6, 1990 05:45 AM | I405 | 1 | 1
| 1 | 2 | - |
| 7 | Jun 29, 1990 11:59 PM | Irvinecntr | 1 | 1
| 1 | 3 | - |
| 8 | Jul 21, 1990 11:50 PM | Campus Dr | 1 | 1
| 1 | 2 | - |
| 9 | Aug 16, 1990 10:50 AM | Irvinecntr | 1 | - | 1
| 1 | - |
| 10 | Aug 28, 1990 10:04 PM | Irvinecntr | 3 | 1
| 3 | 4 | - |
| 11 | Aug 23, 1990 01:27 AM | I405 | 1 | - | 1
| 2 | - |
| 12 | Sep 22, 1990 12:35 AM | Culver Dr | 1 | - | 1
| 2 | - |
| 13 | Oct 27, 1990 00:51 AM | Irvinecntr | 2 | - | 1
| 7 | - |
| 14 | Nov 4, 1990 10:10 PM | Stonecreek | 1 | - | 1
| 2 | - |
| 15 | Oct 17, 1990 06:05 PM | Culver Dr | 2 | - | 1
| 3 | - |
| 16 | Dec 5, 1990 05:45 AM | I405 | 2 | - | 1
| 5 | - |
| 17 | Dec 11, 1990 04:05 PM | Alton Pkwy | 1 | - | 1
| 1 | - |
Irvine fatal car crash and road traffic accident list for 1989
- Fatal accident count14
- Vehicles involved in fatal accidents25
- Fatal accidents involving drunk persons8
- Fatalities14
- Persons involved in fatal accidents37
Daylight
- Irvine(Based on 14 reports) 42.9%
- Orange County(Based on 273 reports) 39.9%
- California(Based on 4,869 reports) 43.8%
Dark - Lighted
- Irvine(Based on 14 reports) 42.9%
- Orange County(Based on 273 reports) 36.3%
- California(Based on 4,869 reports) 22.2%
Dark - Not Lighted
- Irvine(Based on 14 reports) 14.3%
- Orange County(Based on 273 reports) 19.8%
- California(Based on 4,869 reports) 29.5%
Clear
- Irvine(Based on 14 reports) 78.6%
- Orange County(Based on 273 reports) 94.1%
- California(Based on 4,877 reports) 94.5%
Fog, Smog, Smoke
- Irvine(Based on 14 reports) 14.3%
- Orange County(Based on 273 reports) 1.1%
- California(Based on 4,877 reports) 2.2%
Rain
- Irvine(Based on 14 reports) 7.1%
- Orange County(Based on 273 reports) 4.8%
- California(Based on 4,877 reports) 3.0%
| # | Date | Location | Vehicles | Drunk persons | Fatalites | Persons | Pedestrians |
|---|
| 1 | Feb 3, 1989 10:25 PM | Jamboreerd | 3 | 2
| 1 | 3 | - |
| 2 | Apr 29, 1989 05:37 PM | I5 | 2 | - | 1
| 2 | - |
| 3 | Apr 9, 1989 10:35 PM | Jeffrey Rd | 2 | 1
| 1 | 3 | - |
| 4 | May 23, 1989 09:51 PM | Macarthur | 2 | - | 1
| 3 | - |
| 5 | Sep 7, 1989 11:12 PM | Campus Drv | 2 | - | 1
| 2 | - |
| 6 | Aug 31, 1989 06:00 PM | University | 1 | - | 1
| 2 | - |
| 7 | Sep 22, 1989 06:15 PM | I405 | 1 | 1
| 1 | 3 | - |
| 8 | Jul 22, 1989 01:47 AM | Brancapkwy | 1 | 1
| 1 | 3 | - |
| 9 | Sep 12, 1989 11:00 PM | Culver Dr | 2 | 1
| 1 | 2 | - |
| 10 | Oct 17, 1989 08:06 AM | Culver Dr | 2 | - | 1
| 2 | - |
| 11 | Sep 24, 1989 06:35 AM | 73 | 2 | 1
| 1 | 2 | - |
| 12 | Nov 5, 1989 01:25 AM | I5 | 1 | 1
| 1 | 3 | - |
| 13 | Dec 14, 1989 12:53 AM | 73 | 2 | - | 1
| 3 | - |
| 14 | Dec 24, 1989 01:00 AM | I5 | 2 | - | 1
| 4 | - |
Irvine fatal car crash and road traffic accident list for 1988
- Fatal accident count14
- Vehicles involved in fatal accidents26
- Fatal accidents involving drunk persons7
- Fatalities15
- Persons involved in fatal accidents42
Daylight
- Irvine(Based on 14 reports) 42.9%
- Orange County(Based on 266 reports) 35.3%
- California(Based on 4,868 reports) 43.7%
Dark - Not Lighted
- Irvine(Based on 14 reports) 35.7%
- Orange County(Based on 266 reports) 22.2%
- California(Based on 4,868 reports) 28.0%
Dark - Lighted
- Irvine(Based on 14 reports) 21.4%
- Orange County(Based on 266 reports) 38.0%
- California(Based on 4,868 reports) 24.1%
Clear
- Irvine(Based on 14 reports) 85.7%
- Orange County(Based on 266 reports) 96.6%
- California(Based on 4,875 reports) 94.0%
Rain
- Irvine(Based on 14 reports) 14.3%
- Orange County(Based on 266 reports) 2.6%
- California(Based on 4,875 reports) 4.2%
| # | Date | Location | Vehicles | Drunk persons | Fatalites | Persons | Pedestrians |
|---|
| 1 | Feb 5, 1988 05:45 AM | I5 | 4 | - | 1
| 5 | - |
| 2 | Jan 11, 1988 06:50 AM | I5 | 3 | - | 1
| 3 | - |
| 3 | Jan 31, 1988 07:54 AM | I5 | 1 | 1
| 1 | 1 | - |
| 4 | Mar 14, 1988 05:15 AM | Macarthur | 1 | - | 1
| 2 | - |
| 5 | Apr 25, 1988 05:02 PM | Bonitacyn | 1 | - | 1
| 2 | - |
| 6 | May 29, 1988 04:05 AM | Irvincentr | 1 | 1
| 1 | 1 | - |
| 7 | Jun 30, 1988 09:41 PM | I405 | 1 | 1
| 1 | 2 | - |
| 8 | Jul 25, 1988 05:15 PM | Michelson | 1 | - | 1
| 2 | - |
| 9 | Sep 20, 1988 07:35 AM | Michelson | 2 | - | 1
| 8 | - |
| 10 | Sep 21, 1988 03:55 AM | I405 | 1 | - | 1
| 1 | - |
| 11 | Oct 8, 1988 00:40 AM | Red Hillav | 2 | 2
| 2 | 3 | - |
| 12 | Oct 18, 1988 09:32 PM | Laguna Cyn | 1 | 1
| 1 | 2 | - |
| 13 | Nov 23, 1988 12:30 AM | I5 | 6 | - | 1
| 8 | - |
| 14 | Dec 15, 1988 06:46 PM | Culver Dr | 1 | 1
| 1 | 2 | - |
Irvine fatal car crash and road traffic accident list for 1987
- Fatal accident count13
- Vehicles involved in fatal accidents18
- Fatal accidents involving drunk persons8
- Fatalities14
- Persons involved in fatal accidents30
Daylight
- Irvine(Based on 13 reports) 46.2%
- Orange County(Based on 279 reports) 37.6%
- California(Based on 4,923 reports) 43.9%
Dark - Not Lighted
- Irvine(Based on 13 reports) 30.8%
- Orange County(Based on 279 reports) 20.4%
- California(Based on 4,923 reports) 28.9%
Dark - Lighted
- Irvine(Based on 13 reports) 23.1%
- Orange County(Based on 279 reports) 38.0%
- California(Based on 4,923 reports) 23.5%
Clear
- Irvine(Based on 13 reports) 100.0%
- Orange County(Based on 280 reports) 92.9%
- California(Based on 4,935 reports) 93.0%
| # | Date | Location | Vehicles | Drunk persons | Fatalites | Persons | Pedestrians |
|---|
| 1 | Jan 23, 1987 01:00 AM | 405 | 1 | 1
| 1 | 2 | - |
| 2 | Feb 6, 1987 10:45 PM | Trabuco Rd | 1 | 1
| 2 | 3 | - |
| 3 | Feb 11, 1987 11:10 PM | 5 | 1 | 1
| 1 | 1 | - |
| 4 | Jan 29, 1987 00:46 AM | Brancapkwy | 2 | - | 1
| 2 | - |
| 5 | May 18, 1987 12:20 AM | Trabuco Rd | 2 | 1
| 1 | 3 | - |
| 6 | Jun 10, 1987 10:05 PM | 405 | 2 | 1
| 1 | 2 | - |
| 7 | Jun 18, 1987 04:25 PM | Jeffrey Rd | 1 | - | 1
| 1 | - |
| 8 | Jul 24, 1987 06:30 PM | Royce Road | 1 | - | 1
| 1 | - |
| 9 | Aug 18, 1987 08:30 PM | Harvard Av | 2 | - | 1
| 4 | - |
| 10 | Aug 27, 1987 12:02 AM | Jamboreerd | 1 | - | 1
| 2 | - |
| 11 | Sep 26, 1987 03:00 AM | Jeffrey Rd | 1 | 1
| 1 | 4 | - |
| 12 | Nov 1, 1987 01:25 AM | Barancapwy | 2 | 2
| 1 | 3 | - |
| 13 | Dec 9, 1987 12:30 AM | Mainstreet | 1 | - | 1
| 2 | - |
Irvine fatal car crash and road traffic accident list for 1986
- Fatal accident count11
- Vehicles involved in fatal accidents19
- Fatal accidents involving drunk persons6
- Fatalities13
- Persons involved in fatal accidents30
Daylight
- Irvine(Based on 11 reports) 54.5%
- Orange County(Based on 275 reports) 37.8%
- California(Based on 4,674 reports) 44.7%
Dark - Not Lighted
- Irvine(Based on 11 reports) 27.3%
- Orange County(Based on 275 reports) 17.1%
- California(Based on 4,674 reports) 27.9%
Dark - Lighted
- Irvine(Based on 11 reports) 18.2%
- Orange County(Based on 275 reports) 41.8%
- California(Based on 4,674 reports) 23.4%
Clear
- Irvine(Based on 11 reports) 100.0%
- Orange County(Based on 275 reports) 93.1%
- California(Based on 4,683 reports) 93.3%
| # | Date | Location | Vehicles | Drunk persons | Fatalites | Persons | Pedestrians |
|---|
| 1 | Feb 8, 1986 10:45 AM | Barrancard | 1 | - | 1
| 1 | - |
| 2 | Feb 24, 1986 05:30 PM | Westwood | 1 | - | 1
| 2 | - |
| 3 | Mar 121986 01:23 PM | | 2 | 1
| 1 | 2 | - |
| 4 | Apr 11986 01:15 AM | | 2 | 1
| 1 | 3 | - |
| 5 | May 2, 1986 01:18 PM | Culver Dr | 2 | - | 1
| 3 | - |
| 6 | May 31986 00:50 AM | | 3 | 2
| 2 | 4 | - |
| 7 | Jun 281986 02:55 AM | | 2 | 1
| 1 | 3 | - |
| 8 | Jul 25, 1986 11:51 AM | Yale Ave | 1 | - | 1
| 5 | - |
| 9 | Jul 241986 11:30 PM | | 2 | - | 2
| 3 | - |
| 10 | Oct 21986 11:35 PM | | 1 | 1
| 1 | 1 | - |
| 11 | Dec 27, 1986 07:30 AM | Irvinecntr | 2 | - | 1
| 3 | - |
Irvine fatal car crash and road traffic accident list for 1985
- Fatal accident count14
- Vehicles involved in fatal accidents22
- Fatal accidents involving drunk persons6
- Fatalities14
- Persons involved in fatal accidents35
Dark - Lighted
- Irvine(Based on 14 reports) 35.7%
- Orange County(Based on 282 reports) 38.7%
- California(Based on 4,436 reports) 24.5%
Dark - Not Lighted
- Irvine(Based on 14 reports) 35.7%
- Orange County(Based on 282 reports) 21.6%
- California(Based on 4,436 reports) 26.8%
Daylight
- Irvine(Based on 14 reports) 28.6%
- Orange County(Based on 282 reports) 36.2%
- California(Based on 4,436 reports) 44.6%
Clear
- Irvine(Based on 14 reports) 100.0%
- Orange County(Based on 282 reports) 95.4%
- California(Based on 4,447 reports) 92.9%
| # | Date | Location | Vehicles | Drunk persons | Fatalites | Persons | Pedestrians |
|---|
| 1 | Jan 25, 1985 03:50 PM | Irvnecntdr | 2 | 2
| 1 | 2 | - |
| 2 | Jan 30, 1985 05:45 AM | Harvardave | 1 | - | 1
| 2 | - |
| 3 | Mar 8, 1985 00:01 AM | Macarthur | 2 | - | 1
| 4 | - |
| 4 | Apr 4, 1985 08:45 PM | Culver Dr | 2 | - | 1
| 3 | - |
| 5 | Mar 15, 1985 07:30 AM | Irvinecntr | 2 | - | 1
| 3 | - |
| 6 | May 11985 09:40 PM | | 2 | 1
| 1 | 2 | - |
| 7 | Aug 11985 01:20 AM | | 1 | - | 1
| 1 | - |
| 8 | Aug 3, 1985 09:05 PM | University | 1 | 1
| 1 | 2 | - |
| 9 | Aug 22, 1985 03:58 PM | Eyaleloop | 2 | - | 1
| 3 | - |
| 10 | Jul 4, 1985 08:50 PM | Trabuco Rd | 2 | - | 1
| 4 | - |
| 11 | Sep 25, 1985 01:50 AM | Harvardave | 2 | 1
| 1 | 3 | - |
| 12 | Oct 191985 11:10 AM | | 1 | - | 1
| 2 | - |
| 13 | Nov 151985 10:36 PM | | 1 | 1
| 1 | 3 | - |
| 14 | Sep 21985 04:10 AM | | 1 | - | 1
| 1 | - |
Irvine fatal car crash and road traffic accident list for 1984
- Fatal accident count14
- Vehicles involved in fatal accidents26
- Fatal accidents involving drunk persons7
- Fatalities16
- Persons involved in fatal accidents37
Daylight
- Irvine(Based on 14 reports) 57.1%
- Orange County(Based on 248 reports) 39.5%
- California(Based on 4,504 reports) 43.0%
Dark - Not Lighted
- Irvine(Based on 14 reports) 21.4%
- Orange County(Based on 248 reports) 19.8%
- California(Based on 4,504 reports) 29.5%
Dark - Lighted
- Irvine(Based on 14 reports) 14.3%
- Orange County(Based on 248 reports) 37.5%
- California(Based on 4,504 reports) 24.2%
Dawn
- Irvine(Based on 14 reports) 7.1%
- Orange County(Based on 248 reports) 0.8%
- California(Based on 4,504 reports) 1.1%
Clear
- Irvine(Based on 14 reports) 92.9%
- Orange County(Based on 249 reports) 96.4%
- California(Based on 4,517 reports) 93.9%
Fog, Smog, Smoke
- Irvine(Based on 14 reports) 7.1%
- Orange County(Based on 249 reports) 0.8%
- California(Based on 4,517 reports) 1.3%
| # | Date | Location | Vehicles | Drunk persons | Fatalites | Persons | Pedestrians |
|---|
| 1 | Jan 271984 04:35 PM | | 3 | - | 1
| 4 | - |
| 2 | Feb 7, 1984 11:40 AM | Culver Dr | 2 | 1
| 1 | 2 | - |
| 3 | Apr 81984 07:45 PM | | 1 | 1
| 1 | 1 | - |
| 4 | Apr 16, 1984 07:45 PM | Alton Pkwy | 1 | 1
| 1 | 3 | - |
| 5 | Apr 281984 04:50 AM | | 2 | 1
| 2 | 3 | - |
| 6 | Jun 211984 01:50 AM | | 3 | - | 1
| 3 | - |
| 7 | Jun 271984 05:20 PM | | 1 | - | 1
| 1 | - |
| 8 | Jul 31, 1984 01:55 PM | Jamboreebl | 3 | - | 1
| 4 | - |
| 9 | Aug 12, 1984 06:25 PM | Univertydr | 2 | 1
| 1 | 3 | - |
| 10 | Aug 261984 11:10 PM | | 1 | 1
| 2 | 2 | - |
| 11 | Sep 7, 1984 01:25 PM | Campus | 2 | - | 1
| 2 | - |
| 12 | Sep 20, 1984 03:11 PM | Irvinecntr | 1 | - | 1
| 3 | - |
| 13 | Nov 21984 05:00 AM | | 3 | - | 1
| 3 | - |
| 14 | Nov 291984 12:37 AM | | 1 | 1
| 1 | 3 | - |
Irvine fatal car crash and road traffic accident list for 1983
- Fatal accident count11
- Vehicles involved in fatal accidents20
- Fatal accidents involving drunk persons7
- Fatalities13
- Persons involved in fatal accidents36
Daylight
- Irvine(Based on 11 reports) 45.5%
- Orange County(Based on 230 reports) 33.0%
- California(Based on 4,082 reports) 42.4%
Dark - Lighted
- Irvine(Based on 11 reports) 36.4%
- Orange County(Based on 230 reports) 47.8%
- California(Based on 4,082 reports) 23.9%
Dark - Not Lighted
- Irvine(Based on 11 reports) 18.2%
- Orange County(Based on 230 reports) 14.8%
- California(Based on 4,082 reports) 29.8%
Clear
- Irvine(Based on 11 reports) 90.9%
- Orange County(Based on 231 reports) 94.4%
- California(Based on 4,089 reports) 89.6%
Rain
- Irvine(Based on 11 reports) 9.1%
- Orange County(Based on 231 reports) 5.6%
- California(Based on 4,089 reports) 8.5%
| # | Date | Location | Vehicles | Drunk persons | Fatalites | Persons | Pedestrians |
|---|
| 1 | Jan 281983 01:20 AM | | 1 | 1
| 2 | 5 | - |
| 2 | Feb 9, 1983 01:15 AM | Lgnacnynrd | 1 | 1
| 1 | 1 | - |
| 3 | Apr 18, 1983 10:40 PM | Trtlerckdr | 1 | 1
| 1 | 1 | - |
| 4 | May 121983 01:10 PM | | 5 | 1
| 1 | 7 | - |
| 5 | Jun 51983 04:50 AM | | 1 | 1
| 1 | 2 | - |
| 6 | Jul 9, 1983 12:28 AM | Harvard | 1 | 1
| 1 | 3 | - |
| 7 | Jul 11, 1983 03:56 AM | Jamboree | 1 | - | 1
| 1 | - |
| 8 | Sep 121983 03:35 PM | | 3 | - | 1
| 5 | - |
| 9 | Oct 3, 1983 05:15 PM | Bonitacyn | 2 | 1
| 2 | 2 | - |
| 10 | Oct 1, 1983 02:30 AM | Trabucord | 1 | - | 1
| 3 | - |
| 11 | Nov 30, 1983 02:21 PM | Culver | 3 | - | 1
| 6 | - |
Irvine fatal car crash and road traffic accident list for 1982
- Fatal accident count8
- Vehicles involved in fatal accidents12
- Fatal accidents involving drunk persons6
- Fatalities9
- Persons involved in fatal accidents22
Daylight
- Irvine(Based on 8 reports) 37.5%
- Orange County(Based on 231 reports) 42.4%
- California(Based on 4,116 reports) 39.7%
Dark - Not Lighted
- Irvine(Based on 8 reports) 37.5%
- Orange County(Based on 231 reports) 15.6%
- California(Based on 4,116 reports) 29.9%
Dark - Lighted
- Irvine(Based on 8 reports) 25.0%
- Orange County(Based on 231 reports) 38.5%
- California(Based on 4,116 reports) 27.0%
Clear
- Irvine(Based on 8 reports) 100.0%
- Orange County(Based on 231 reports) 94.8%
- California(Based on 4,119 reports) 90.8%
| # | Date | Location | Vehicles | Drunk persons | Fatalites | Persons | Pedestrians |
|---|
| 1 | Feb 151982 02:15 PM | | 3 | - | 1
| 7 | - |
| 2 | Feb 27, 1982 07:00 PM | Irvinecntr | 1 | 1
| 1 | 2 | - |
| 3 | Mar 271982 03:05 AM | | 1 | 1
| 1 | 1 | - |
| 4 | Aug 231982 03:00 PM | | 1 | 1
| 1 | 1 | - |
| 5 | Sep 9, 1982 10:57 AM | Walnut | 1 | - | 1
| 1 | - |
| 6 | Sep 121982 02:00 AM | | 1 | 1
| 1 | 2 | - |
| 7 | Nov 26, 1982 08:25 PM | Jefferyrd | 3 | 1
| 2 | 6 | - |
| 8 | Dec 81982 11:40 PM | | 1 | 1
| 1 | 2 | - |
Irvine fatal car crash and road traffic accident list for 1981
- Fatal accident count12
- Vehicles involved in fatal accidents18
- Fatal accidents involving drunk persons6
- Fatalities13
- Persons involved in fatal accidents30
Daylight
- Irvine(Based on 12 reports) 41.7%
- Orange County(Based on 262 reports) 38.9%
- California(Based on 4,670 reports) 39.8%
Dark - Lighted
- Irvine(Based on 12 reports) 33.3%
- Orange County(Based on 262 reports) 42.4%
- California(Based on 4,670 reports) 26.4%
Dark - Not Lighted
- Irvine(Based on 12 reports) 16.7%
- Orange County(Based on 262 reports) 16.4%
- California(Based on 4,670 reports) 30.3%
Dusk
- Irvine(Based on 12 reports) 8.3%
- Orange County(Based on 262 reports) 1.1%
- California(Based on 4,670 reports) 2.4%
Clear
- Irvine(Based on 12 reports) 83.3%
- Orange County(Based on 262 reports) 93.5%
- California(Based on 4,670 reports) 93.0%
Rain
- Irvine(Based on 12 reports) 8.3%
- Orange County(Based on 262 reports) 3.8%
- California(Based on 4,670 reports) 4.8%
Fog, Smog, Smoke
- Irvine(Based on 12 reports) 8.3%
- Orange County(Based on 262 reports) 2.3%
- California(Based on 4,670 reports) 1.7%
Irvine fatal car crash and road traffic accident list for 1980
- Fatal accident count12
- Vehicles involved in fatal accidents14
- Fatal accidents involving drunk persons6
- Fatalities13
- Persons involved in fatal accidents30
Daylight
- Irvine(Based on 12 reports) 33.3%
- Orange County(Based on 270 reports) 34.1%
- California(Based on 4,928 reports) 39.5%
Dark - Not Lighted
- Irvine(Based on 12 reports) 33.3%
- Orange County(Based on 270 reports) 20.4%
- California(Based on 4,928 reports) 31.3%
Dark - Lighted
- Irvine(Based on 12 reports) 25.0%
- Orange County(Based on 270 reports) 42.6%
- California(Based on 4,928 reports) 25.8%
Dusk
- Irvine(Based on 12 reports) 8.3%
- Orange County(Based on 270 reports) 3.0%
- California(Based on 4,928 reports) 2.5%
Clear
- Irvine(Based on 12 reports) 91.7%
- Orange County(Based on 270 reports) 95.2%
- California(Based on 4,930 reports) 93.0%
Rain
- Irvine(Based on 12 reports) 8.3%
- Orange County(Based on 270 reports) 3.7%
- California(Based on 4,930 reports) 4.8%
Irvine fatal car crash and road traffic accident list for 1979
- Fatal accident count14
- Vehicles involved in fatal accidents22
- Fatal accidents involving drunk persons9
- Fatalities16
- Persons involved in fatal accidents35
Daylight
- Irvine(Based on 14 reports) 42.9%
- Orange County(Based on 271 reports) 43.2%
- California(Based on 4,970 reports) 41.5%
Dark - Not Lighted
- Irvine(Based on 14 reports) 28.6%
- Orange County(Based on 271 reports) 17.3%
- California(Based on 4,970 reports) 29.4%
Dark - Lighted
- Irvine(Based on 14 reports) 21.4%
- Orange County(Based on 271 reports) 37.6%
- California(Based on 4,970 reports) 25.7%
Dark - Unknown Lighting
- Irvine(Based on 14 reports) 7.1%
- Orange County(Based on 271 reports) 1.8%
- California(Based on 4,970 reports) 3.5%
Clear
- Irvine(Based on 14 reports) 100.0%
- Orange County(Based on 271 reports) 94.1%
- California(Based on 4,975 reports) 92.9%
Irvine fatal car crash and road traffic accident list for 1978
- Fatal accident count7
- Vehicles involved in fatal accidents11
- Fatal accidents involving drunk persons2
- Fatalities7
- Persons involved in fatal accidents17
Dark - Not Lighted
- Irvine(Based on 7 reports) 57.1%
- Orange County(Based on 259 reports) 21.2%
- California(Based on 4,722 reports) 30.1%
Dark - Lighted
- Irvine(Based on 7 reports) 28.6%
- Orange County(Based on 259 reports) 40.2%
- California(Based on 4,722 reports) 23.9%
Daylight
- Irvine(Based on 7 reports) 14.3%
- Orange County(Based on 259 reports) 35.5%
- California(Based on 4,722 reports) 42.5%
Clear
- Irvine(Based on 7 reports) 100.0%
- Orange County(Based on 259 reports) 93.4%
- California(Based on 4,724 reports) 90.7%
Irvine fatal car crash and road traffic accident list for 1977
- Fatal accident count7
- Vehicles involved in fatal accidents11
- Fatal accidents involving drunk persons3
- Fatalities9
- Persons involved in fatal accidents18
Dark - Not Lighted
- Irvine(Based on 7 reports) 42.9%
- Orange County(Based on 251 reports) 18.7%
- California(Based on 4,347 reports) 32.9%
Dark - Lighted
- Irvine(Based on 7 reports) 28.6%
- Orange County(Based on 251 reports) 44.2%
- California(Based on 4,347 reports) 23.7%
Daylight
- Irvine(Based on 7 reports) 14.3%
- Orange County(Based on 251 reports) 34.7%
- California(Based on 4,347 reports) 40.0%
Dark - Unknown Lighting
- Irvine(Based on 7 reports) 14.3%
- Orange County(Based on 251 reports) 2.4%
- California(Based on 4,347 reports) 3.4%
Clear
- Irvine(Based on 7 reports) 100.0%
- Orange County(Based on 251 reports) 93.2%
- California(Based on 4,351 reports) 93.2%
Irvine fatal car crash and road traffic accident list for 1976
- Fatal accident count12
- Vehicles involved in fatal accidents18
- Fatal accidents involving drunk persons5
- Fatalities13
- Persons involved in fatal accidents41
Dark - Lighted
- Irvine(Based on 12 reports) 66.7%
- Orange County(Based on 194 reports) 41.8%
- California(Based on 3,663 reports) 24.5%
Daylight
- Irvine(Based on 12 reports) 16.7%
- Orange County(Based on 194 reports) 33.5%
- California(Based on 3,663 reports) 42.8%
Dark - Not Lighted
- Irvine(Based on 12 reports) 16.7%
- Orange County(Based on 194 reports) 20.1%
- California(Based on 3,663 reports) 29.3%
Clear
- Irvine(Based on 12 reports) 91.7%
- Orange County(Based on 194 reports) 93.3%
- California(Based on 3,667 reports) 91.8%
Rain
- Irvine(Based on 12 reports) 8.3%
- Orange County(Based on 194 reports) 3.6%
- California(Based on 3,667 reports) 4.8%
Irvine fatal car crash and road traffic accident list for 1975
- Fatal accident count12
- Vehicles involved in fatal accidents18
- Fatal accidents involving drunk persons5
- Fatalities13
- Persons involved in fatal accidents41
Dark - Lighted
- Irvine(Based on 12 reports) 66.7%
- Orange County(Based on 194 reports) 41.8%
- California(Based on 3,663 reports) 24.5%
Daylight
- Irvine(Based on 12 reports) 16.7%
- Orange County(Based on 194 reports) 33.5%
- California(Based on 3,663 reports) 42.8%
Dark - Not Lighted
- Irvine(Based on 12 reports) 16.7%
- Orange County(Based on 194 reports) 20.1%
- California(Based on 3,663 reports) 29.3%
Clear
- Irvine(Based on 12 reports) 91.7%
- Orange County(Based on 194 reports) 93.3%
- California(Based on 3,667 reports) 91.8%
Rain
- Irvine(Based on 12 reports) 8.3%
- Orange County(Based on 194 reports) 3.6%
- California(Based on 3,667 reports) 4.8%