Estimated zip code population in 2022: 11,599
Zip code population in 2010: 11,099
Zip code population in 2000: 9,250
Houses and condos: 4,834
Renter-occupied apartments: 717
% of renters here:
16%State:
36%
March 2022 cost of living index in zip code 98580: 97.8
(near average, U.S. average is 100)
Land area: 140.8
sq. mi.
Water area: 2.0
sq. mi.
Population density: 82 people per square mile (very low).
OSM Map
General Map
Google Map
MSN Map
OSM Map
General Map
Google Map
MSN Map
OSM Map
General Map
Google Map
MSN Map
OSM Map
General Map
Google Map
MSN Map
Please wait while loading the map...
Real estate property taxes paid for housing units in 2022:
This zip code:
0.7% ($4,071)Washington:
0.8% ($4,283)
Median real estate property taxes paid for housing units with mortgages in 2022: $4,094 (0.7%)
Median real estate property taxes paid for housing units with no mortgage in 2022: $3,995 (0.8%)
Profiles of local businesses
Business Search - 14 Million verified businesses
Males: 5,979 Females: 5,620
For population 25 years and over in 98580:
High school or higher: 92.2%Bachelor's degree or higher: 24.9%Graduate or professional degree: 8.4%Unemployed: 6.0%Mean travel time to work (commute): 42.0 minutes
For population 15 years and over in 98580:
Never married: 22.9%Now married: 60.9%Separated: 1.3%Widowed: 4.0%Divorced: 10.8%
Zip code 98580 compared to state average:
Hispanic race population percentage below state average. Median age significantly above state average. Foreign-born population percentage significantly below state average. Renting percentage significantly below state average. Length of stay since moving in significantly above state average. House age below state average. Percentage of population with a bachelor's degree or higher below state average. 9,142 78.8% White 905 7.8% Hispanic or Latino 815 7.0% Two or more races 298 2.6% Black 267 2.3% Some other race 107 0.9% Asian 63 0.5% American Indian
Data:
Median household income ($)
Median household income (% change since 2000)
Household income diversity
Ratio of average income to average house value (%)
Ratio of average income to average rent
Median household income ($) - White
Median household income ($) - Black or African American
Median household income ($) - Asian
Median household income ($) - Hispanic or Latino
Median household income ($) - American Indian and Alaska Native
Median household income ($) - Multirace
Median household income ($) - Other Race
Median household income for houses/condos with a mortgage ($)
Median household income for apartments without a mortgage ($)
Races - White alone (%)
Races - White alone (% change since 2000)
Races - Black alone (%)
Races - Black alone (% change since 2000)
Races - American Indian alone (%)
Races - American Indian alone (% change since 2000)
Races - Asian alone (%)
Races - Asian alone (% change since 2000)
Races - Hispanic (%)
Races - Hispanic (% change since 2000)
Races - Native Hawaiian and Other Pacific Islander alone (%)
Races - Native Hawaiian and Other Pacific Islander alone (% change since 2000)
Races - Two or more races (%)
Races - Two or more races (% change since 2000)
Races - Other race alone (%)
Races - Other race alone (% change since 2000)
Racial diversity
Unemployment (%)
Unemployment (% change since 2000)
Unemployment (%) - White
Unemployment (%) - Black or African American
Unemployment (%) - Asian
Unemployment (%) - Hispanic or Latino
Unemployment (%) - American Indian and Alaska Native
Unemployment (%) - Multirace
Unemployment (%) - Other Race
Population density (people per square mile)
Population - Males (%)
Population - Females (%)
Population - Males (%) - White
Population - Males (%) - Black or African American
Population - Males (%) - Asian
Population - Males (%) - Hispanic or Latino
Population - Males (%) - American Indian and Alaska Native
Population - Males (%) - Multirace
Population - Males (%) - Other Race
Population - Females (%) - White
Population - Females (%) - Black or African American
Population - Females (%) - Asian
Population - Females (%) - Hispanic or Latino
Population - Females (%) - American Indian and Alaska Native
Population - Females (%) - Multirace
Population - Females (%) - Other Race
Coronavirus confirmed cases (May 31, 2024)
Deaths caused by coronavirus (May 31, 2024)
Coronavirus confirmed cases (per 100k population) (May 31, 2024)
Deaths caused by coronavirus (per 100k population) (May 31, 2024)
Daily increase in number of cases (May 31, 2024)
Weekly increase in number of cases (May 31, 2024)
Cases doubled (in days) (May 31, 2024)
Hospitalized patients (Apr 18, 2022)
Negative test results (Apr 18, 2022)
Total test results (Apr 18, 2022)
COVID Vaccine doses distributed (per 100k population) (Sep 19, 2023)
COVID Vaccine doses administered (per 100k population) (Sep 19, 2023)
COVID Vaccine doses distributed (Sep 19, 2023)
COVID Vaccine doses administered (Sep 19, 2023)
Likely homosexual households (%)
Likely homosexual households (% change since 2000)
Likely homosexual households - Lesbian couples (%)
Likely homosexual households - Lesbian couples (% change since 2000)
Likely homosexual households - Gay men (%)
Likely homosexual households - Gay men (% change since 2000)
Cost of living index
Median gross rent ($)
Median contract rent ($)
Median monthly housing costs ($)
Median house or condo value ($)
Median house or condo value ($ change since 2000)
Mean house or condo value by units in structure - 1, detached ($)
Mean house or condo value by units in structure - 1, attached ($)
Mean house or condo value by units in structure - 2 ($)
Mean house or condo value by units in structure by units in structure - 3 or 4 ($)
Mean house or condo value by units in structure - 5 or more ($)
Mean house or condo value by units in structure - Boat, RV, van, etc. ($)
Mean house or condo value by units in structure - Mobile home ($)
Median house or condo value ($) - White
Median house or condo value ($) - Black or African American
Median house or condo value ($) - Asian
Median house or condo value ($) - Hispanic or Latino
Median house or condo value ($) - American Indian and Alaska Native
Median house or condo value ($) - Multirace
Median house or condo value ($) - Other Race
Median resident age
Resident age diversity
Median resident age - Males
Median resident age - Females
Median resident age - White
Median resident age - Black or African American
Median resident age - Asian
Median resident age - Hispanic or Latino
Median resident age - American Indian and Alaska Native
Median resident age - Multirace
Median resident age - Other Race
Median resident age - Males - White
Median resident age - Males - Black or African American
Median resident age - Males - Asian
Median resident age - Males - Hispanic or Latino
Median resident age - Males - American Indian and Alaska Native
Median resident age - Males - Multirace
Median resident age - Males - Other Race
Median resident age - Females - White
Median resident age - Females - Black or African American
Median resident age - Females - Asian
Median resident age - Females - Hispanic or Latino
Median resident age - Females - American Indian and Alaska Native
Median resident age - Females - Multirace
Median resident age - Females - Other Race
Commute - mean travel time to work (minutes)
Travel time to work - Less than 5 minutes (%)
Travel time to work - Less than 5 minutes (% change since 2000)
Travel time to work - 5 to 9 minutes (%)
Travel time to work - 5 to 9 minutes (% change since 2000)
Travel time to work - 10 to 19 minutes (%)
Travel time to work - 10 to 19 minutes (% change since 2000)
Travel time to work - 20 to 29 minutes (%)
Travel time to work - 20 to 29 minutes (% change since 2000)
Travel time to work - 30 to 39 minutes (%)
Travel time to work - 30 to 39 minutes (% change since 2000)
Travel time to work - 40 to 59 minutes (%)
Travel time to work - 40 to 59 minutes (% change since 2000)
Travel time to work - 60 to 89 minutes (%)
Travel time to work - 60 to 89 minutes (% change since 2000)
Travel time to work - 90 or more minutes (%)
Travel time to work - 90 or more minutes (% change since 2000)
Marital status - Never married (%)
Marital status - Now married (%)
Marital status - Separated (%)
Marital status - Widowed (%)
Marital status - Divorced (%)
Median family income ($)
Median family income (% change since 2000)
Median non-family income ($)
Median non-family income (% change since 2000)
Median per capita income ($)
Median per capita income (% change since 2000)
Median family income ($) - White
Median family income ($) - Black or African American
Median family income ($) - Asian
Median family income ($) - Hispanic or Latino
Median family income ($) - American Indian and Alaska Native
Median family income ($) - Multirace
Median family income ($) - Other Race
Median year house/condo built
Median year apartment built
Year house built - Built 2005 or later (%)
Year house built - Built 2000 to 2004 (%)
Year house built - Built 1990 to 1999 (%)
Year house built - Built 1980 to 1989 (%)
Year house built - Built 1970 to 1979 (%)
Year house built - Built 1960 to 1969 (%)
Year house built - Built 1950 to 1959 (%)
Year house built - Built 1940 to 1949 (%)
Year house built - Built 1939 or earlier (%)
Average household size
Household density (households per square mile)
Average household size - White
Average household size - Black or African American
Average household size - Asian
Average household size - Hispanic or Latino
Average household size - American Indian and Alaska Native
Average household size - Multirace
Average household size - Other Race
Occupied housing units (%)
Vacant housing units (%)
Owner occupied housing units (%)
Renter occupied housing units (%)
Vacancy status - For rent (%)
Vacancy status - For sale only (%)
Vacancy status - Rented or sold, not occupied (%)
Vacancy status - For seasonal, recreational, or occasional use (%)
Vacancy status - For migrant workers (%)
Vacancy status - Other vacant (%)
Residents with income below the poverty level (%)
Residents with income below 50% of the poverty level (%)
Children below poverty level (%)
Poor families by family type - Married-couple family (%)
Poor families by family type - Male, no wife present (%)
Poor families by family type - Female, no husband present (%)
Poverty status for native-born residents (%)
Poverty status for foreign-born residents (%)
Poverty among high school graduates not in families (%)
Poverty among people who did not graduate high school not in families (%)
Residents with income below the poverty level (%) - White
Residents with income below the poverty level (%) - Black or African American
Residents with income below the poverty level (%) - Asian
Residents with income below the poverty level (%) - Hispanic or Latino
Residents with income below the poverty level (%) - American Indian and Alaska Native
Residents with income below the poverty level (%) - Multirace
Residents with income below the poverty level (%) - Other Race
Air pollution - Air Quality Index (AQI)
Air pollution - CO
Air pollution - NO2
Air pollution - SO2
Air pollution - Ozone
Air pollution - PM10
Air pollution - PM25
Air pollution - Pb
Crime - Murders per 100,000 population
Crime - Rapes per 100,000 population
Crime - Robberies per 100,000 population
Crime - Assaults per 100,000 population
Crime - Burglaries per 100,000 population
Crime - Thefts per 100,000 population
Crime - Auto thefts per 100,000 population
Crime - Arson per 100,000 population
Crime - City-data.com crime index
Crime - Violent crime index
Crime - Property crime index
Crime - Murders per 100,000 population (5 year average)
Crime - Rapes per 100,000 population (5 year average)
Crime - Robberies per 100,000 population (5 year average)
Crime - Assaults per 100,000 population (5 year average)
Crime - Burglaries per 100,000 population (5 year average)
Crime - Thefts per 100,000 population (5 year average)
Crime - Auto thefts per 100,000 population (5 year average)
Crime - Arson per 100,000 population (5 year average)
Crime - City-data.com crime index (5 year average)
Crime - Violent crime index (5 year average)
Crime - Property crime index (5 year average)
1996 Presidential Elections Results (%) - Democratic Party (Clinton)
1996 Presidential Elections Results (%) - Republican Party (Dole)
1996 Presidential Elections Results (%) - Other
2000 Presidential Elections Results (%) - Democratic Party (Gore)
2000 Presidential Elections Results (%) - Republican Party (Bush)
2000 Presidential Elections Results (%) - Other
2004 Presidential Elections Results (%) - Democratic Party (Kerry)
2004 Presidential Elections Results (%) - Republican Party (Bush)
2004 Presidential Elections Results (%) - Other
2008 Presidential Elections Results (%) - Democratic Party (Obama)
2008 Presidential Elections Results (%) - Republican Party (McCain)
2008 Presidential Elections Results (%) - Other
2012 Presidential Elections Results (%) - Democratic Party (Obama)
2012 Presidential Elections Results (%) - Republican Party (Romney)
2012 Presidential Elections Results (%) - Other
2016 Presidential Elections Results (%) - Democratic Party (Clinton)
2016 Presidential Elections Results (%) - Republican Party (Trump)
2016 Presidential Elections Results (%) - Other
2020 Presidential Elections Results (%) - Democratic Party (Biden)
2020 Presidential Elections Results (%) - Republican Party (Trump)
2020 Presidential Elections Results (%) - Other
Ancestries Reported - Arab (%)
Ancestries Reported - Czech (%)
Ancestries Reported - Danish (%)
Ancestries Reported - Dutch (%)
Ancestries Reported - English (%)
Ancestries Reported - French (%)
Ancestries Reported - French Canadian (%)
Ancestries Reported - German (%)
Ancestries Reported - Greek (%)
Ancestries Reported - Hungarian (%)
Ancestries Reported - Irish (%)
Ancestries Reported - Italian (%)
Ancestries Reported - Lithuanian (%)
Ancestries Reported - Norwegian (%)
Ancestries Reported - Polish (%)
Ancestries Reported - Portuguese (%)
Ancestries Reported - Russian (%)
Ancestries Reported - Scotch-Irish (%)
Ancestries Reported - Scottish (%)
Ancestries Reported - Slovak (%)
Ancestries Reported - Subsaharan African (%)
Ancestries Reported - Swedish (%)
Ancestries Reported - Swiss (%)
Ancestries Reported - Ukrainian (%)
Ancestries Reported - United States (%)
Ancestries Reported - Welsh (%)
Ancestries Reported - West Indian (%)
Ancestries Reported - Other (%)
Educational Attainment - No schooling completed (%)
Educational Attainment - Less than high school (%)
Educational Attainment - High school or equivalent (%)
Educational Attainment - Less than 1 year of college (%)
Educational Attainment - 1 or more years of college (%)
Educational Attainment - Associate degree (%)
Educational Attainment - Bachelor's degree (%)
Educational Attainment - Master's degree (%)
Educational Attainment - Professional school degree (%)
Educational Attainment - Doctorate degree (%)
School Enrollment - Nursery, preschool (%)
School Enrollment - Kindergarten (%)
School Enrollment - Grade 1 to 4 (%)
School Enrollment - Grade 5 to 8 (%)
School Enrollment - Grade 9 to 12 (%)
School Enrollment - College undergrad (%)
School Enrollment - Graduate or professional (%)
School Enrollment - Not enrolled in school (%)
School enrollment - Public schools (%)
School enrollment - Private schools (%)
School enrollment - Not enrolled (%)
Median number of rooms in houses and condos
Median number of rooms in apartments
Housing units lacking complete plumbing facilities (%)
Housing units lacking complete kitchen facilities (%)
Density of houses
Urban houses (%)
Rural houses (%)
Households with people 60 years and over (%)
Households with people 65 years and over (%)
Households with people 75 years and over (%)
Households with one or more nonrelatives (%)
Households with no nonrelatives (%)
Population in households (%)
Family households (%)
Nonfamily households (%)
Population in families (%)
Family households with own children (%)
Median number of bedrooms in owner occupied houses
Mean number of bedrooms in owner occupied houses
Median number of bedrooms in renter occupied houses
Mean number of bedrooms in renter occupied houses
Median number of vehichles in owner occupied houses
Mean number of vehichles in owner occupied houses
Median number of vehichles in renter occupied houses
Mean number of vehichles in renter occupied houses
Mortgage status - with mortgage (%)
Mortgage status - with second mortgage (%)
Mortgage status - with home equity loan (%)
Mortgage status - with both second mortgage and home equity loan (%)
Mortgage status - without a mortgage (%)
Average family size
Average family size - White
Average family size - Black or African American
Average family size - Asian
Average family size - Hispanic or Latino
Average family size - American Indian and Alaska Native
Average family size - Multirace
Average family size - Other Race
Geographical mobility - Same house 1 year ago (%)
Geographical mobility - Moved within same county (%)
Geographical mobility - Moved from different county within same state (%)
Geographical mobility - Moved from different state (%)
Geographical mobility - Moved from abroad (%)
Place of birth - Born in state of residence (%)
Place of birth - Born in other state (%)
Place of birth - Native, outside of US (%)
Place of birth - Foreign born (%)
Housing units in structures - 1, detached (%)
Housing units in structures - 1, attached (%)
Housing units in structures - 2 (%)
Housing units in structures - 3 or 4 (%)
Housing units in structures - 5 to 9 (%)
Housing units in structures - 10 to 19 (%)
Housing units in structures - 20 to 49 (%)
Housing units in structures - 50 or more (%)
Housing units in structures - Mobile home (%)
Housing units in structures - Boat, RV, van, etc. (%)
House/condo owner moved in on average (years ago)
Renter moved in on average (years ago)
Year householder moved into unit - Moved in 1999 to March 2000 (%)
Year householder moved into unit - Moved in 1995 to 1998 (%)
Year householder moved into unit - Moved in 1990 to 1994 (%)
Year householder moved into unit - Moved in 1980 to 1989 (%)
Year householder moved into unit - Moved in 1970 to 1979 (%)
Year householder moved into unit - Moved in 1969 or earlier (%)
Means of transportation to work - Drove car alone (%)
Means of transportation to work - Carpooled (%)
Means of transportation to work - Public transportation (%)
Means of transportation to work - Bus or trolley bus (%)
Means of transportation to work - Streetcar or trolley car (%)
Means of transportation to work - Subway or elevated (%)
Means of transportation to work - Railroad (%)
Means of transportation to work - Ferryboat (%)
Means of transportation to work - Taxicab (%)
Means of transportation to work - Motorcycle (%)
Means of transportation to work - Bicycle (%)
Means of transportation to work - Walked (%)
Means of transportation to work - Other means (%)
Working at home (%)
Industry diversity
Most Common Industries - Agriculture, forestry, fishing and hunting, and mining (%)
Most Common Industries - Agriculture, forestry, fishing and hunting (%)
Most Common Industries - Mining, quarrying, and oil and gas extraction (%)
Most Common Industries - Construction (%)
Most Common Industries - Manufacturing (%)
Most Common Industries - Wholesale trade (%)
Most Common Industries - Retail trade (%)
Most Common Industries - Transportation and warehousing, and utilities (%)
Most Common Industries - Transportation and warehousing (%)
Most Common Industries - Utilities (%)
Most Common Industries - Information (%)
Most Common Industries - Finance and insurance, and real estate and rental and leasing (%)
Most Common Industries - Finance and insurance (%)
Most Common Industries - Real estate and rental and leasing (%)
Most Common Industries - Professional, scientific, and management, and administrative and waste management services (%)
Most Common Industries - Professional, scientific, and technical services (%)
Most Common Industries - Management of companies and enterprises (%)
Most Common Industries - Administrative and support and waste management services (%)
Most Common Industries - Educational services, and health care and social assistance (%)
Most Common Industries - Educational services (%)
Most Common Industries - Health care and social assistance (%)
Most Common Industries - Arts, entertainment, and recreation, and accommodation and food services (%)
Most Common Industries - Arts, entertainment, and recreation (%)
Most Common Industries - Accommodation and food services (%)
Most Common Industries - Other services, except public administration (%)
Most Common Industries - Public administration (%)
Occupation diversity
Most Common Occupations - Management, business, science, and arts occupations (%)
Most Common Occupations - Management, business, and financial occupations (%)
Most Common Occupations - Management occupations (%)
Most Common Occupations - Business and financial operations occupations (%)
Most Common Occupations - Computer, engineering, and science occupations (%)
Most Common Occupations - Computer and mathematical occupations (%)
Most Common Occupations - Architecture and engineering occupations (%)
Most Common Occupations - Life, physical, and social science occupations (%)
Most Common Occupations - Education, legal, community service, arts, and media occupations (%)
Most Common Occupations - Community and social service occupations (%)
Most Common Occupations - Legal occupations (%)
Most Common Occupations - Education, training, and library occupations (%)
Most Common Occupations - Arts, design, entertainment, sports, and media occupations (%)
Most Common Occupations - Healthcare practitioners and technical occupations (%)
Most Common Occupations - Health diagnosing and treating practitioners and other technical occupations (%)
Most Common Occupations - Health technologists and technicians (%)
Most Common Occupations - Service occupations (%)
Most Common Occupations - Healthcare support occupations (%)
Most Common Occupations - Protective service occupations (%)
Most Common Occupations - Fire fighting and prevention, and other protective service workers including supervisors (%)
Most Common Occupations - Law enforcement workers including supervisors (%)
Most Common Occupations - Food preparation and serving related occupations (%)
Most Common Occupations - Building and grounds cleaning and maintenance occupations (%)
Most Common Occupations - Personal care and service occupations (%)
Most Common Occupations - Sales and office occupations (%)
Most Common Occupations - Sales and related occupations (%)
Most Common Occupations - Office and administrative support occupations (%)
Most Common Occupations - Natural resources, construction, and maintenance occupations (%)
Most Common Occupations - Farming, fishing, and forestry occupations (%)
Most Common Occupations - Construction and extraction occupations (%)
Most Common Occupations - Installation, maintenance, and repair occupations (%)
Most Common Occupations - Production, transportation, and material moving occupations (%)
Most Common Occupations - Production occupations (%)
Most Common Occupations - Transportation occupations (%)
Most Common Occupations - Material moving occupations (%)
People in Group quarters - Institutionalized population (%)
People in Group quarters - Correctional institutions (%)
People in Group quarters - Federal prisons and detention centers (%)
People in Group quarters - Halfway houses (%)
People in Group quarters - Local jails and other confinement facilities (including police lockups) (%)
People in Group quarters - Military disciplinary barracks (%)
People in Group quarters - State prisons (%)
People in Group quarters - Other types of correctional institutions (%)
People in Group quarters - Nursing homes (%)
People in Group quarters - Hospitals/wards, hospices, and schools for the handicapped (%)
People in Group quarters - Hospitals/wards and hospices for chronically ill (%)
People in Group quarters - Hospices or homes for chronically ill (%)
People in Group quarters - Military hospitals or wards for chronically ill (%)
People in Group quarters - Other hospitals or wards for chronically ill (%)
People in Group quarters - Hospitals or wards for drug/alcohol abuse (%)
People in Group quarters - Mental (Psychiatric) hospitals or wards (%)
People in Group quarters - Schools, hospitals, or wards for the mentally retarded (%)
People in Group quarters - Schools, hospitals, or wards for the physically handicapped (%)
People in Group quarters - Institutions for the deaf (%)
People in Group quarters - Institutions for the blind (%)
People in Group quarters - Orthopedic wards and institutions for the physically handicapped (%)
People in Group quarters - Wards in general hospitals for patients who have no usual home elsewhere (%)
People in Group quarters - Wards in military hospitals for patients who have no usual home elsewhere (%)
People in Group quarters - Juvenile institutions (%)
People in Group quarters - Long-term care (%)
People in Group quarters - Homes for abused, dependent, and neglected children (%)
People in Group quarters - Residential treatment centers for emotionally disturbed children (%)
People in Group quarters - Training schools for juvenile delinquents (%)
People in Group quarters - Short-term care, detention or diagnostic centers for delinquent children (%)
People in Group quarters - Type of juvenile institution unknown (%)
People in Group quarters - Noninstitutionalized population (%)
People in Group quarters - College dormitories (includes college quarters off campus) (%)
People in Group quarters - Military quarters (%)
People in Group quarters - On base (%)
People in Group quarters - Barracks, unaccompanied personnel housing (UPH), (Enlisted/Officer), ;and similar group living quarters for military personnel (%)
People in Group quarters - Transient quarters for temporary residents (%)
People in Group quarters - Military ships (%)
People in Group quarters - Group homes (%)
People in Group quarters - Homes or halfway houses for drug/alcohol abuse (%)
People in Group quarters - Homes for the mentally ill (%)
People in Group quarters - Homes for the mentally retarded (%)
People in Group quarters - Homes for the physically handicapped (%)
People in Group quarters - Other group homes (%)
People in Group quarters - Religious group quarters (%)
People in Group quarters - Dormitories (%)
People in Group quarters - Agriculture workers' dormitories on farms (%)
People in Group quarters - Job Corps and vocational training facilities (%)
People in Group quarters - Other workers' dormitories (%)
People in Group quarters - Crews of maritime vessels (%)
People in Group quarters - Other nonhousehold living situations (%)
People in Group quarters - Other noninstitutional group quarters (%)
Residents speaking English at home (%)
Residents speaking English at home - Born in the United States (%)
Residents speaking English at home - Native, born elsewhere (%)
Residents speaking English at home - Foreign born (%)
Residents speaking Spanish at home (%)
Residents speaking Spanish at home - Born in the United States (%)
Residents speaking Spanish at home - Native, born elsewhere (%)
Residents speaking Spanish at home - Foreign born (%)
Residents speaking other language at home (%)
Residents speaking other language at home - Born in the United States (%)
Residents speaking other language at home - Native, born elsewhere (%)
Residents speaking other language at home - Foreign born (%)
Class of Workers - Employee of private company (%)
Class of Workers - Self-employed in own incorporated business (%)
Class of Workers - Private not-for-profit wage and salary workers (%)
Class of Workers - Local government workers (%)
Class of Workers - State government workers (%)
Class of Workers - Federal government workers (%)
Class of Workers - Self-employed workers in own not incorporated business and Unpaid family workers (%)
House heating fuel used in houses and condos - Utility gas (%)
House heating fuel used in houses and condos - Bottled, tank, or LP gas (%)
House heating fuel used in houses and condos - Electricity (%)
House heating fuel used in houses and condos - Fuel oil, kerosene, etc. (%)
House heating fuel used in houses and condos - Coal or coke (%)
House heating fuel used in houses and condos - Wood (%)
House heating fuel used in houses and condos - Solar energy (%)
House heating fuel used in houses and condos - Other fuel (%)
House heating fuel used in houses and condos - No fuel used (%)
House heating fuel used in apartments - Utility gas (%)
House heating fuel used in apartments - Bottled, tank, or LP gas (%)
House heating fuel used in apartments - Electricity (%)
House heating fuel used in apartments - Fuel oil, kerosene, etc. (%)
House heating fuel used in apartments - Coal or coke (%)
House heating fuel used in apartments - Wood (%)
House heating fuel used in apartments - Solar energy (%)
House heating fuel used in apartments - Other fuel (%)
House heating fuel used in apartments - No fuel used (%)
Armed forces status - In Armed Forces (%)
Armed forces status - Civilian (%)
Armed forces status - Civilian - Veteran (%)
Armed forces status - Civilian - Nonveteran (%)
Fatal accidents locations in years 2005-2021
Fatal accidents locations in 2005
Fatal accidents locations in 2006
Fatal accidents locations in 2007
Fatal accidents locations in 2008
Fatal accidents locations in 2009
Fatal accidents locations in 2010
Fatal accidents locations in 2011
Fatal accidents locations in 2012
Fatal accidents locations in 2013
Fatal accidents locations in 2014
Fatal accidents locations in 2015
Fatal accidents locations in 2016
Fatal accidents locations in 2017
Fatal accidents locations in 2018
Fatal accidents locations in 2019
Fatal accidents locations in 2020
Fatal accidents locations in 2021
Alcohol use - People drinking some alcohol every month (%)
Alcohol use - People not drinking at all (%)
Alcohol use - Average days/month drinking alcohol
Alcohol use - Average drinks/week
Alcohol use - Average days/year people drink much
Audiometry - Average condition of hearing (%)
Audiometry - People that can hear a whisper from across a quiet room (%)
Audiometry - People that can hear normal voice from across a quiet room (%)
Audiometry - Ears ringing, roaring, buzzing (%)
Audiometry - Had a job exposure to loud noise (%)
Audiometry - Had off-work exposure to loud noise (%)
Blood Pressure & Cholesterol - Has high blood pressure (%)
Blood Pressure & Cholesterol - Checking blood pressure at home (%)
Blood Pressure & Cholesterol - Frequently checking blood cholesterol (%)
Blood Pressure & Cholesterol - Has high cholesterol level (%)
Consumer Behavior - Money monthly spent on food at supermarket/grocery store
Consumer Behavior - Money monthly spent on food at other stores
Consumer Behavior - Money monthly spent on eating out
Consumer Behavior - Money monthly spent on carryout/delivered foods
Consumer Behavior - Income spent on food at supermarket/grocery store (%)
Consumer Behavior - Income spent on food at other stores (%)
Consumer Behavior - Income spent on eating out (%)
Consumer Behavior - Income spent on carryout/delivered foods (%)
Current Health Status - General health condition (%)
Current Health Status - Blood donors (%)
Current Health Status - Has blood ever tested for HIV virus (%)
Current Health Status - Left-handed people (%)
Dermatology - People using sunscreen (%)
Diabetes - Diabetics (%)
Diabetes - Had a blood test for high blood sugar (%)
Diabetes - People taking insulin (%)
Diet Behavior & Nutrition - Diet health (%)
Diet Behavior & Nutrition - Milk product consumption (# of products/month)
Diet Behavior & Nutrition - Meals not home prepared (#/week)
Diet Behavior & Nutrition - Meals from fast food or pizza place (#/week)
Diet Behavior & Nutrition - Ready-to-eat foods (#/month)
Diet Behavior & Nutrition - Frozen meals/pizza (#/month)
Drug Use - People that ever used marijuana or hashish (%)
Drug Use - Ever used hard drugs (%)
Drug Use - Ever used any form of cocaine (%)
Drug Use - Ever used heroin (%)
Drug Use - Ever used methamphetamine (%)
Health Insurance - People covered by health insurance (%)
Kidney Conditions-Urology - Avg. # of times urinating at night
Medical Conditions - People with asthma (%)
Medical Conditions - People with anemia (%)
Medical Conditions - People with psoriasis (%)
Medical Conditions - People with overweight (%)
Medical Conditions - Elderly people having difficulties in thinking or remembering (%)
Medical Conditions - People who ever received blood transfusion (%)
Medical Conditions - People having trouble seeing even with glass/contacts (%)
Medical Conditions - People with arthritis (%)
Medical Conditions - People with gout (%)
Medical Conditions - People with congestive heart failure (%)
Medical Conditions - People with coronary heart disease (%)
Medical Conditions - People with angina pectoris (%)
Medical Conditions - People who ever had heart attack (%)
Medical Conditions - People who ever had stroke (%)
Medical Conditions - People with emphysema (%)
Medical Conditions - People with thyroid problem (%)
Medical Conditions - People with chronic bronchitis (%)
Medical Conditions - People with any liver condition (%)
Medical Conditions - People who ever had cancer or malignancy (%)
Mental Health - People who have little interest in doing things (%)
Mental Health - People feeling down, depressed, or hopeless (%)
Mental Health - People who have trouble sleeping or sleeping too much (%)
Mental Health - People feeling tired or having little energy (%)
Mental Health - People with poor appetite or overeating (%)
Mental Health - People feeling bad about themself (%)
Mental Health - People who have trouble concentrating on things (%)
Mental Health - People moving or speaking slowly or too fast (%)
Mental Health - People having thoughts they would be better off dead (%)
Oral Health - Average years since last visit a dentist
Oral Health - People embarrassed because of mouth (%)
Oral Health - People with gum disease (%)
Oral Health - General health of teeth and gums (%)
Oral Health - Average days a week using dental floss/device
Oral Health - Average days a week using mouthwash for dental problem
Oral Health - Average number of teeth
Pesticide Use - Households using pesticides to control insects (%)
Pesticide Use - Households using pesticides to kill weeds (%)
Physical Activity - People doing vigorous-intensity work activities (%)
Physical Activity - People doing moderate-intensity work activities (%)
Physical Activity - People walking or bicycling (%)
Physical Activity - People doing vigorous-intensity recreational activities (%)
Physical Activity - People doing moderate-intensity recreational activities (%)
Physical Activity - Average hours a day doing sedentary activities
Physical Activity - Average hours a day watching TV or videos
Physical Activity - Average hours a day using computer
Physical Functioning - People having limitations keeping them from working (%)
Physical Functioning - People limited in amount of work they can do (%)
Physical Functioning - People that need special equipment to walk (%)
Physical Functioning - People experiencing confusion/memory problems (%)
Physical Functioning - People requiring special healthcare equipment (%)
Prescription Medications - Average number of prescription medicines taking
Preventive Aspirin Use - Adults 40+ taking low-dose aspirin (%)
Reproductive Health - Vaginal deliveries (%)
Reproductive Health - Cesarean deliveries (%)
Reproductive Health - Deliveries resulted in a live birth (%)
Reproductive Health - Pregnancies resulted in a delivery (%)
Reproductive Health - Women breastfeeding newborns (%)
Reproductive Health - Women that had a hysterectomy (%)
Reproductive Health - Women that had both ovaries removed (%)
Reproductive Health - Women that have ever taken birth control pills (%)
Reproductive Health - Women taking birth control pills (%)
Reproductive Health - Women that have ever used Depo-Provera or injectables (%)
Reproductive Health - Women that have ever used female hormones (%)
Sexual Behavior - People 18+ that ever had sex (vaginal, anal, or oral) (%)
Sexual Behavior - Males 18+ that ever had vaginal sex with a woman (%)
Sexual Behavior - Males 18+ that ever performed oral sex on a woman (%)
Sexual Behavior - Males 18+ that ever had anal sex with a woman (%)
Sexual Behavior - Males 18+ that ever had any sex with a man (%)
Sexual Behavior - Females 18+ that ever had vaginal sex with a man (%)
Sexual Behavior - Females 18+ that ever performed oral sex on a man (%)
Sexual Behavior - Females 18+ that ever had anal sex with a man (%)
Sexual Behavior - Females 18+ that ever had any kind of sex with a woman (%)
Sexual Behavior - Average age people first had sex
Sexual Behavior - Average number of female sex partners in lifetime (males 18+)
Sexual Behavior - Average number of female vaginal sex partners in lifetime (males 18+)
Sexual Behavior - Average age people first performed oral sex on a woman (18+)
Sexual Behavior - Average number of woman performed oral sex on in lifetime (18+)
Sexual Behavior - Average number of male sex partners in lifetime (males 18+)
Sexual Behavior - Average number of male anal sex partners in lifetime (males 18+)
Sexual Behavior - Average age people first performed oral sex on a man (18+)
Sexual Behavior - Average number of male oral sex partners in lifetime (18+)
Sexual Behavior - People using protection when performing oral sex (%)
Sexual Behavior - Average number of times people have vaginal or anal sex a year
Sexual Behavior - People having sex without condom (%)
Sexual Behavior - Average number of male sex partners in lifetime (females 18+)
Sexual Behavior - Average number of male vaginal sex partners in lifetime (females 18+)
Sexual Behavior - Average number of female sex partners in lifetime (females 18+)
Sexual Behavior - Circumcised males 18+ (%)
Sleep Disorders - Average hours sleeping at night
Sleep Disorders - People that has trouble sleeping (%)
Smoking-Cigarette Use - People smoking cigarettes (%)
Taste & Smell - People 40+ having problems with smell (%)
Taste & Smell - People 40+ having problems with taste (%)
Taste & Smell - People 40+ that ever had wisdom teeth removed (%)
Taste & Smell - People 40+ that ever had tonsils teeth removed (%)
Taste & Smell - People 40+ that ever had a loss of consciousness because of a head injury (%)
Taste & Smell - People 40+ that ever had a broken nose or other serious injury to face or skull (%)
Taste & Smell - People 40+ that ever had two or more sinus infections (%)
Weight - Average height (inches)
Weight - Average weight (pounds)
Weight - Average BMI
Weight - People that are obese (%)
Weight - People that ever were obese (%)
Weight - People trying to lose weight (%)
Urban population: 920
Rural population: 10,678
Estimated median house/condo value in 2022: $546,643
98580:
$546,643Washington:
$569,500
Median resident age: This zip code:
46.5 yearsWashington median age:
38.4 years
Average household size: This zip code:
2.6 peopleWashington:
2.5 people
Averages for the 2020 tax year for zip code 98580, filed in 2021:
Average Adjusted Gross Income (AGI) in 2020: $75,889 (Individual Income Tax Returns) Here:
$75,889State:
$99,264
Salary/wage: $66,753 (reported on 82.6% of returns )Here:
$66,753State:
$80,347
(% of AGI for various income ranges: 1126.5% for AGIs below $25k , 3293.1% for AGIs $25k-50k , 6090.8% for AGIs $50k-75k , 8971.7% for AGIs $75k-100k , 16783.8% for AGIs $100k-200k , 56535.7% for AGIs over 200k ) Taxable interest for individuals: $1,101 (reported on 25.6% of returns )This zip code:
$1,101Washington:
$2,077
(% of AGI for various income ranges: 12.5% for AGIs below $25k , 11.0% for AGIs $25k-50k , 31.6% for AGIs $50k-75k , 28.3% for AGIs $75k-100k , 73.5% for AGIs $100k-200k , 515.7% for AGIs over 200k ) Ordinary dividends: $3,755 (reported on 13.2% of returns )(% of AGI for various income ranges: 14.2% for AGIs below $25k , 17.9% for AGIs $25k-50k , 35.3% for AGIs $50k-75k , 53.2% for AGIs $75k-100k , 99.2% for AGIs $100k-200k , 1462.9% for AGIs over 200k ) Net capital gain/loss in AGI: +$15,551 (reported on 12.8% of returns )Here:
+$15,551State:
+$40,092
(% of AGI for various income ranges: 4.9% for AGIs below $25k , 8.7% for AGIs $25k-50k , 39.2% for AGIs $50k-75k , 46.8% for AGIs $75k-100k , 352.1% for AGIs $100k-200k , 9835.7% for AGIs over 200k ) Profit/loss from business: +$13,048 (reported on 9.7% of returns )Here:
+$13,048State:
+$18,312
(% of AGI for various income ranges: 58.0% for AGIs below $25k , 102.7% for AGIs $25k-50k , 132.4% for AGIs $50k-75k , 120.2% for AGIs $75k-100k , 185.6% for AGIs $100k-200k , 3098.6% for AGIs over 200k ) Taxable individual retirement arrangement distribution: $23,430 (reported on 6.1% of returns )98580:
$23,430Washington:
$24,221
(% of AGI for various income ranges: 34.5% for AGIs below $25k , 66.4% for AGIs $25k-50k , 71.3% for AGIs $50k-75k , 179.6% for AGIs $75k-100k , 410.0% for AGIs $100k-200k , 3004.3% for AGIs over 200k ) Total itemized deductions: $29,287 (reported on 11.2% of returns )Here:
$29,287State:
$39,068
(% of AGI for various income ranges: 59.6% for AGIs below $25k , 136.5% for AGIs $25k-50k , 323.2% for AGIs $50k-75k , 528.1% for AGIs $75k-100k , 991.2% for AGIs $100k-200k , 4650.0% for AGIs over 200k ) Charity contributions: $5,331 (reported on 7.3% of returns )(% of AGI for various income ranges: 11.1% for AGIs $25k-50k , 14.8% for AGIs $50k-75k , 40.2% for AGIs $75k-100k , 162.7% for AGIs $100k-200k , 651.4% for AGIs over 200k ) Taxes paid: $7,407 (reported on 11.0% of returns )(% of AGI for various income ranges: 15.7% for AGIs below $25k , 30.7% for AGIs $25k-50k , 77.9% for AGIs $50k-75k , 133.8% for AGIs $75k-100k , 260.5% for AGIs $100k-200k , 1055.7% for AGIs over 200k ) Earned income credit: $2,225 (reported on 10.5% of returns )(% of AGI for various income ranges: 75.8% for AGIs below $25k , 53.6% for AGIs $25k-50k ) Percentage of individuals using paid preparers for their 2020 taxes: 92.5%(% for various income ranges: 89.8% for AGIs below $25k , 93.3% for AGIs $25k-50k , 93.7% for AGIs $50k-75k , 91.9% for AGIs $75k-100k , 94.2% for AGIs $100k-200k , 90.5% for AGIs over 200k )
Averages for the 2012 tax year for zip code 98580, filed in 2013:
Average Adjusted Gross Income (AGI) in 2012: $55,279 (Individual Income Tax Returns) Here:
$55,279State:
$69,533
Salary/wage: $50,202 (reported on 84.9% of returns )Here:
$50,202State:
$57,267
(% of AGI for various income ranges: 72.8% for AGIs below $25k , 78.7% for AGIs $25k-50k , 80.3% for AGIs $50k-75k , 81.2% for AGIs $75k-100k , 78.8% for AGIs $100k-200k , 56.9% for AGIs over 200k ) Taxable interest for individuals: $1,166 (reported on 31.1% of returns )This zip code:
$1,166Washington:
$1,816
(% of AGI for various income ranges: 1.0% for AGIs below $25k , 0.4% for AGIs $25k-50k , 0.5% for AGIs $50k-75k , 0.6% for AGIs $75k-100k , 0.8% for AGIs $100k-200k , 1.0% for AGIs over 200k ) Ordinary dividends: $3,021 (reported on 13.5% of returns )(% of AGI for various income ranges: 1.0% for AGIs below $25k , 0.6% for AGIs $25k-50k , 0.4% for AGIs $50k-75k , 0.7% for AGIs $75k-100k , 0.7% for AGIs $100k-200k , 1.7% for AGIs over 200k ) Net capital gain/loss in AGI: +$2,238 (reported on 10.7% of returns )Here:
+$2,238State:
+$21,568
(% of AGI for various income ranges: 0.2% for AGIs $75k-100k , 1.0% for AGIs $100k-200k , 1.6% for AGIs over 200k ) Profit/loss from business: +$10,217 (reported on 10.5% of returns )Here:
+$10,217State:
+$16,521
(% of AGI for various income ranges: 4.2% for AGIs below $25k , 2.5% for AGIs $25k-50k , 0.9% for AGIs $50k-75k , 1.5% for AGIs $75k-100k , 2.6% for AGIs $100k-200k ) Taxable individual retirement arrangement distribution: $14,160 (reported on 7.7% of returns )98580:
$14,160Washington:
$18,648
(% of AGI for various income ranges: 2.5% for AGIs below $25k , 1.2% for AGIs $25k-50k , 1.3% for AGIs $50k-75k , 2.3% for AGIs $75k-100k , 3.0% for AGIs $100k-200k ) Total itemized deductions: $20,915 (24% of AGI, reported on 37.0% of returns )Here:
$20,915State:
$23,872
Here:
23.6% of AGIState:
18.2% of AGI
(% of AGI for various income ranges: 12.5% for AGIs below $25k , 10.9% for AGIs $25k-50k , 13.4% for AGIs $50k-75k , 15.4% for AGIs $75k-100k , 15.9% for AGIs $100k-200k , 12.6% for AGIs over 200k ) Charity contributions: $2,775 (reported on 26.5% of returns )(% of AGI for various income ranges: 0.8% for AGIs below $25k , 0.6% for AGIs $25k-50k , 1.0% for AGIs $50k-75k , 1.4% for AGIs $75k-100k , 1.8% for AGIs $100k-200k , 2.2% for AGIs over 200k ) Taxes paid: $5,513 (reported on 36.5% of returns )(% of AGI for various income ranges: 3.4% for AGIs below $25k , 2.8% for AGIs $25k-50k , 3.3% for AGIs $50k-75k , 3.9% for AGIs $75k-100k , 4.4% for AGIs $100k-200k , 3.0% for AGIs over 200k ) Earned income credit: $2,136 (reported on 16.3% of returns )(% of AGI for various income ranges: 6.3% for AGIs below $25k , 1.1% for AGIs $25k-50k ) Percentage of individuals using paid preparers for their 2012 taxes: 42.1%(% for various income ranges: 36.0% for AGIs below $25k , 41.1% for AGIs $25k-50k , 44.3% for AGIs $50k-75k , 42.6% for AGIs $75k-100k , 53.1% for AGIs $100k-200k , 66.7% for AGIs over 200k )
Averages for the 2004 tax year for zip code 98580, filed in 2005:
Average Adjusted Gross Income (AGI) in 2004: $45,403 (Individual Income Tax Returns) Here:
$45,403State:
$54,331
Salary/wage: $42,815 (reported on 86.3% of returns )Here:
$42,815State:
$45,761
(% of AGI for various income ranges: 192.4% for AGIs below $10k , 73.1% for AGIs $10k-25k , 84.4% for AGIs $25k-50k , 83.3% for AGIs $50k-75k , 87.4% for AGIs $75k-100k , 71.5% for AGIs over 100k ) Taxable interest for individuals: $1,272 (reported on 38.7% of returns )This zip code:
$1,272Washington:
$2,110
(% of AGI for various income ranges: 7.9% for AGIs below $10k , 1.7% for AGIs $10k-25k , 0.8% for AGIs $25k-50k , 1.1% for AGIs $50k-75k , 0.6% for AGIs $75k-100k , 1.2% for AGIs over 100k ) Taxable dividends: $1,932 (reported on 16.6% of returns )(% of AGI for various income ranges: 4.4% for AGIs below $10k , 0.8% for AGIs $10k-25k , 0.4% for AGIs $25k-50k , 0.4% for AGIs $50k-75k , 0.4% for AGIs $75k-100k , 1.3% for AGIs over 100k ) Net capital gain/loss: +$10,500 (reported on 13.8% of returns )Here:
+$10,500State:
+$15,835
(% of AGI for various income ranges: -2.1% for AGIs below $10k , 0.6% for AGIs $10k-25k , 0.4% for AGIs $25k-50k , 0.7% for AGIs $50k-75k , 0.6% for AGIs $75k-100k , 10.8% for AGIs over 100k ) Profit/loss from business: +$7,736 (reported on 12.7% of returns )Here:
+$7,736State:
+$13,994
(% of AGI for various income ranges: 11.4% for AGIs below $10k , 5.4% for AGIs $10k-25k , 1.7% for AGIs $25k-50k , 2.4% for AGIs $50k-75k , 1.8% for AGIs $75k-100k , 1.2% for AGIs over 100k ) IRA payment deduction: $2,548 (reported on 2.0% of returns )98580:
$2,548Washington:
$3,001
(% of AGI for various income ranges: 0.2% for AGIs $10k-25k , 0.2% for AGIs $25k-50k , 0.1% for AGIs $50k-75k , 0.1% for AGIs over 100k ) Total itemized deductions: $17,693 (25% of AGI, reported on 41.2% of returns )Here:
$17,693State:
$19,669
Here:
25.5% of AGIState:
20.7% of AGI
(% of AGI for various income ranges: 34.5% for AGIs below $10k , 11.2% for AGIs $10k-25k , 16.4% for AGIs $25k-50k , 17.0% for AGIs $50k-75k , 17.4% for AGIs $75k-100k , 14.8% for AGIs over 100k ) Charity contributions deductions: $2,161 (3% of AGI, reported on 32.9% of returns )Here:
2.9% of AGIState:
3.5% of AGI
(% of AGI for various income ranges: 1.1% for AGIs below $10k , 0.7% for AGIs $10k-25k , 1.3% for AGIs $25k-50k , 1.4% for AGIs $50k-75k , 1.5% for AGIs $75k-100k , 2.4% for AGIs over 100k ) Total tax: $5,643 (reported on 75.7% of returns )(% of AGI for various income ranges: 4.1% for AGIs below $10k , 4.1% for AGIs $10k-25k , 5.9% for AGIs $25k-50k , 8.1% for AGIs $50k-75k , 9.9% for AGIs $75k-100k , 15.1% for AGIs over 100k ) Earned income credit: $1,655 (reported on 13.6% of returns )Percentage of individuals using paid preparers for their 2004 taxes: 50.1%(% for various income ranges: 41.3% for AGIs below $10k , 48.6% for AGIs $10k-25k , 51.7% for AGIs $25k-50k , 51.5% for AGIs $50k-75k , 51.5% for AGIs $75k-100k , 62.2% for AGIs over 100k )
Estimated median household income in 2022: This zip code:
$107,885Washington:
$91,306
Nearest zip codes: 98558 ,
98430 ,
98433 ,
98439 ,
98438 ,
98387 .
South Creek Zip Code Map
Percentage of family households: This zip code:
49.4%Washington:
45.0%
Percentage of households with unmarried partners: This zip code:
6.8%Washington:
48.7%
Likely homosexual households (counted as self-reported same-sex unmarried-partner households)
Lesbian couples: 0.5% of all households Gay men: 0.0% of all households
Household received Food Stamps/SNAP in the past 12 months: 525Household did not receive Food Stamps/SNAP in the past 12 months: 4,012
Women who had a birth in the past 12 months: 182 (89 now married , 86 unmarried) Women who did not have a birth in the past 12 months: 2,118 (1,115 now married , 998 unmarried)
Housing units in zip code 98580 with a mortgage: 2,851 (285
second mortgage , 20
home equity loan , 278
both second mortgage and home equity loan )
Houses without a mortgage: 23
Median monthly owner costs for units with a mortgage: $2,054
Median monthly owner costs for units without a mortgage: $650
Residents with income below the poverty level in 2022:
This zip code:
10.8%Whole state:
10.0%
Residents with income below 50% of the poverty level in 2022:
This zip code:
4.5%Whole state:
4.6%
Median number of rooms in houses and condos: Median number of rooms in apartments: Notable locations in this zip code not listed on our city pages
Click to draw/clear zip code borders Notable locations in zip code 98580: (A) , Eagles Pride Golf Course (B) , Nisqually Station (C) , Greendale (D) , Pierce County Fire District 17 Station 4 (E) , Pierce County Fire District 17 Station 3 (F) , South Pierce Fire and Rescue 17 Station 171 Headquarters (G) , Pierce County Fire District 17 Station 2 (H) . Display/hide their locations on the map
Cemetery: (1) . Display/hide its location on the map
Lakes, reservoirs, and swamps: (A) , Lake Elias (B) , Nisqually Lake (C) , Muck Lake (D) , Bill Lake (E) , Bowman Lake (F) , Brandenburg Marsh (G) , Harts Lake (H) . Display/hide their locations on the map
Streams, rivers, and creeks: (A) , Murray Creek (B) , Rocky Slough (C) , South Creek (D) , Tanwax Creek (E) , Muck Creek (F) , Thompson Creek (G) . Display/hide their locations on the map
Year house built (houses)
8 2020 or later581 2010 to 2019638 2000 to 20091,631 1990 to 1999741 1980 to 1989689 1970 to 1979171 1960 to 196959 1950 to 195985 1940 to 194993 1939 or earlier
Zip code 98580 household income distribution in 2022 283 Less than $10,00024 $10,000 to $14,999118 $15,000 to $19,99978 $20,000 to $24,99913 $25,000 to $29,99957 $30,000 to $34,99975 $35,000 to $39,999166 $40,000 to $44,99953 $45,000 to $49,999471 $50,000 to $59,999233 $60,000 to $74,999525 $75,000 to $99,999599 $100,000 to $124,999370 $125,000 to $149,999721 $150,000 to $199,999762 $200,000 or moreEstimate of home value of owner-occupied houses/condos in 2022 in zip code 98580 89 Less than $10,00016 $30,000 to $34,99923 $50,000 to $59,99945 $90,000 to $99,99960 $100,000 to $124,99919 $125,000 to $149,99945 $150,000 to $174,99985 $200,000 to $249,999196 $250,000 to $299,999547 $300,000 to $399,999596 $400,000 to $499,9991,486 $500,000 to $749,999263 $750,000 to $999,999146 $1,000,000 to $1,499,99916 $1,500,000 to $1,999,99991 $2,000,000 or moreRent paid by renters in 2022 in zip code 98580 26 $450 to $4998 $650 to $69954 $800 to $89922 $900 to $99954 $1,000 to $1,24929 $1,250 to $1,499112 $1,500 to $1,99987 $2,000 to $2,499287 No cash rent
Median gross rent in 2022: $1,904.
Median price asked for vacant for-sale houses and condos in 2022: $374,628.
Estimated median house (or condo) value in 2022 for: White Non-Hispanic householders: $623,607Black or African American householders: $529,276American Indian or Alaska Native householders: $643,736Asian householders: $635,842Some other race householders: $661,102Two or more races householders: $552,563Hispanic or Latino householders: $589,664Estimated median house or condo value in 2022: $546,643
98580:
$546,643Washington:
$569,500
Lower value quartile - upper value quartile: $382,167 - $733,987
Mean price in 2022: Detached houses: $635,459Here:
$635,459State:
$734,307
Mobile homes: $225,350Here:
$225,350State:
$218,362
Housing units in structures:
One, detached: 3,565One, attached: 85Two: 2710 to 19: 1820 to 49: 17Mobile homes: 991Boats, RVs, vans, etc.: 40Unemployment : 6.0%
Means of transportation to work in zip code 98580 73.2% 3,997 Drove a car alone8.3% 453 Carpooled0.3% 18 Bus or trolley bus0.1% 4 Subway or elevated1.1% 58 Walked1.1% 60 Other means15.5% 847 Worked at homeTravel time to work (commute) in zip code 98580 87 Less than 5 minutes111 5 to 9 minutes240 10 to 14 minutes128 15 to 19 minutes516 20 to 24 minutes135 25 to 29 minutes355 30 to 34 minutes350 35 to 39 minutes460 40 to 44 minutes1,142 45 to 59 minutes554 60 to 89 minutes452 90 or more minutes
Percentage of zip code residents living and working in this county: 65.7%
Household type by relationship:
Households: 11,599
Male householders: 2,098 (517 living alone ), Female householders: 2,449 (376 living alone )2,660 spouses (2,591 opposite-sex spouses ), 341 unmarried partners , (326 opposite-sex unmarried partners ), 3,218 children (2,954 natural , 71 adopted , 194 stepchildren ), 186 grandchildren , 83 brothers or sisters , 335 parents , 29 foster children , 59 other relatives , 136 non-relatives In group quarters: 13 (-1 institutionalized population )
Size of family households: 1,640 2-persons , 728 3-persons , 869 4-persons , 122 5-persons , 62 6-persons , 67 7-or-more-persons
Size of nonfamily households: 892 1-person , 105 2-persons , 1 3-persons
1,131 married couples with children. single-parent households (159 men , 745 women ).
93.4% of residents of 98580 zip code speak English at home. of residents speak Spanish at home (66% very well, 21% well, 13% not well ).of residents speak other Indo-European language at home (84% very well, 13% well, 3% not well ).of residents speak Asian or Pacific Island language at home (72% very well, 28% well ).
Foreign born population: 342 (3.0%)
(73.3%
of them are naturalized citizens )
This zip code:
3.0%Whole state:
15.3%
44% Honduras 20% France 9% Thailand 6% Malaysia 4% North Macedonia (Macedonia) 4% Japan 2% Congo 13% German 12% European 10% English 8% American 6% Irish 4% Polish 3% Norwegian
Year of entry for the foreign-born population
130 2010 or later 118 2000 to 2009 160 1990 to 1999 384 Before 1990
Facilities with environmental interests located in this zip code:
1721 286TH E DRUG LAB SITE (1721 286TH ST E in ROY, WA)
(Resource Conservation and Recovery Act (tracking hazardous waste)) STATE MASTER (Washington State Department of Ecology's Facility/Site identification system) - HAZWASTE-WAH000019521, CESQG Organizations: WA ECY (CONTACT/OWNER)
Housing units lacking complete plumbing facilities: 1.6%
Housing units lacking complete kitchen facilities: 3.1%
65.6% Electricity 13.6% Bottled, tank, or LP gas 13.3% Wood 2.1% Utility gas 2.0% Other fuel 1.5% Coal or coke 1.4% No fuel used
Population in 1990: 7,730. Population change in the 1990s: +1,520 (+19.7%).
Place of birth for U.S.-born residents:
This state: 5,502Northeast: 454Midwest: 1,233South: 1,041West: 2,492
55% of the 98580 zip code residents lived in the same house 5 years ago.
Out of people who lived in different houses, 55% lived in this county.
Out of people who lived in different counties, 50% lived in Washington.
92% of the 98580 zip code residents lived in the same house 1 year ago.
Out of people who lived in different houses, 45% moved from this county.
Out of people who lived in different houses, 37% moved from different county within same state.
Out of people who lived in different houses, 24% moved from different state.
Private vs. public school enrollment:
Students in private schools in grades 1 to 8 (elementary and middle school): 291
Here:
25.0%Washington:
12.4%
Students in private schools in grades 9 to 12 (high school): 81
Here:
20.9%Washington:
9.2%
Students in private undergraduate colleges: 95
Here:
17.5%Washington:
16.5%
Occupation by median earnings in the past 12 months ($)
158,434 Law enforcement workers including supervisors 126,170 Computer and mathematical occupations 98,441 Architecture and engineering occupations 94,186 Health diagnosing and treating practitioners and other technical occupations 73,679 Construction and extraction occupations 71,513 Management occupations
Companies with federal contracts located in this zip code:
WILCOX DAIRY FARMS, LLC (40400 HARTS LAKE VALLEY RD in ROY, WA; small business) in 112 contracts from 2003 to 2006
Contracts for Dairy Foods and Eggs, Food Items For Resale, Drugs and Biologicals by Defense Commissary Agency, Department of Defense, Indian Affairs (Assistant Secretary), Department of Veterans Affairs, and others Signed by year: 2000: $0; 2001: $0; 2002: $0; 2003: $1,739,323; 2004: $1,879,021; 2005: $4,548,035; 2006: $1,708,765.
Biggest contracts: with Defense Commissary Agency for Dairy Foods and Eggs. Signed on 2003-10-01. Completion date: 2004-02-29.
, same as above. Signed on 2004-10-01. Completion date: 2005-09-30.
, same as above. Signed on 2005-04-01. Completion date: 2005-05-31.
, same as above. Signed on 2006-01-01. Completion date: 2006-01-31.
RAY F DUDLEY (29902 8TH AVENUE SOUTH in ROY, WA; small business) in 3 contracts from 2003 to 2005
$58,500 with Army for Maintenance, Repair and Rebuilding of Equipment -- Ground Effect Vehicles, Motor Vehicles, Trailers, and Cycles. Signed on 2004-09-27. Completion date: 2004-11-30.
with Geological Survey for Maintenance, Repair or Alteration of Real Property -- Other Administrative Facilities and Service Buildings. Signed on 2003-09-15. Completion date: 2003-09-15.
with Army for Maintenance, Repair and Rebuilding of Equipment -- Ground Effect Vehicles, Motor Vehicles, Trailers, and Cycles. Signed on 2005-09-28. Completion date: 2005-10-14.
Top industries in this zip code by the number of employees in 2005:
Wholesale Trade: Flower, Nursery Stock, and Florists' Supplies Merchant Wholesalers (50-99 employees: 1 establishment)Construction: New Single-Family Housing Construction (except Operative Builders) (20-49: 1, 5-9: 2, 1-4: 2)Accommodation and Food Services: Full-Service Restaurants (20-49: 1, 5-9: 1)Construction: Electrical Contractors (20-49: 1, 1-4: 1)Construction: Commercial and Institutional Building Construction (10-19: 1, 5-9: 1, 1-4: 2)Construction: All Other Specialty Trade Contractors (10-19: 1, 1-4: 4)Construction: Roofing Contractors (10-19: 1, 1-4: 3)Construction: Residential Remodelers (5-9: 2, 1-4: 3)Construction: Framing Contractors (10-19: 1, 1-4: 2)
People in group quarters in 2010:
6 people in group homes intended for adults
People in group quarters in 2000:
49 people in other group homes
3 people in religious group quarters
Fatal accident statistics in 2014:
Fatal accident count: 2Vehicles involved in fatal accidents: 4Fatal accidents caused by drunken drivers: 1Fatalities: 2Persons involved in fatal accidents: 10Pedestrians involved in fatal accidents: 0
Fatal accident statistics in 2013:
Fatal accident count: 3Vehicles involved in fatal accidents: 5Fatal accidents caused by drunken drivers: 2Fatalities: 3Persons involved in fatal accidents: 9Pedestrians involved in fatal accidents: 0
Home Mortgage Disclosure Act Aggregated Statistics For Year 2009(Based on 2 full and 4 partial tracts) A) FHA, FSA/RHS & VA B) Conventional C) Refinancings D) Home Improvement Loans E) Loans on Dwellings For 5+ Families F) Non-occupant Loans on G) Loans On Manufactured Number Average Value Number Average Value Number Average Value Number Average Value Number Average Value Number Average Value Number Average Value
LOANS ORIGINATED 171 $239,327 46 $252,650 749 $227,987 41 $117,490 2 $170,110 33 $212,198 207 $173,327 APPLICATIONS APPROVED, NOT ACCEPTED 16 $222,188 6 $262,023 83 $269,214 11 $135,412 0 $0 4 $236,975 23 $175,040 APPLICATIONS DENIED 34 $179,304 34 $241,952 309 $243,730 14 $148,102 0 $0 5 $151,486 88 $162,675 APPLICATIONS WITHDRAWN 28 $211,454 12 $239,879 201 $241,214 13 $154,382 0 $0 11 $135,929 55 $166,329 FILES CLOSED FOR INCOMPLETENESS 4 $191,568 1 $87,960 34 $271,681 3 $164,027 0 $0 1 $29,930 8 $196,644
Aggregated Statistics For Year 2008(Based on 2 full and 4 partial tracts) A) FHA, FSA/RHS & VA B) Conventional C) Refinancings D) Home Improvement Loans F) Non-occupant Loans on G) Loans On Manufactured Number Average Value Number Average Value Number Average Value Number Average Value Number Average Value Number Average Value
LOANS ORIGINATED 110 $242,225 98 $274,199 475 $234,550 64 $116,455 36 $212,721 231 $182,307 APPLICATIONS APPROVED, NOT ACCEPTED 3 $253,043 16 $261,794 89 $229,428 12 $67,643 1 $294,190 33 $155,402 APPLICATIONS DENIED 23 $209,066 30 $266,634 343 $235,765 113 $139,156 8 $264,050 127 $162,474 APPLICATIONS WITHDRAWN 20 $256,596 24 $299,749 178 $227,721 20 $196,742 2 $294,005 50 $181,459 FILES CLOSED FOR INCOMPLETENESS 8 $319,311 3 $304,640 30 $244,077 13 $155,994 5 $179,646 14 $161,985
Aggregated Statistics For Year 2007(Based on 2 full and 4 partial tracts) A) FHA, FSA/RHS & VA B) Conventional C) Refinancings D) Home Improvement Loans F) Non-occupant Loans on G) Loans On Manufactured Number Average Value Number Average Value Number Average Value Number Average Value Number Average Value Number Average Value
LOANS ORIGINATED 114 $226,160 258 $243,778 660 $230,011 100 $90,581 57 $238,288 262 $162,705 APPLICATIONS APPROVED, NOT ACCEPTED 3 $243,207 41 $255,701 113 $246,112 18 $119,124 8 $238,181 38 $166,109 APPLICATIONS DENIED 22 $213,631 72 $276,463 439 $216,527 137 $125,574 26 $205,098 205 $126,073 APPLICATIONS WITHDRAWN 14 $217,827 46 $282,445 186 $227,137 31 $147,203 14 $208,156 65 $154,535 FILES CLOSED FOR INCOMPLETENESS 4 $243,702 9 $171,081 66 $227,309 8 $165,985 4 $187,318 13 $200,859
Aggregated Statistics For Year 2006(Based on 2 full and 4 partial tracts) A) FHA, FSA/RHS & VA B) Conventional C) Refinancings D) Home Improvement Loans F) Non-occupant Loans on G) Loans On Manufactured Number Average Value Number Average Value Number Average Value Number Average Value Number Average Value Number Average Value
LOANS ORIGINATED 104 $202,188 425 $215,291 714 $194,864 114 $108,908 82 $182,925 308 $158,010 APPLICATIONS APPROVED, NOT ACCEPTED 10 $197,572 68 $211,314 154 $189,704 13 $61,069 13 $255,209 50 $155,968 APPLICATIONS DENIED 34 $185,693 151 $198,213 454 $190,837 143 $105,082 29 $189,047 243 $141,006 APPLICATIONS WITHDRAWN 6 $223,743 71 $194,753 316 $200,030 45 $133,102 12 $121,381 86 $157,761 FILES CLOSED FOR INCOMPLETENESS 2 $160,280 17 $194,709 66 $206,142 3 $104,717 2 $240,910 14 $136,956
Aggregated Statistics For Year 2005(Based on 2 full and 4 partial tracts) A) FHA, FSA/RHS & VA B) Conventional C) Refinancings D) Home Improvement Loans F) Non-occupant Loans on G) Loans On Manufactured Number Average Value Number Average Value Number Average Value Number Average Value Number Average Value Number Average Value
LOANS ORIGINATED 116 $183,715 475 $184,056 731 $174,509 93 $96,343 55 $144,185 267 $138,030 APPLICATIONS APPROVED, NOT ACCEPTED 17 $177,429 72 $147,664 125 $173,724 27 $75,077 14 $155,807 63 $137,893 APPLICATIONS DENIED 23 $171,431 120 $160,010 520 $156,133 129 $67,422 29 $171,594 238 $116,679 APPLICATIONS WITHDRAWN 13 $187,075 83 $164,638 403 $193,301 36 $122,379 22 $157,735 130 $134,348 FILES CLOSED FOR INCOMPLETENESS 4 $205,510 19 $169,530 32 $215,058 3 $68,230 8 $168,144 4 $141,330
Aggregated Statistics For Year 2004(Based on 2 full and 4 partial tracts) A) FHA, FSA/RHS & VA B) Conventional C) Refinancings D) Home Improvement Loans F) Non-occupant Loans on G) Loans On Manufactured Number Average Value Number Average Value Number Average Value Number Average Value Number Average Value Number Average Value
LOANS ORIGINATED 113 $149,280 345 $172,704 695 $158,179 78 $78,187 64 $156,445 278 $123,588 APPLICATIONS APPROVED, NOT ACCEPTED 5 $141,072 67 $131,519 155 $161,094 12 $115,686 4 $152,412 34 $127,644 APPLICATIONS DENIED 18 $137,781 85 $132,328 573 $151,450 91 $60,941 22 $110,945 208 $118,023 APPLICATIONS WITHDRAWN 13 $152,738 36 $141,984 396 $161,297 24 $52,562 13 $158,082 106 $120,351 FILES CLOSED FOR INCOMPLETENESS 5 $167,988 11 $170,142 68 $138,864 7 $32,040 2 $135,120 16 $128,518
Aggregated Statistics For Year 2003(Based on 2 full and 4 partial tracts) A) FHA, FSA/RHS & VA B) Conventional C) Refinancings D) Home Improvement Loans F) Non-occupant Loans on Number Average Value Number Average Value Number Average Value Number Average Value Number Average Value
LOANS ORIGINATED 94 $154,791 266 $152,966 1,440 $150,492 69 $56,420 61 $118,470 APPLICATIONS APPROVED, NOT ACCEPTED 6 $134,773 60 $137,178 192 $155,062 20 $21,072 8 $119,018 APPLICATIONS DENIED 16 $139,018 99 $141,228 542 $140,859 67 $34,896 37 $134,500 APPLICATIONS WITHDRAWN 7 $164,074 55 $131,030 350 $151,703 16 $36,396 16 $120,943 FILES CLOSED FOR INCOMPLETENESS 5 $152,612 5 $115,694 49 $176,991 2 $19,665 1 $103,860
Aggregated Statistics For Year 2002(Based on 2 full tracts) A) FHA, FSA/RHS & VA B) Conventional C) Refinancings D) Home Improvement Loans F) Non-occupant Loans on Number Average Value Number Average Value Number Average Value Number Average Value Number Average Value
LOANS ORIGINATED 100 $154,634 155 $146,480 484 $140,531 35 $30,286 28 $127,829 APPLICATIONS APPROVED, NOT ACCEPTED 10 $137,662 29 $120,302 92 $133,216 6 $5,245 4 $71,290 APPLICATIONS DENIED 8 $131,516 51 $106,389 256 $139,659 31 $22,521 14 $92,149 APPLICATIONS WITHDRAWN 18 $116,029 14 $137,100 136 $139,932 6 $28,843 4 $101,772 FILES CLOSED FOR INCOMPLETENESS 0 $0 10 $144,938 29 $134,542 0 $0 2 $173,060
Aggregated Statistics For Year 2001(Based on 2 full tracts) A) FHA, FSA/RHS & VA B) Conventional C) Refinancings D) Home Improvement Loans F) Non-occupant Loans on Number Average Value Number Average Value Number Average Value Number Average Value Number Average Value
LOANS ORIGINATED 83 $143,420 171 $129,566 370 $135,339 28 $25,636 33 $119,665 APPLICATIONS APPROVED, NOT ACCEPTED 4 $122,420 33 $93,026 69 $121,673 12 $17,536 4 $32,940 APPLICATIONS DENIED 8 $132,991 85 $122,276 230 $112,985 51 $17,854 10 $128,812 APPLICATIONS WITHDRAWN 4 $142,088 33 $138,139 110 $138,967 10 $33,826 8 $99,559 FILES CLOSED FOR INCOMPLETENESS 2 $98,330 4 $109,148 20 $137,760 2 $14,750 0 $0
Aggregated Statistics For Year 2000(Based on 2 full tracts) A) FHA, FSA/RHS & VA B) Conventional C) Refinancings D) Home Improvement Loans E) Loans on Dwellings For 5+ Families F) Non-occupant Loans on Number Average Value Number Average Value Number Average Value Number Average Value Number Average Value Number Average Value
LOANS ORIGINATED 53 $140,259 151 $118,074 147 $107,026 41 $29,163 2 $128,810 16 $63,669 APPLICATIONS APPROVED, NOT ACCEPTED 8 $128,075 51 $125,400 71 $103,039 22 $27,264 0 $0 4 $54,572 APPLICATIONS DENIED 8 $106,934 104 $110,281 205 $89,955 45 $26,658 0 $0 8 $131,516 APPLICATIONS WITHDRAWN 6 $118,980 24 $139,055 63 $100,047 4 $47,690 0 $0 10 $108,360 FILES CLOSED FOR INCOMPLETENESS 0 $0 2 $14,750 41 $84,564 0 $0 0 $0 2 $60,965
Aggregated Statistics For Year 1999(Based on 1 full and 1 partial tracts) A) FHA, FSA/RHS & VA B) Conventional C) Refinancings D) Home Improvement Loans F) Non-occupant Loans on Number Average Value Number Average Value Number Average Value Number Average Value Number Average Value
LOANS ORIGINATED 43 $133,352 125 $125,055 211 $114,549 29 $28,391 13 $95,988 APPLICATIONS APPROVED, NOT ACCEPTED 4 $130,092 34 $126,407 62 $107,642 13 $17,015 4 $92,588 APPLICATIONS DENIED 6 $144,697 84 $89,458 155 $115,578 33 $23,901 8 $98,629 APPLICATIONS WITHDRAWN 3 $144,107 25 $92,717 71 $117,023 4 $73,845 4 $105,410 FILES CLOSED FOR INCOMPLETENESS 0 $0 4 $127,260 32 $120,591 0 $0 1 $159,380
Detailed HMDA statistics for the following Tracts:
0730.01
,
0730.05 ,
0730.06
Private Mortgage Insurance Companies Aggregated Statistics For Year 2009(Based on 2 full and 4 partial tracts) A) Conventional B) Refinancings D) Loans On Manufactured Number Average Value Number Average Value Number Average Value
LOANS ORIGINATED 8 $269,726 12 $343,307 0 $0 APPLICATIONS APPROVED, NOT ACCEPTED 11 $362,576 8 $290,219 0 $0 APPLICATIONS DENIED 0 $0 4 $291,835 1 $169,570 APPLICATIONS WITHDRAWN 0 $0 0 $0 0 $0 FILES CLOSED FOR INCOMPLETENESS 0 $0 0 $0 0 $0
Aggregated Statistics For Year 2008(Based on 2 full and 4 partial tracts) A) Conventional B) Refinancings C) Non-occupant Loans on D) Loans On Manufactured Number Average Value Number Average Value Number Average Value Number Average Value
LOANS ORIGINATED 38 $272,760 37 $315,564 7 $239,624 4 $177,198 APPLICATIONS APPROVED, NOT ACCEPTED 16 $322,191 25 $280,472 5 $260,866 3 $247,720 APPLICATIONS DENIED 3 $332,753 2 $320,555 2 $320,555 0 $0 APPLICATIONS WITHDRAWN 1 $433,460 1 $248,010 0 $0 0 $0 FILES CLOSED FOR INCOMPLETENESS 0 $0 0 $0 0 $0 0 $0
Aggregated Statistics For Year 2007(Based on 2 full and 4 partial tracts) A) Conventional B) Refinancings C) Non-occupant Loans on D) Loans On Manufactured Number Average Value Number Average Value Number Average Value Number Average Value
LOANS ORIGINATED 50 $272,476 38 $317,550 7 $312,687 8 $228,061 APPLICATIONS APPROVED, NOT ACCEPTED 16 $297,419 7 $226,269 4 $277,782 3 $168,483 APPLICATIONS DENIED 8 $384,716 0 $0 0 $0 0 $0 APPLICATIONS WITHDRAWN 2 $238,175 3 $221,750 0 $0 1 $141,960 FILES CLOSED FOR INCOMPLETENESS 2 $384,470 0 $0 0 $0 0 $0
Aggregated Statistics For Year 2006(Based on 2 full and 4 partial tracts) A) Conventional B) Refinancings C) Non-occupant Loans on D) Loans On Manufactured Number Average Value Number Average Value Number Average Value Number Average Value
LOANS ORIGINATED 37 $249,160 19 $229,077 4 $310,722 14 $194,987 APPLICATIONS APPROVED, NOT ACCEPTED 13 $235,428 2 $280,320 2 $307,775 4 $169,595 APPLICATIONS DENIED 7 $204,411 0 $0 0 $0 3 $205,567 APPLICATIONS WITHDRAWN 1 $153,670 0 $0 0 $0 1 $153,670 FILES CLOSED FOR INCOMPLETENESS 2 $191,745 0 $0 0 $0 2 $191,745
Aggregated Statistics For Year 2005(Based on 2 full and 4 partial tracts) A) Conventional B) Refinancings C) Non-occupant Loans on D) Loans On Manufactured Number Average Value Number Average Value Number Average Value Number Average Value
LOANS ORIGINATED 48 $196,548 22 $249,222 4 $131,948 16 $176,489 APPLICATIONS APPROVED, NOT ACCEPTED 5 $148,096 9 $236,374 0 $0 5 $165,616 APPLICATIONS DENIED 4 $189,645 1 $201,830 0 $0 3 $163,640 APPLICATIONS WITHDRAWN 2 $141,430 1 $184,720 1 $184,720 1 $171,690 FILES CLOSED FOR INCOMPLETENESS 0 $0 1 $201,830 0 $0 1 $201,830
Aggregated Statistics For Year 2004(Based on 2 full and 4 partial tracts) A) Conventional B) Refinancings C) Non-occupant Loans on D) Loans On Manufactured Number Average Value Number Average Value Number Average Value Number Average Value
LOANS ORIGINATED 45 $186,518 25 $190,920 3 $230,427 16 $133,635 APPLICATIONS APPROVED, NOT ACCEPTED 14 $188,096 14 $162,174 2 $103,245 3 $111,047 APPLICATIONS DENIED 2 $189,635 2 $140,640 0 $0 1 $106,900 APPLICATIONS WITHDRAWN 4 $163,975 3 $170,913 0 $0 1 $99,200 FILES CLOSED FOR INCOMPLETENESS 0 $0 1 $218,320 0 $0 0 $0
Aggregated Statistics For Year 2003(Based on 2 full and 4 partial tracts) A) Conventional B) Refinancings C) Non-occupant Loans on Number Average Value Number Average Value Number Average Value
LOANS ORIGINATED 79 $167,732 142 $177,356 5 $122,834 APPLICATIONS APPROVED, NOT ACCEPTED 11 $160,765 30 $181,064 0 $0 APPLICATIONS DENIED 0 $0 8 $171,572 0 $0 APPLICATIONS WITHDRAWN 0 $0 4 $206,328 0 $0 FILES CLOSED FOR INCOMPLETENESS 0 $0 0 $0 0 $0
Aggregated Statistics For Year 2002(Based on 2 full tracts) A) Conventional B) Refinancings C) Non-occupant Loans on Number Average Value Number Average Value Number Average Value
LOANS ORIGINATED 43 $141,824 55 $157,328 4 $111,605 APPLICATIONS APPROVED, NOT ACCEPTED 4 $117,012 10 $164,604 0 $0 APPLICATIONS DENIED 0 $0 4 $136,188 0 $0 APPLICATIONS WITHDRAWN 2 $128,810 6 $136,023 2 $128,810 FILES CLOSED FOR INCOMPLETENESS 0 $0 0 $0 0 $0
Aggregated Statistics For Year 2001(Based on 2 full tracts) A) Conventional B) Refinancings C) Non-occupant Loans on Number Average Value Number Average Value Number Average Value
LOANS ORIGINATED 43 $150,742 43 $169,265 2 $117,015 APPLICATIONS APPROVED, NOT ACCEPTED 4 $160,770 12 $176,502 0 $0 APPLICATIONS DENIED 0 $0 6 $175,355 2 $87,515 APPLICATIONS WITHDRAWN 2 $165,195 2 $93,415 0 $0 FILES CLOSED FOR INCOMPLETENESS 0 $0 0 $0 0 $0
Aggregated Statistics For Year 2000(Based on 2 full tracts) A) Conventional B) Refinancings C) Non-occupant Loans on Number Average Value Number Average Value Number Average Value
LOANS ORIGINATED 22 $144,366 28 $141,736 2 $99,315 APPLICATIONS APPROVED, NOT ACCEPTED 4 $107,180 2 $118,980 0 $0 APPLICATIONS DENIED 2 $274,340 0 $0 0 $0 APPLICATIONS WITHDRAWN 2 $108,165 2 $171,095 0 $0 FILES CLOSED FOR INCOMPLETENESS 0 $0 0 $0 0 $0
Aggregated Statistics For Year 1999(Based on 1 full and 1 partial tracts) A) Conventional B) Refinancings C) Non-occupant Loans on Number Average Value Number Average Value Number Average Value
LOANS ORIGINATED 42 $141,776 24 $143,584 1 $216,320 APPLICATIONS APPROVED, NOT ACCEPTED 4 $116,028 6 $156,077 0 $0 APPLICATIONS DENIED 0 $0 3 $169,137 0 $0 APPLICATIONS WITHDRAWN 5 $122,332 0 $0 0 $0 FILES CLOSED FOR INCOMPLETENESS 0 $0 0 $0 0 $0
Detailed PMIC statistics for the following Tracts:
0730.01
,
0730.05 ,
0730.06
2002 - 2018 National Fire Incident Reporting System (NFIRS) incidents See full 2006 National Fire Incident Reporting System statistics for zip code 98580, Washington
Most common first names in zip code 98580 among deceased individuals Name Count Lived (average)
John 29 71.4 years James 25 69.8 years Robert 21 71.3 years William 19 73.4 years Charles 16 73.8 years Dorothy 14 76.1 years Mary 11 78.5 years Margaret 11 81.6 years Helen 11 78.8 years Donald 10 62.3 years
Most common last names in zip code 98580 among deceased individuals Last name Count Lived (average)
Brown 10 75.1 years Miller 7 63.6 years Larson 7 76.4 years Anderson 6 72.0 years Lenz 6 66.5 years Jones 6 63.2 years Johnson 6 67.5 years Byrd 5 70.4 years Rogers 5 72.0 years Davis 5 68.6 years
Businesses in zip code 98580

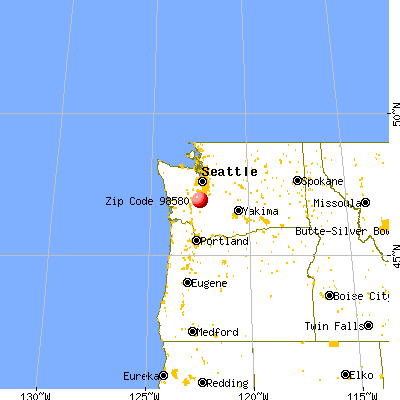


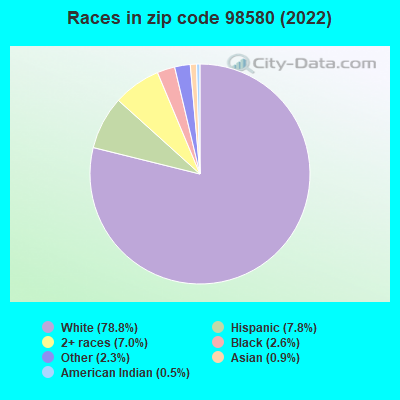


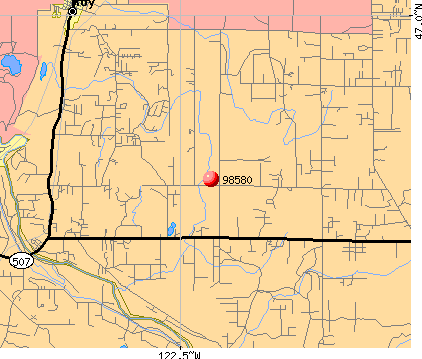 Nearest zip codes: 98558, 98430, 98433, 98439, 98438, 98387.
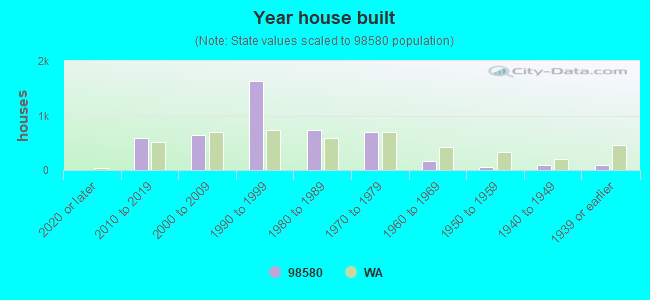
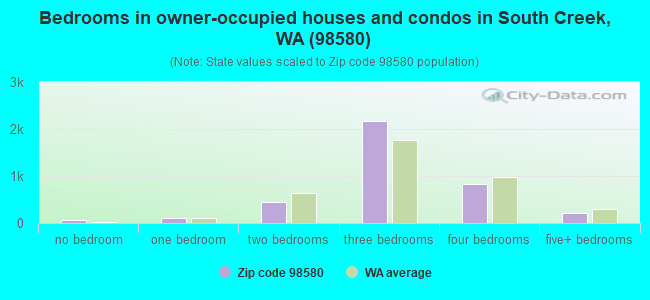
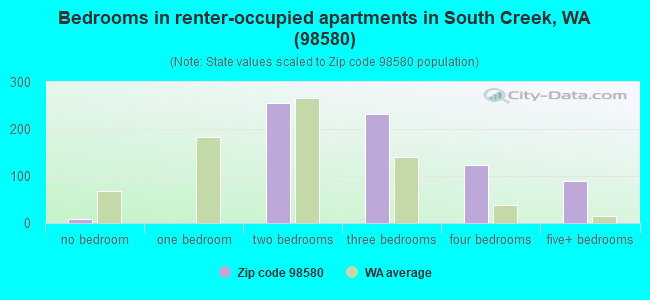


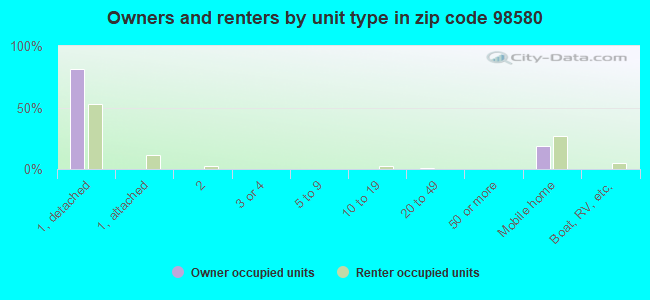


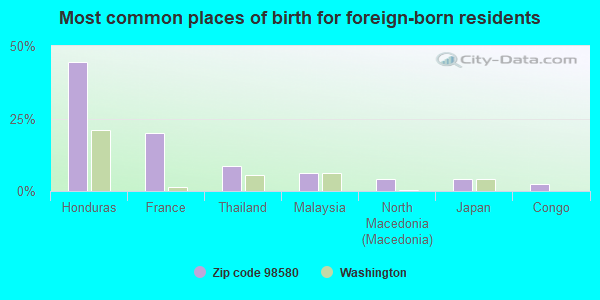
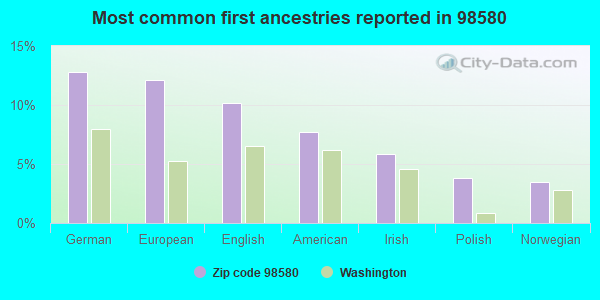
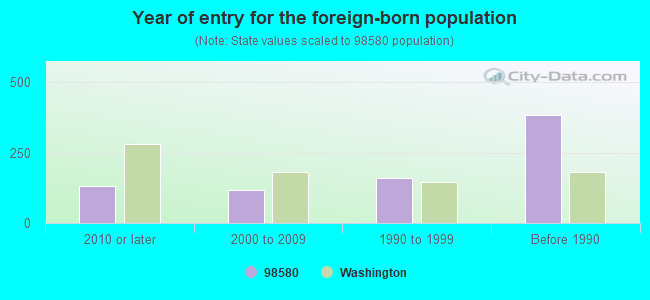
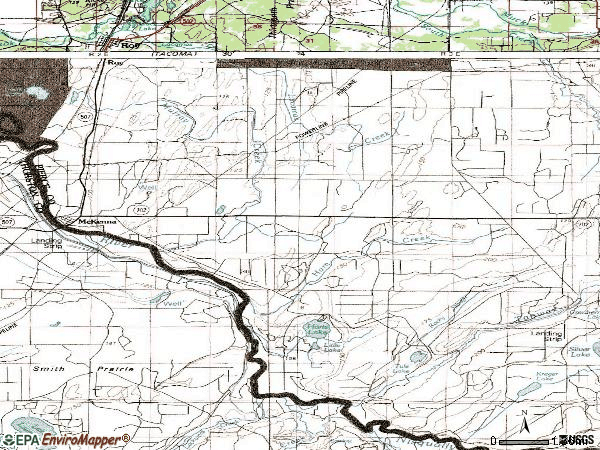


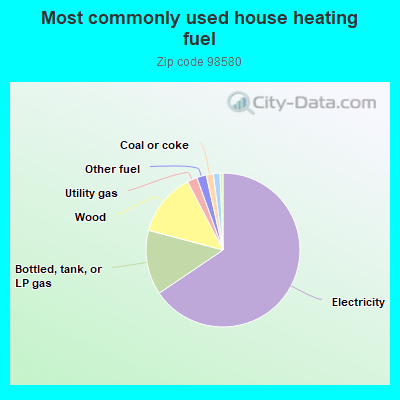
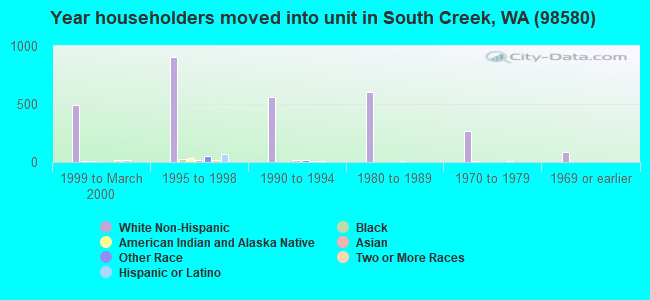

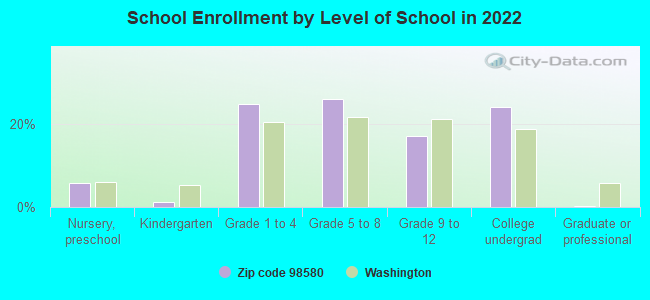

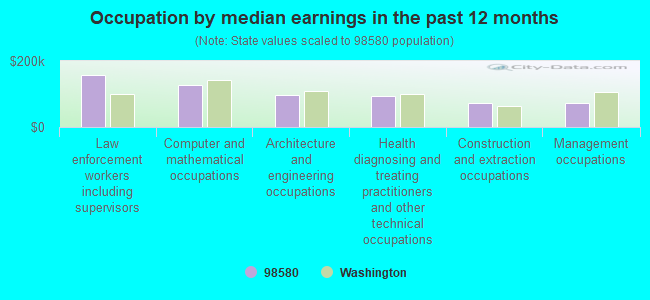
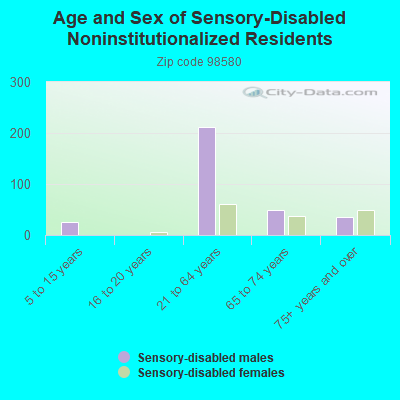
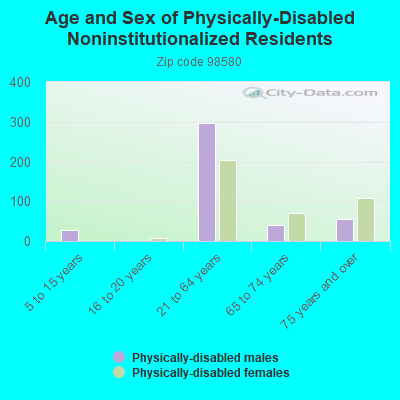
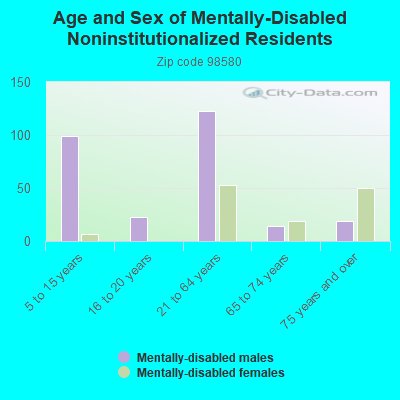
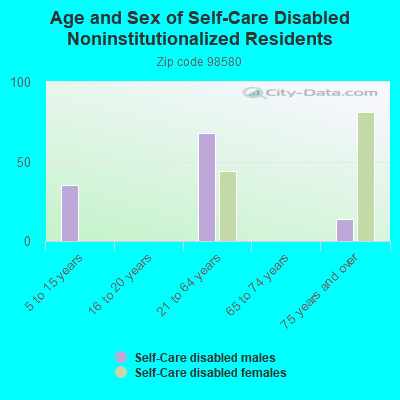

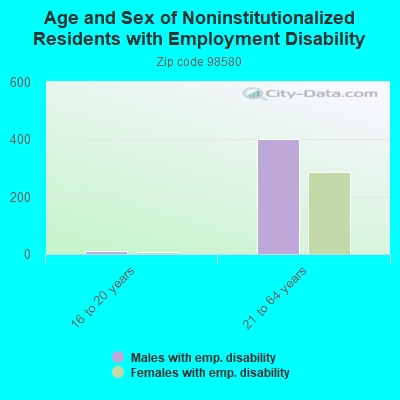
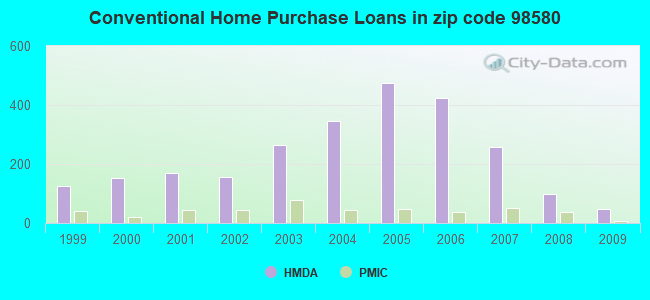
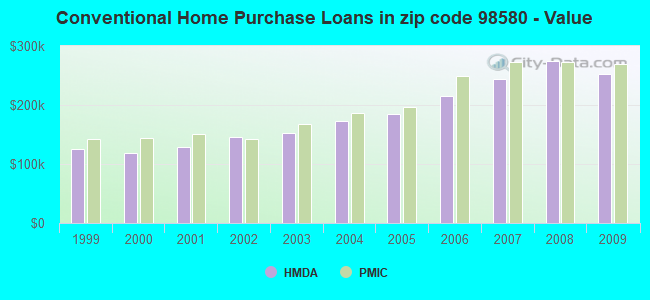
 According to the data from the years 2002 - 2018 the average number of fires per year is 37. The highest number of fires - 139 took place in 2006, and the least - 3 in 2012. The data has an increasing trend.
 When looking into fire subcategories, the most reports belonged to: Structure Fires (45.5%), and Outside Fires (39.3%).