Estimated zip code population in 2022: 2,959 Zip code population in 2010: 2,971 Zip code population in 2000: 3,050
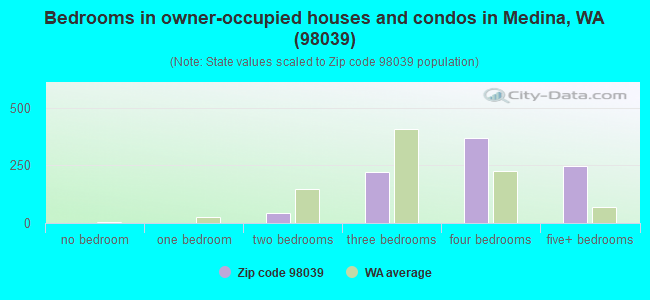
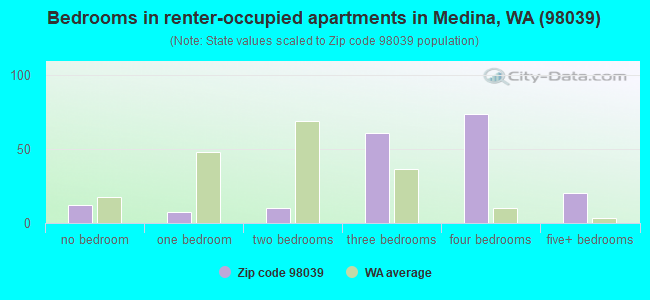
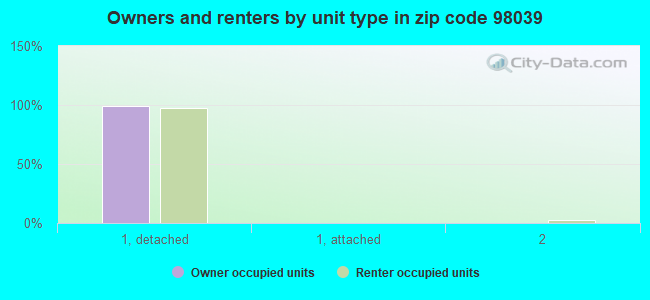
Houses and condos: 1,108 Renter-occupied apartments: 191
% of renters here:
18%
State:
36%
March 2022 cost of living index in zip code 98039: 121.0 (high, U.S. average is 100)
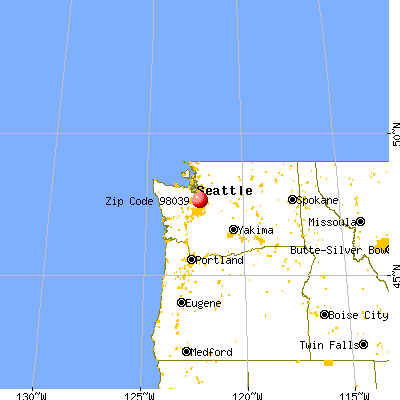
Land area: 1.5 sq. mi. Water area: 4.3 sq. mi.
Population density: 2,040 people per square mile
(low).
OSM Map
General Map
Google Map
MSN Map
OSM Map
General Map
Google Map
MSN Map
OSM Map
General Map
Google Map
MSN Map
OSM Map
General Map
Google Map
MSN Map
Please wait while loading the map...
Real estate property taxes paid for housing units in 2022:
This zip code:
0.4% ($10,301)
Washington:
0.8% ($4,283)
Median real estate property taxes paid for housing units with mortgages in 2022: $10,315 (0.4%) Median real estate property taxes paid for housing units with no mortgage in 2022: $10,314 (0.4%)
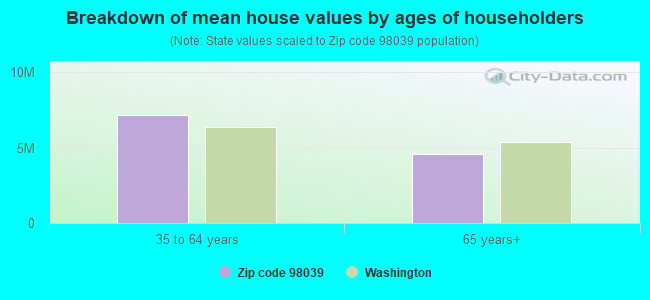
Estimated median house/condo value in 2022: $2,406,000
98039:
$2,406,000
Washington:
$569,500
Median resident age:
This zip code:
47.9 years
Washington median age:
38.4 years
Average household size:
This zip code:
2.8 people
Washington:
2.5 people
Averages for the 2020 tax year for zip code 98039, filed in 2021:
Average Adjusted Gross Income (AGI) in 2020: $1,532,505 (Individual Income Tax Returns)
Here:
$1,532,505
State:
$99,264
Salary/wage: $853,543 (reported on 68.2% of returns)
Here:
$853,543
State:
$80,347
(% of AGI for various income ranges: 1270.8% for AGIs below $25k, 3528.6% for AGIs $25k-50k, 5686.7% for AGIs $50k-75k, 9040.0% for AGIs $75k-100k, 18972.9% for AGIs $100k-200k, 777131.8% for AGIs over 200k)
Taxable interest for individuals: $51,887 (reported on 73.5% of returns)
This zip code:
$51,887
Washington:
$2,077
(% of AGI for various income ranges: 228.3% for AGIs below $25k, 255.7% for AGIs $25k-50k, 283.3% for AGIs $50k-75k, 517.5% for AGIs $75k-100k, 1127.1% for AGIs $100k-200k, 50887.3% for AGIs over 200k)
Ordinary dividends: $248,140 (reported on 71.5% of returns)
Here:
$248,140
State:
$10,013
(% of AGI for various income ranges: 378.3% for AGIs below $25k, 872.9% for AGIs $25k-50k, 1205.0% for AGIs $50k-75k, 1677.5% for AGIs $75k-100k, 4845.7% for AGIs $100k-200k, 238309.1% for AGIs over 200k)
Net capital gain/loss in AGI: +$750,202 (reported on 70.2% of returns)
Here:
+$750,202
State:
+$40,092
(% of AGI for various income ranges: 210.0% for AGIs below $25k, 650.0% for AGIs $25k-50k, 1133.3% for AGIs $50k-75k, 2010.0% for AGIs $75k-100k, 4291.4% for AGIs $100k-200k, 718199.1% for AGIs over 200k)
Profit/loss from business: +$94,397 (reported on 23.2% of returns)
Here:
+$94,397
State:
+$18,312
(% of AGI for various income ranges: 165.0% for AGIs below $25k, 501.4% for AGIs $25k-50k, 1275.0% for AGIs $50k-75k, 2231.4% for AGIs $100k-200k, 27420.9% for AGIs over 200k)
Taxable individual retirement arrangement distribution: $60,967 (reported on 11.9% of returns)
98039:
$60,967
Washington:
$24,221
(% of AGI for various income ranges: 930.0% for AGIs $50k-75k, 2727.1% for AGIs $100k-200k, 7733.6% for AGIs over 200k)
Self-employed (Keogh) retirement plans: $40,786 (reported on 4.6% of returns)
98039:
$40,786
Washington:
$24,166
(% of AGI for various income ranges: 2595.5% for AGIs over 200k)
Total itemized deductions: $220,206 (reported on 43.0% of returns)
Here:
$220,206
State:
$39,068
(% of AGI for various income ranges: 1145.8% for AGIs below $25k, 1753.3% for AGIs $50k-75k, 2097.5% for AGIs $75k-100k, 4621.4% for AGIs $100k-200k, 124211.8% for AGIs over 200k)
Charity contributions: $193,641 (reported on 37.1% of returns)
Here:
$193,641
State:
$15,331
(% of AGI for various income ranges: 78.3% for AGIs below $25k, 191.7% for AGIs $50k-75k, 594.3% for AGIs $100k-200k, 98012.7% for AGIs over 200k)
Taxes paid: $10,345 (reported on 42.4% of returns)
98039:
$10,345
State:
$7,774
(% of AGI for various income ranges: 220.8% for AGIs below $25k, 365.0% for AGIs $50k-75k, 452.5% for AGIs $75k-100k, 921.4% for AGIs $100k-200k, 4828.2% for AGIs over 200k)
Percentage of individuals using paid preparers for their 2020 taxes: 91.4%
Here:
91%
State:
93%
(% for various income ranges: 88.9% for AGIs below $25k, 92.3% for AGIs $25k-50k, 90.0% for AGIs $50k-75k, 88.9% for AGIs $75k-100k, 85.0% for AGIs $100k-200k, 94.4% for AGIs over 200k)
Averages for the 2012 tax year for zip code 98039, filed in 2013:
Average Adjusted Gross Income (AGI) in 2012: $625,056 (Individual Income Tax Returns)
Here:
$625,056
State:
$69,533
Salary/wage: $320,263 (reported on 65.1% of returns)
Here:
$320,263
State:
$57,267
(% of AGI for various income ranges: 70.2% for AGIs below $25k, 53.6% for AGIs $25k-50k, 53.6% for AGIs $50k-75k, 42.4% for AGIs $75k-100k, 46.8% for AGIs $100k-200k, 32.3% for AGIs over 200k)
Taxable interest for individuals: $27,924 (reported on 71.8% of returns)
This zip code:
$27,924
Washington:
$1,816
(% of AGI for various income ranges: 8.3% for AGIs below $25k, 5.7% for AGIs $25k-50k, 3.5% for AGIs $50k-75k, 3.7% for AGIs $75k-100k, 2.8% for AGIs $100k-200k, 3.2% for AGIs over 200k)
Ordinary dividends: $151,219 (reported on 71.1% of returns)
Here:
$151,219
State:
$8,163
(% of AGI for various income ranges: 33.8% for AGIs below $25k, 20.7% for AGIs $25k-50k, 9.0% for AGIs $50k-75k, 14.5% for AGIs $75k-100k, 9.0% for AGIs $100k-200k, 17.6% for AGIs over 200k)
Net capital gain/loss in AGI: +$255,084 (reported on 67.1% of returns)
Here:
+$255,084
State:
+$21,568
(% of AGI for various income ranges: 5.5% for AGIs below $25k, 3.9% for AGIs $25k-50k, 1.6% for AGIs $50k-75k, 2.7% for AGIs $75k-100k, 4.1% for AGIs $100k-200k, 29.0% for AGIs over 200k)
Profit/loss from business: +$103,891 (reported on 22.8% of returns)
Here:
+$103,891
State:
+$16,521
(% of AGI for various income ranges: 5.7% for AGIs below $25k, 17.4% for AGIs $25k-50k, 7.5% for AGIs $75k-100k, 8.7% for AGIs $100k-200k, 3.5% for AGIs over 200k)
Taxable individual retirement arrangement distribution: $72,857 (reported on 20.1% of returns)
98039:
$72,857
Washington:
$18,648
(% of AGI for various income ranges: 9.0% for AGIs below $25k, 7.4% for AGIs $50k-75k, 6.3% for AGIs $75k-100k, 8.3% for AGIs $100k-200k, 2.0% for AGIs over 200k)
Self-employment retirement plans: $31,612 (reported on 5.4% of returns)
98039:
$31,612
Washington:
$20,087
(% of AGI for various income ranges: 0.3% for AGIs over 200k)
Total itemized deductions: $110,177 (12% of AGI, reported on 63.1% of returns)
Here:
$110,177
State:
$23,872
Here:
11.5% of AGI
State:
18.2% of AGI
(% of AGI for various income ranges: 36.0% for AGIs below $25k, 40.0% for AGIs $25k-50k, 21.9% for AGIs $50k-75k, 30.5% for AGIs $75k-100k, 24.4% for AGIs $100k-200k, 10.1% for AGIs over 200k)
Charity contributions: $45,713 (reported on 56.4% of returns)
Here:
$45,713
State:
$4,465
(% of AGI for various income ranges: 1.8% for AGIs below $25k, 2.9% for AGIs $25k-50k, 2.2% for AGIs $50k-75k, 3.2% for AGIs $75k-100k, 3.2% for AGIs $100k-200k, 4.2% for AGIs over 200k)
Taxes paid: $26,792 (reported on 61.7% of returns)
98039:
$26,792
State:
$6,400
(% of AGI for various income ranges: 10.4% for AGIs below $25k, 11.8% for AGIs $25k-50k, 7.9% for AGIs $50k-75k, 10.4% for AGIs $75k-100k, 8.2% for AGIs $100k-200k, 2.2% for AGIs over 200k)
Earned income credit: $1,067 (reported on 2.0% of returns)
Here:
$1,067
State:
$2,073
(% of AGI for various income ranges: 1.0% for AGIs below $25k)
Percentage of individuals using paid preparers for their 2012 taxes: 70.5%
Here:
70%
State:
43%
(% for various income ranges: 61.1% for AGIs below $25k, 53.8% for AGIs $25k-50k, 60.0% for AGIs $50k-75k, 66.7% for AGIs $75k-100k, 70.8% for AGIs $100k-200k, 82.5% for AGIs over 200k)
Averages for the 2004 tax year for zip code 98039, filed in 2005:
Average Adjusted Gross Income (AGI) in 2004: $561,909 (Individual Income Tax Returns)
Here:
$561,909
State:
$54,331
Salary/wage: $261,630 (reported on 64.2% of returns)
Here:
$261,630
State:
$45,761
(% of AGI for various income ranges: 46.8% for AGIs $10k-25k, 48.6% for AGIs $25k-50k, 38.6% for AGIs $50k-75k, 39.0% for AGIs $75k-100k, 29.0% for AGIs over 100k)
Taxable interest for individuals: $26,728 (reported on 78.1% of returns)
This zip code:
$26,728
Washington:
$2,110
(% of AGI for various income ranges: 7.8% for AGIs $10k-25k, 6.4% for AGIs $25k-50k, 5.6% for AGIs $50k-75k, 6.4% for AGIs $75k-100k, 3.5% for AGIs over 100k)
Taxable dividends: $126,306 (reported on 78.2% of returns)
Here:
$126,306
State:
$5,879
(% of AGI for various income ranges: 16.0% for AGIs $10k-25k, 13.3% for AGIs $25k-50k, 12.1% for AGIs $50k-75k, 11.5% for AGIs $75k-100k, 17.5% for AGIs over 100k)
Net capital gain/loss: +$265,388 (reported on 71.4% of returns)
Here:
+$265,388
State:
+$15,835
(% of AGI for various income ranges: 5.3% for AGIs $10k-25k, 4.8% for AGIs $25k-50k, 3.7% for AGIs $50k-75k, 6.0% for AGIs $75k-100k, 34.2% for AGIs over 100k)
Profit/loss from business: +$76,791 (reported on 20.6% of returns)
Here:
+$76,791
State:
+$13,994
(% of AGI for various income ranges: 7.4% for AGIs $10k-25k, 7.7% for AGIs $25k-50k, 6.3% for AGIs $50k-75k, 10.7% for AGIs $75k-100k, 2.6% for AGIs over 100k)
IRA payment deduction: $4,109 (reported on 3.1% of returns)
98039:
$4,109
Washington:
$3,001
(% of AGI for various income ranges: 0.7% for AGIs $50k-75k, 0.0% for AGIs over 100k)
Self-employed pension: $20,417 (reported on 5.7% of returns)
Here:
$20,417
Washington:
$14,244
Total itemized deductions: $99,875 (12% of AGI, reported on 62.3% of returns)
Here:
$99,875
State:
$19,669
Here:
11.6% of AGI
State:
20.7% of AGI
(% of AGI for various income ranges: 32.9% for AGIs $10k-25k, 28.8% for AGIs $25k-50k, 26.9% for AGIs $50k-75k, 29.3% for AGIs $75k-100k, 10.4% for AGIs over 100k)
Charity contributions deductions: $55,669 (6% of AGI, reported on 58.8% of returns)
Here:
$55,669
State:
$3,569
Here:
6.2% of AGI
State:
3.5% of AGI
(% of AGI for various income ranges: 2.5% for AGIs $10k-25k, 3.2% for AGIs $25k-50k, 4.1% for AGIs $50k-75k, 4.4% for AGIs $75k-100k, 5.8% for AGIs over 100k)
Total tax: $135,744 (reported on 85.6% of returns)
98039:
$135,744
State:
$9,065
(% of AGI for various income ranges: 5.3% for AGIs $10k-25k, 7.7% for AGIs $25k-50k, 10.3% for AGIs $50k-75k, 9.8% for AGIs $75k-100k, 20.8% for AGIs over 100k)
Earned income credit: $1,533 (reported on 1.0% of returns)
Here:
$1,533
State:
$1,607
Percentage of individuals using paid preparers for their 2004 taxes: 70.1%
Here:
70%
State:
49%
(% for various income ranges: 64.7% for AGIs below $10k, 47.8% for AGIs $10k-25k, 65.1% for AGIs $25k-50k, 62.2% for AGIs $50k-75k, 67.0% for AGIs $75k-100k, 79.5% for AGIs over 100k)
Household received Food Stamps/SNAP in the past 12 months: 0 Household did not receive Food Stamps/SNAP in the past 12 months: 1,059
Women who had a birth in the past 12 months: 5 (6 now married, 0 unmarried) Women who did not have a birth in the past 12 months: 661 (341 now married, 319 unmarried)
Housing units in zip code 98039 with a mortgage: 447 (82 second mortgage, 13 home equity loan, 64 both second mortgage and home equity loan) Median monthly owner costs for units with a mortgage: $3,961 Median monthly owner costs for units without a mortgage: $1,511
Residents with income below the poverty level in 2022:
This zip code:
2.8%
Whole state:
10.0%
Residents with income below 50% of the poverty level in 2022:
This zip code:
1.0%
Whole state:
4.6%
Median number of rooms in houses and condos:
Here:
10.0
State:
6.5
Median number of rooms in apartments:
Here:
7.1
State:
3.9
Notable locations in this zip code not listed on our city pages
Notable locations in zip code 98039: Evergreen Point Bridge Park and Ride (A), Overlake Golf and Country Club (B), Medina City Hall (C). Display/hide their locations on the map
Size of family households: 324 2-persons, 159 3-persons, 253 4-persons, 111 5-persons, 15 6-persons
Size of nonfamily households: 157 1-person, 25 2-persons
690 married couples with children.
54 single-parent households (41 men, 13 women).
71.5% of residents of 98039 zip code speak English at home.
0.6% of residents speak Spanish at home (100% very well).
6.7% of residents speak other Indo-European language at home (87% very well, 9% well, 4% not well).
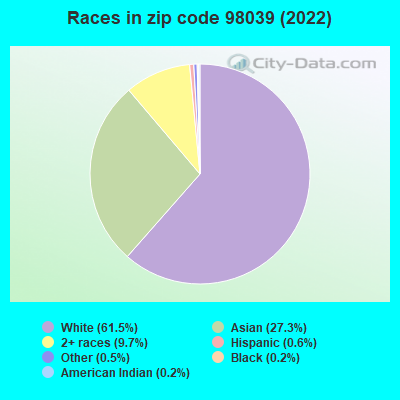
22.3% of residents speak Asian or Pacific Island language at home (64% very well, 19% well, 12% not well, 6% not at all).
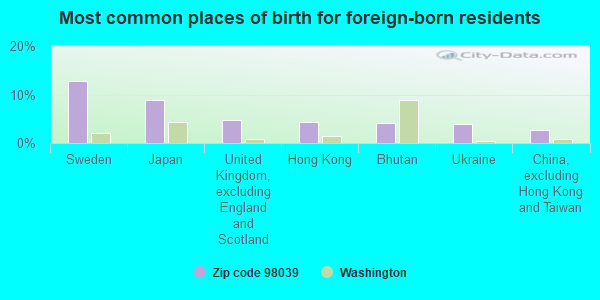
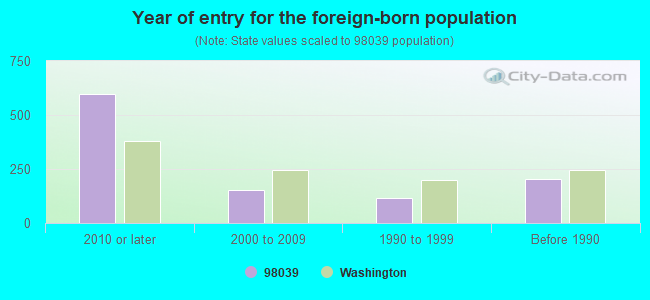
Foreign born population: 882 (29.8%) (55.7% of them are naturalized citizens)
This zip code:
29.8%
Whole state:
15.3%
13%Sweden
9%Japan
5%United Kingdom, excluding England and Scotland
4%Hong Kong
4%Bhutan
4%Ukraine
3%China, excluding Hong Kong and Taiwan
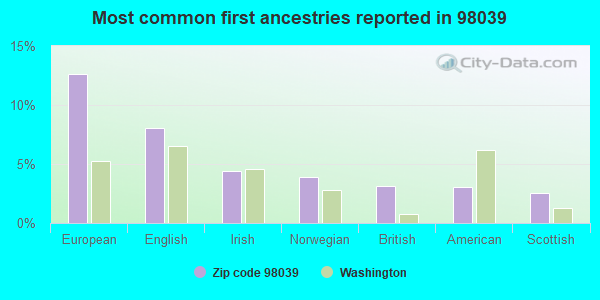
13%European
8%English
4%Irish
4%Norwegian
3%British
3%American
3%Scottish
Year of entry for the foreign-born population
5972010 or later
1552000 to 2009
1151990 to 1999
202Before 1990
Housing units lacking complete plumbing facilities: 1.5% Housing units lacking complete kitchen facilities: 2.1%
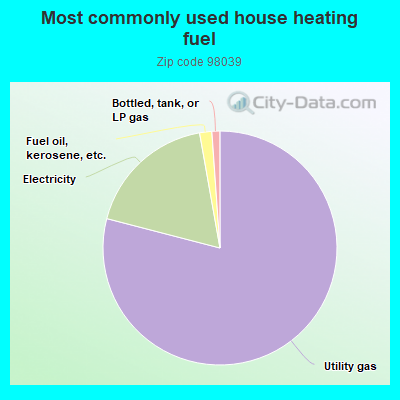
79.2%Utility gas
18.2%Electricity
1.7%Fuel oil, kerosene, etc.
1.1%Bottled, tank, or LP gas
Place of birth for U.S.-born residents:
This state: 940
Northeast: 238
Midwest: 321
South: 154
West: 297
66% of the 98039 zip code residents lived in the same house 5 years ago. Out of people who lived in different houses, 66% lived in this county. Out of people who lived in different counties, 50% lived in Washington.
89% of the 98039 zip code residents lived in the same house 1 year ago. Out of people who lived in different houses, 60% moved from this county. Out of people who lived in different houses, 20% moved from different state. Out of people who lived in different houses, 23% moved from abroad.
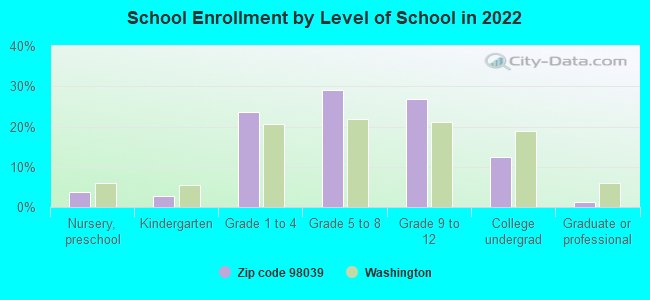
Private vs. public school enrollment:
Students in private schools in grades 1 to 8 (elementary and middle school): 166
Here:
37.0%
Washington:
12.4%
Students in private schools in grades 9 to 12 (high school): 82
Here:
35.2%
Washington:
9.2%
Students in private undergraduate colleges: 72
Here:
69.4%
Washington:
16.5%
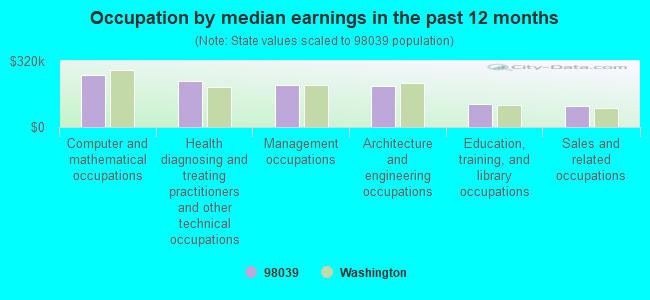
Occupation by median earnings in the past 12 months ($)
250,386Computer and mathematical occupations
220,633Health diagnosing and treating practitioners and other technical occupations
205,136Management occupations
199,085Architecture and engineering occupations
111,273Education, training, and library occupations
100,046Sales and related occupations
Companies with federal contracts located in this zip code:
PATHFINDER INC (2420 82ND AVE N E in MEDINA, WA; small business) : $59,770 in 2 contractsin 2004
$29,885 with Navy for Technical Representation Services -- Materials Handling Equipment. Signed on 2004-09-29. Completion date: 2004-11-30.
$29,885, same as above.Signed on 2004-09-29. Completion date: 2004-11-30.
Top industries in this zip code by the number of employees in 2005:
Other Services (except Public Administration): Religious Organizations (10-19 employees: 1 establishment)
Health Care and Social Assistance: Child Day Care Services (10-19: 1)
Real Estate and Rental and Leasing: Offices of Real Estate Agents and Brokers (1-4: 4)
Real Estate and Rental and Leasing: Nonresidential Property Managers (5-9: 1)
Real Estate and Rental and Leasing: Residential Property Managers (5-9: 1)
Real Estate and Rental and Leasing: Other Activities Related to Real Estate (1-4: 3)
Professional, Scientific, and Technical Services: Advertising Agencies (1-4: 2)
Professional, Scientific, and Technical Services: Public Relations Agencies (1-4: 2)
Home Mortgage Disclosure Act Aggregated Statistics For Year 2009 (Based on 2 partial tracts)
B) Conventional Home Purchase Loans
C) Refinancings
D) Home Improvement Loans
F) Non-occupant Loans on < 5 Family Dwellings (A B C & D)
Number
Average Value
Number
Average Value
Number
Average Value
Number
Average Value
LOANS ORIGINATED
11
$819,915
60
$650,474
1
$303,670
1
$909,510
APPLICATIONS APPROVED, NOT ACCEPTED
2
$801,415
4
$801,785
0
$0
0
$0
APPLICATIONS DENIED
3
$1,116,923
14
$894,494
1
$2,046,650
0
$0
APPLICATIONS WITHDRAWN
2
$1,013,880
7
$1,221,769
1
$198,800
0
$0
FILES CLOSED FOR INCOMPLETENESS
0
$0
2
$860,305
0
$0
0
$0
Aggregated Statistics For Year 2008 (Based on 2 partial tracts)
B) Conventional Home Purchase Loans
C) Refinancings
D) Home Improvement Loans
F) Non-occupant Loans on < 5 Family Dwellings (A B C & D)
Number
Average Value
Number
Average Value
Number
Average Value
Number
Average Value
LOANS ORIGINATED
12
$1,094,436
23
$1,047,200
1
$1,565,550
1
$803,650
APPLICATIONS APPROVED, NOT ACCEPTED
2
$789,235
2
$720,900
0
$0
0
$0
APPLICATIONS DENIED
4
$2,379,760
9
$1,073,962
1
$1,366,750
0
$0
APPLICATIONS WITHDRAWN
2
$1,323,265
3
$1,575,657
0
$0
0
$0
FILES CLOSED FOR INCOMPLETENESS
1
$2,811,030
1
$2,773,260
0
$0
0
$0
Aggregated Statistics For Year 2007 (Based on 2 partial tracts)
B) Conventional Home Purchase Loans
C) Refinancings
D) Home Improvement Loans
F) Non-occupant Loans on < 5 Family Dwellings (A B C & D)
Number
Average Value
Number
Average Value
Number
Average Value
Number
Average Value
LOANS ORIGINATED
25
$1,334,346
36
$903,739
4
$1,164,595
3
$694,973
APPLICATIONS APPROVED, NOT ACCEPTED
5
$1,466,946
4
$1,132,788
1
$385,180
0
$0
APPLICATIONS DENIED
4
$1,818,772
9
$1,632,756
0
$0
1
$1,023,820
APPLICATIONS WITHDRAWN
2
$1,539,460
3
$2,020,637
0
$0
0
$0
FILES CLOSED FOR INCOMPLETENESS
0
$0
1
$1,412,470
0
$0
0
$0
Aggregated Statistics For Year 2006 (Based on 2 partial tracts)
B) Conventional Home Purchase Loans
C) Refinancings
D) Home Improvement Loans
F) Non-occupant Loans on < 5 Family Dwellings (A B C & D)
Number
Average Value
Number
Average Value
Number
Average Value
Number
Average Value
LOANS ORIGINATED
30
$1,012,903
37
$1,085,367
4
$1,236,412
7
$1,250,523
APPLICATIONS APPROVED, NOT ACCEPTED
5
$1,399,452
5
$677,412
0
$0
1
$1,133,160
APPLICATIONS DENIED
8
$893,916
6
$1,660,808
2
$1,156,270
1
$1,739,500
APPLICATIONS WITHDRAWN
8
$864,656
5
$824,026
0
$0
2
$696,545
FILES CLOSED FOR INCOMPLETENESS
1
$888,140
1
$420,960
0
$0
0
$0
Aggregated Statistics For Year 2005 (Based on 2 partial tracts)
B) Conventional Home Purchase Loans
C) Refinancings
D) Home Improvement Loans
F) Non-occupant Loans on < 5 Family Dwellings (A B C & D)
Number
Average Value
Number
Average Value
Number
Average Value
Number
Average Value
LOANS ORIGINATED
32
$967,923
46
$773,591
3
$849,703
4
$1,010,278
APPLICATIONS APPROVED, NOT ACCEPTED
4
$913,735
4
$1,723,970
0
$0
0
$0
APPLICATIONS DENIED
8
$769,605
9
$1,113,280
0
$0
1
$538,750
APPLICATIONS WITHDRAWN
2
$757,430
5
$831,182
1
$1,018,850
1
$715,680
FILES CLOSED FOR INCOMPLETENESS
1
$1,151,050
1
$777,810
0
$0
0
$0
Aggregated Statistics For Year 2004 (Based on 2 partial tracts)
B) Conventional Home Purchase Loans
C) Refinancings
D) Home Improvement Loans
F) Non-occupant Loans on < 5 Family Dwellings (A B C & D)
Number
Average Value
Number
Average Value
Number
Average Value
Number
Average Value
LOANS ORIGINATED
35
$830,075
62
$664,858
2
$250,735
6
$648,005
APPLICATIONS APPROVED, NOT ACCEPTED
3
$1,451,903
7
$573,396
1
$168,480
0
$0
APPLICATIONS DENIED
7
$820,973
12
$725,454
1
$341,940
1
$1,214,170
APPLICATIONS WITHDRAWN
6
$834,463
5
$613,198
0
$0
0
$0
FILES CLOSED FOR INCOMPLETENESS
1
$150,590
2
$1,771,805
0
$0
0
$0
Aggregated Statistics For Year 2003 (Based on 2 partial tracts)
B) Conventional Home Purchase Loans
C) Refinancings
D) Home Improvement Loans
F) Non-occupant Loans on < 5 Family Dwellings (A B C & D)
Number
Average Value
Number
Average Value
Number
Average Value
Number
Average Value
LOANS ORIGINATED
32
$630,584
160
$576,048
2
$132,450
5
$376,528
APPLICATIONS APPROVED, NOT ACCEPTED
3
$845,067
12
$455,252
1
$51,690
1
$246,020
APPLICATIONS DENIED
7
$521,709
21
$683,399
0
$0
3
$580,497
APPLICATIONS WITHDRAWN
6
$441,337
13
$410,140
1
$431,890
1
$397,100
FILES CLOSED FOR INCOMPLETENESS
1
$670,950
4
$598,140
0
$0
0
$0
Aggregated Statistics For Year 2002 (Based on 2 partial tracts)
B) Conventional Home Purchase Loans
C) Refinancings
F) Non-occupant Loans on < 5 Family Dwellings (A B C & D)
Number
Average Value
Number
Average Value
Number
Average Value
LOANS ORIGINATED
27
$582,999
127
$598,196
4
$480,722
APPLICATIONS APPROVED, NOT ACCEPTED
3
$760,907
14
$509,674
0
$0
APPLICATIONS DENIED
2
$709,470
10
$590,188
0
$0
APPLICATIONS WITHDRAWN
1
$844,900
12
$577,307
0
$0
FILES CLOSED FOR INCOMPLETENESS
0
$0
3
$1,215,330
0
$0
Aggregated Statistics For Year 2001 (Based on 2 partial tracts)
B) Conventional Home Purchase Loans
C) Refinancings
D) Home Improvement Loans
F) Non-occupant Loans on < 5 Family Dwellings (A B C & D)
Number
Average Value
Number
Average Value
Number
Average Value
Number
Average Value
LOANS ORIGINATED
22
$504,658
87
$563,107
2
$76,040
4
$385,422
APPLICATIONS APPROVED, NOT ACCEPTED
4
$725,000
9
$642,069
0
$0
0
$0
APPLICATIONS DENIED
5
$588,746
10
$654,002
0
$0
0
$0
APPLICATIONS WITHDRAWN
3
$518,040
7
$1,089,496
0
$0
0
$0
FILES CLOSED FOR INCOMPLETENESS
0
$0
1
$1,430,370
0
$0
0
$0
Aggregated Statistics For Year 2000 (Based on 2 partial tracts)
B) Conventional Home Purchase Loans
C) Refinancings
D) Home Improvement Loans
F) Non-occupant Loans on < 5 Family Dwellings (A B C & D)
Number
Average Value
Number
Average Value
Number
Average Value
Number
Average Value
LOANS ORIGINATED
25
$625,425
23
$543,027
9
$108,180
2
$522,845
APPLICATIONS APPROVED, NOT ACCEPTED
3
$916,967
3
$1,307,773
1
$24,850
0
$0
APPLICATIONS DENIED
3
$467,677
5
$327,126
1
$149,100
0
$0
APPLICATIONS WITHDRAWN
1
$1,068,550
2
$314,850
1
$92,940
0
$0
FILES CLOSED FOR INCOMPLETENESS
0
$0
2
$277,080
0
$0
0
$0
Aggregated Statistics For Year 1999 (Based on 1 partial tract)
B) Conventional Home Purchase Loans
C) Refinancings
D) Home Improvement Loans
F) Non-occupant Loans on < 5 Family Dwellings (A B C & D)


 Nearest zip codes: 98004, 98112, 98105, 98122, 98040, 98033.


 : $59,770 in 2 contracts in 2004