Estimated zip code population in 2022: 5,341 Zip code population in 2010: 4,969 Zip code population in 2000: 4,242
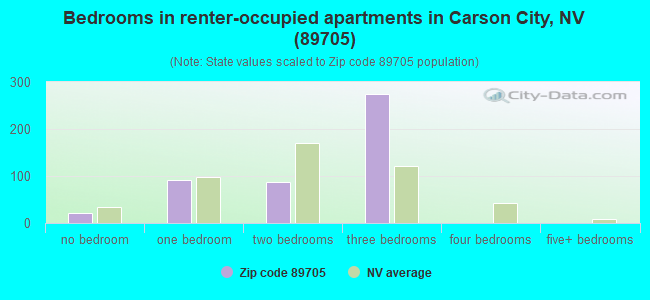
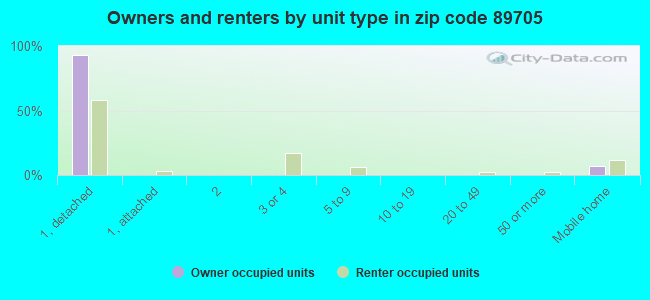
Houses and condos: 2,357 Renter-occupied apartments: 485
% of renters here:
21%
State:
40%
March 2022 cost of living index in zip code 89705: 94.1 (less than average, U.S. average is 100)
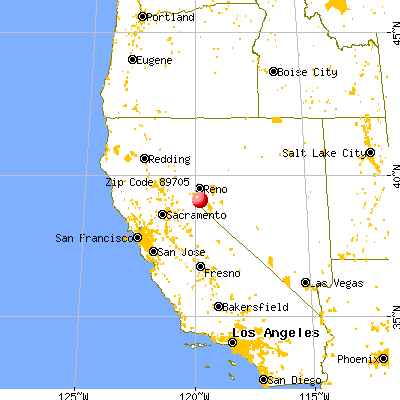
Land area: 43.2 sq. mi. Water area: 0.6 sq. mi.
Population density: 124 people per square mile
(very low).
OSM Map
General Map
Google Map
MSN Map
OSM Map
General Map
Google Map
MSN Map
OSM Map
General Map
Google Map
MSN Map
OSM Map
General Map
Google Map
MSN Map
Please wait while loading the map...
Real estate property taxes paid for housing units in 2022:
This zip code:
0.5% ($2,264)
Nevada:
0.4% ($1,889)
Median real estate property taxes paid for housing units with mortgages in 2022: $2,188 (0.5%) Median real estate property taxes paid for housing units with no mortgage in 2022: $2,437 (0.4%)
Business Search- 14 Million verified businesses
Males: 2,542
(47.6%)
Females: 2,800
(52.4%)
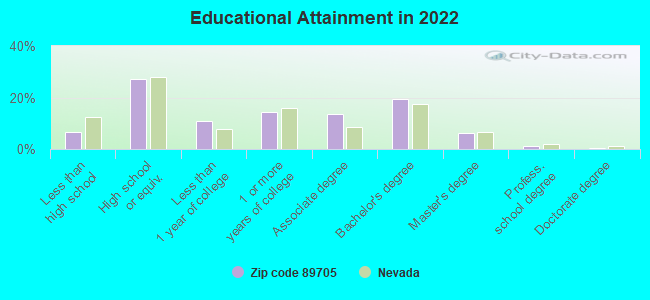
For population 25 years and over in 89705:
High school or higher: 93.1%
Bachelor's degree or higher: 27.1%
Graduate or professional degree: 7.8%
Unemployed: 2.4%
Mean travel time to work (commute): 20.6 minutes
For population 15 years and over in 89705:
Never married: 20.2%
Now married: 60.1%
Separated: 0.2%
Widowed: 5.9%
Divorced: 13.6%
Zip code 89705 compared to state average:
Unemployed percentage below state average.
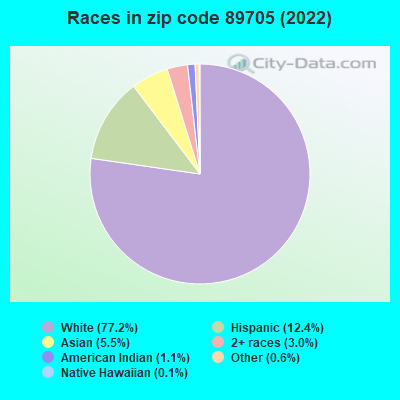
Black race population percentage significantly below state average.
Hispanic race population percentage below state average.
Median age significantly above state average.
Foreign-born population percentage below state average.
Renting percentage below state average.
Length of stay since moving in significantly above state average.
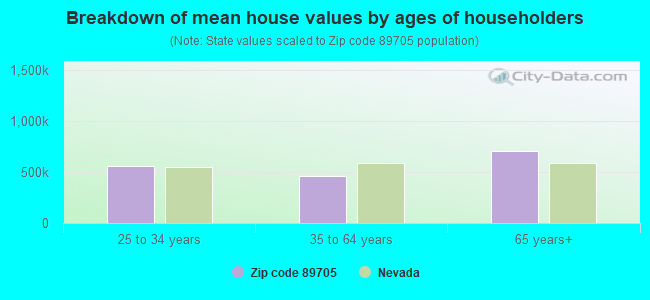
Estimated median house/condo value in 2022: $490,520
89705:
$490,520
Nevada:
$434,700
According to our research of Nevada and other state lists, there were 12 registered sex offenders living in 89705 zip code as of June 05, 2024. The ratio of all residents to sex offenders in zip code 89705 is 484 to 1. The ratio of registered sex offenders to all residents in this zip code is lower than the state average.
Median resident age:
This zip code:
49.0 years
Nevada median age:
39.0 years
Average household size:
This zip code:
2.3 people
Nevada:
2.6 people
Averages for the 2020 tax year for zip code 89705, filed in 2021:
Average Adjusted Gross Income (AGI) in 2020: $96,620 (Individual Income Tax Returns)
Here:
$96,620
State:
$78,964
Salary/wage: $67,531 (reported on 76.7% of returns)
Here:
$67,531
State:
$54,472
(% of AGI for various income ranges: 1255.5% for AGIs below $25k, 3496.5% for AGIs $25k-50k, 6082.3% for AGIs $50k-75k, 9037.3% for AGIs $75k-100k, 15562.5% for AGIs $100k-200k, 214945.0% for AGIs over 200k)
Taxable interest for individuals: $3,702 (reported on 30.7% of returns)
This zip code:
$3,702
Nevada:
$3,521
(% of AGI for various income ranges: 12.7% for AGIs below $25k, 9.8% for AGIs $25k-50k, 57.7% for AGIs $50k-75k, 57.7% for AGIs $75k-100k, 150.4% for AGIs $100k-200k, 12080.0% for AGIs over 200k)
Ordinary dividends: $13,223 (reported on 18.4% of returns)
Here:
$13,223
State:
$13,390
(% of AGI for various income ranges: 27.1% for AGIs below $25k, 57.8% for AGIs $25k-50k, 92.6% for AGIs $50k-75k, 154.5% for AGIs $75k-100k, 393.3% for AGIs $100k-200k, 24115.0% for AGIs over 200k)
Net capital gain/loss in AGI: +$90,579 (reported on 18.7% of returns)
Here:
+$90,579
State:
+$63,025
(% of AGI for various income ranges: 31.3% for AGIs $25k-50k, 107.7% for AGIs $50k-75k, 97.3% for AGIs $75k-100k, 715.8% for AGIs $100k-200k, 227685.0% for AGIs over 200k)
Profit/loss from business: +$11,544 (reported on 13.8% of returns)
Here:
+$11,544
State:
+$11,500
(% of AGI for various income ranges: 112.4% for AGIs below $25k, 168.1% for AGIs $25k-50k, 104.3% for AGIs $50k-75k, 268.2% for AGIs $75k-100k, 485.4% for AGIs $100k-200k, 4615.0% for AGIs over 200k)
Taxable individual retirement arrangement distribution: $22,621 (reported on 9.9% of returns)
89705:
$22,621
Nevada:
$23,628
(% of AGI for various income ranges: 64.1% for AGIs below $25k, 146.1% for AGIs $25k-50k, 242.9% for AGIs $50k-75k, 377.7% for AGIs $75k-100k, 973.3% for AGIs $100k-200k, 6070.0% for AGIs over 200k)
Total itemized deductions: $35,123 (reported on 9.2% of returns)
Here:
$35,123
State:
$44,173
(% of AGI for various income ranges: 83.7% for AGIs below $25k, 146.3% for AGIs $25k-50k, 369.4% for AGIs $50k-75k, 510.5% for AGIs $75k-100k, 936.7% for AGIs $100k-200k, 16340.0% for AGIs over 200k)
Charity contributions: $11,430 (reported on 7.1% of returns)
Here:
$11,430
State:
$12,589
(% of AGI for various income ranges: 11.1% for AGIs $25k-50k, 41.1% for AGIs $50k-75k, 63.6% for AGIs $75k-100k, 156.2% for AGIs $100k-200k, 7835.0% for AGIs over 200k)
Taxes paid: $5,785 (reported on 9.2% of returns)
89705:
$5,785
State:
$6,112
(% of AGI for various income ranges: 29.3% for AGIs $25k-50k, 65.1% for AGIs $50k-75k, 103.2% for AGIs $75k-100k, 176.7% for AGIs $100k-200k, 2335.0% for AGIs over 200k)
Earned income credit: $1,945 (reported on 11.0% of returns)
Here:
$1,945
State:
$2,214
(% of AGI for various income ranges: 69.6% for AGIs below $25k, 48.5% for AGIs $25k-50k)
Percentage of individuals using paid preparers for their 2020 taxes: 92.2%
Here:
92%
State:
93%
(% for various income ranges: 91.7% for AGIs below $25k, 91.7% for AGIs $25k-50k, 94.0% for AGIs $50k-75k, 91.4% for AGIs $75k-100k, 93.0% for AGIs $100k-200k, 90.9% for AGIs over 200k)
Averages for the 2012 tax year for zip code 89705, filed in 2013:
Average Adjusted Gross Income (AGI) in 2012: $52,974 (Individual Income Tax Returns)
Here:
$52,974
State:
$61,164
Salary/wage: $43,024 (reported on 79.3% of returns)
Here:
$43,024
State:
$45,924
(% of AGI for various income ranges: 69.2% for AGIs below $25k, 73.6% for AGIs $25k-50k, 71.5% for AGIs $50k-75k, 67.8% for AGIs $75k-100k, 63.8% for AGIs $100k-200k, 36.1% for AGIs over 200k)
Taxable interest for individuals: $1,247 (reported on 32.1% of returns)
This zip code:
$1,247
Nevada:
$3,137
(% of AGI for various income ranges: 1.1% for AGIs below $25k, 0.9% for AGIs $25k-50k, 0.7% for AGIs $50k-75k, 0.6% for AGIs $75k-100k, 0.8% for AGIs $100k-200k, 0.6% for AGIs over 200k)
Ordinary dividends: $8,847 (reported on 18.3% of returns)
Here:
$8,847
State:
$11,762
(% of AGI for various income ranges: 3.1% for AGIs below $25k, 2.3% for AGIs $25k-50k, 2.3% for AGIs $50k-75k, 1.0% for AGIs $75k-100k, 1.9% for AGIs $100k-200k, 9.4% for AGIs over 200k)
Net capital gain/loss in AGI: +$3,735 (reported on 15.0% of returns)
Here:
+$3,735
State:
+$33,127
(% of AGI for various income ranges: 2.5% for AGIs $25k-50k, 0.2% for AGIs $50k-75k, 0.2% for AGIs $75k-100k, 2.6% for AGIs $100k-200k, 3.2% for AGIs over 200k)
Profit/loss from business: +$9,524 (reported on 13.4% of returns)
Here:
+$9,524
State:
+$12,567
(% of AGI for various income ranges: 5.6% for AGIs below $25k, 1.6% for AGIs $25k-50k, 2.4% for AGIs $50k-75k, 1.6% for AGIs $75k-100k, 3.9% for AGIs $100k-200k)
Taxable individual retirement arrangement distribution: $16,021 (reported on 11.4% of returns)
89705:
$16,021
Nevada:
$20,808
(% of AGI for various income ranges: 3.1% for AGIs below $25k, 2.4% for AGIs $25k-50k, 3.3% for AGIs $50k-75k, 3.1% for AGIs $75k-100k, 6.9% for AGIs $100k-200k)
Total itemized deductions: $20,575 (24% of AGI, reported on 31.3% of returns)
Here:
$20,575
State:
$26,148
Here:
24.5% of AGI
State:
20.0% of AGI
(% of AGI for various income ranges: 10.9% for AGIs below $25k, 9.4% for AGIs $25k-50k, 12.4% for AGIs $50k-75k, 13.2% for AGIs $75k-100k, 14.4% for AGIs $100k-200k, 11.2% for AGIs over 200k)
Charity contributions: $3,127 (reported on 24.0% of returns)
Here:
$3,127
State:
$4,329
(% of AGI for various income ranges: 0.6% for AGIs below $25k, 0.7% for AGIs $25k-50k, 0.9% for AGIs $50k-75k, 1.6% for AGIs $75k-100k, 1.9% for AGIs $100k-200k, 2.6% for AGIs over 200k)
Taxes paid: $3,804 (reported on 30.9% of returns)
89705:
$3,804
State:
$5,116
(% of AGI for various income ranges: 1.8% for AGIs below $25k, 1.6% for AGIs $25k-50k, 2.3% for AGIs $50k-75k, 2.4% for AGIs $75k-100k, 3.1% for AGIs $100k-200k, 1.5% for AGIs over 200k)
Earned income credit: $2,185 (reported on 15.9% of returns)
Here:
$2,185
State:
$2,279
(% of AGI for various income ranges: 5.4% for AGIs below $25k, 1.1% for AGIs $25k-50k)
Percentage of individuals using paid preparers for their 2012 taxes: 44.3%
Here:
44%
State:
55%
(% for various income ranges: 40.0% for AGIs below $25k, 40.9% for AGIs $25k-50k, 48.8% for AGIs $50k-75k, 48.0% for AGIs $75k-100k, 52.2% for AGIs $100k-200k, 75.0% for AGIs over 200k)
Averages for the 2004 tax year for zip code 89705, filed in 2005:
Average Adjusted Gross Income (AGI) in 2004: $56,971 (Individual Income Tax Returns)
Here:
$56,971
State:
$58,367
Salary/wage: $40,397 (reported on 82.1% of returns)
Here:
$40,397
State:
$42,695
(% of AGI for various income ranges: 134.2% for AGIs below $10k, 75.0% for AGIs $10k-25k, 77.8% for AGIs $25k-50k, 77.4% for AGIs $50k-75k, 79.1% for AGIs $75k-100k, 29.5% for AGIs over 100k)
Taxable interest for individuals: $2,207 (reported on 42.3% of returns)
This zip code:
$2,207
Nevada:
$3,867
(% of AGI for various income ranges: 6.6% for AGIs below $10k, 1.7% for AGIs $10k-25k, 1.5% for AGIs $25k-50k, 1.3% for AGIs $50k-75k, 1.8% for AGIs $75k-100k, 1.7% for AGIs over 100k)
Taxable dividends: $3,790 (reported on 21.7% of returns)
Here:
$3,790
State:
$5,770
(% of AGI for various income ranges: 4.6% for AGIs below $10k, 1.2% for AGIs $10k-25k, 1.0% for AGIs $25k-50k, 1.1% for AGIs $50k-75k, 1.7% for AGIs $75k-100k, 1.7% for AGIs over 100k)
Net capital gain/loss: +$35,317 (reported on 18.3% of returns)
Here:
+$35,317
State:
+$50,644
(% of AGI for various income ranges: -3.7% for AGIs below $10k, 0.2% for AGIs $10k-25k, 0.5% for AGIs $25k-50k, 0.7% for AGIs $50k-75k, 1.5% for AGIs $75k-100k, 26.4% for AGIs over 100k)
Profit/loss from business: +$12,621 (reported on 15.4% of returns)
Here:
+$12,621
State:
+$13,618
(% of AGI for various income ranges: 3.4% for AGIs below $10k, 4.2% for AGIs $10k-25k, 2.5% for AGIs $25k-50k, 2.5% for AGIs $50k-75k, 4.7% for AGIs $75k-100k, 3.7% for AGIs over 100k)
IRA payment deduction: $2,145 (reported on 3.1% of returns)
89705:
$2,145
Nevada:
$3,054
(% of AGI for various income ranges: 0.2% for AGIs $10k-25k, 0.2% for AGIs $25k-50k, 0.2% for AGIs $50k-75k, 0.3% for AGIs $75k-100k)
Total itemized deductions: $18,486 (22% of AGI, reported on 39.5% of returns)
Here:
$18,486
State:
$22,990
Here:
22.1% of AGI
State:
21.8% of AGI
(% of AGI for various income ranges: 15.9% for AGIs below $10k, 16.6% for AGIs $10k-25k, 13.8% for AGIs $25k-50k, 17.9% for AGIs $50k-75k, 16.0% for AGIs $75k-100k, 8.2% for AGIs over 100k)
Charity contributions deductions: $3,429 (4% of AGI, reported on 35.0% of returns)
Here:
$3,429
State:
$3,443
Here:
4.0% of AGI
State:
3.1% of AGI
(% of AGI for various income ranges: 1.3% for AGIs $10k-25k, 1.2% for AGIs $25k-50k, 1.4% for AGIs $50k-75k, 1.8% for AGIs $75k-100k, 3.1% for AGIs over 100k)
Total tax: $8,125 (reported on 77.3% of returns)
89705:
$8,125
State:
$10,585
(% of AGI for various income ranges: 5.0% for AGIs below $10k, 4.2% for AGIs $10k-25k, 6.7% for AGIs $25k-50k, 8.4% for AGIs $50k-75k, 10.6% for AGIs $75k-100k, 15.5% for AGIs over 100k)
Earned income credit: $1,678 (reported on 12.1% of returns)
Here:
$1,678
State:
$1,676
Percentage of individuals using paid preparers for their 2004 taxes: 55.3%
Here:
55%
State:
60%
(% for various income ranges: 48.4% for AGIs below $10k, 58.8% for AGIs $10k-25k, 55.9% for AGIs $25k-50k, 54.6% for AGIs $50k-75k, 48.8% for AGIs $75k-100k, 67.9% for AGIs over 100k)
Household received Food Stamps/SNAP in the past 12 months: 100 Household did not receive Food Stamps/SNAP in the past 12 months: 2,166
Women who had a birth in the past 12 months: 67 (75 now married, 0 unmarried) Women who did not have a birth in the past 12 months: 890 (442 now married, 444 unmarried)
Housing units in zip code 89705 with a mortgage: 1,272 (104 second mortgage, 36 home equity loan, 50 both second mortgage and home equity loan) Houses without a mortgage: 14
Median monthly owner costs for units with a mortgage: $1,713 Median monthly owner costs for units without a mortgage: $479
Residents with income below the poverty level in 2022:
This zip code:
10.0%
Whole state:
12.5%
Residents with income below 50% of the poverty level in 2022:
This zip code:
5.5%
Whole state:
5.9%
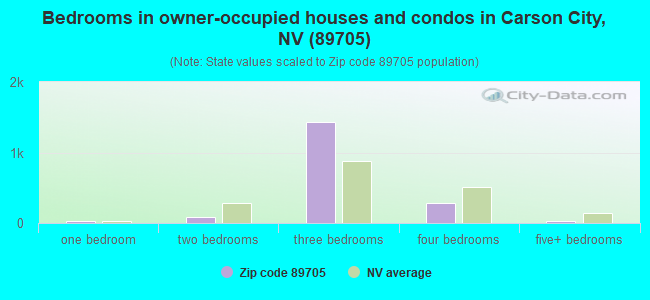
Median number of rooms in houses and condos:
Here:
5.7
State:
6.0
Median number of rooms in apartments:
Here:
4.8
State:
4.2
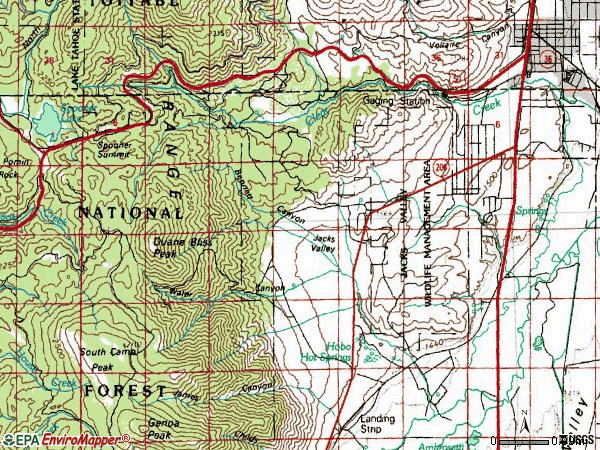
Notable locations in this zip code not listed on our city pages
Notable locations in zip code 89705: Snyder Ranch (A), Jacks Valley Ranch (B), Prison Honor Camp (C), Stewart Indian School Ranch (D), Spooner Forest Service Facility (E), Woods Ranch (F), East Fork Fire and Paramedic Districts Station 16 Jacks Valley Reserve Equipment (G), East Fork Fire and Paramedic Districts Station 12 Sunridge - Jacks Valley Volunteer Fire Department (H), Clear Creek Youth Center (I), East Fork Fire and Paramedic Districts Station 15 Jacks Valley Seasonals (J). Display/hide their locations on the map
In group quarters: 4 (-1 institutionalized population)
Size of family households: 878 2-persons, 245 3-persons, 338 4-persons, 107 5-persons, 26 6-persons, 13 7-or-more-persons
Size of nonfamily households: 557 1-person, 135 2-persons
617 married couples with children.
208 single-parent households (54 men, 154 women).
88.1% of residents of 89705 zip code speak English at home.
6.6% of residents speak Spanish at home (57% very well, 31% well, 4% not well, 7% not at all).
1.5% of residents speak other Indo-European language at home (90% very well, 10% not well).
3.9% of residents speak Asian or Pacific Island language at home (12% very well, 85% well, 3% not well).
0.1% of residents speak other language at home (100% very well).
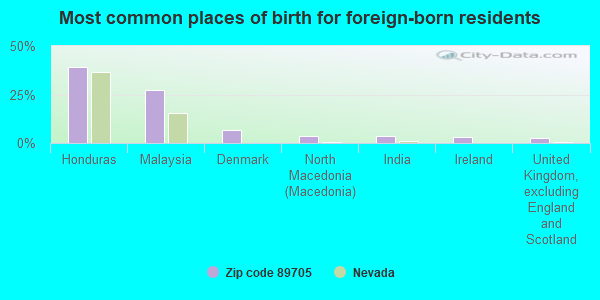
Foreign born population: 509 (9.5%) (66.7% of them are naturalized citizens)
This zip code:
9.5%
Whole state:
18.9%
39%Honduras
27%Malaysia
7%Denmark
4%North Macedonia (Macedonia)
3%India
3%Ireland
2%United Kingdom, excluding England and Scotland
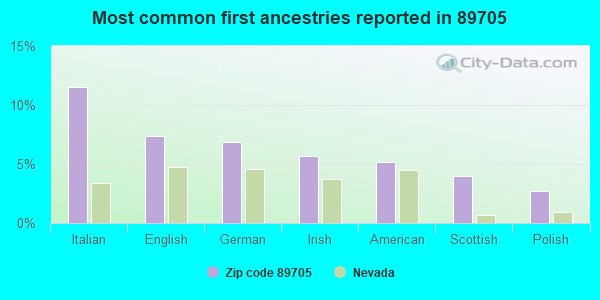
12%Italian
7%English
7%German
6%Irish
5%American
4%Scottish
3%Polish
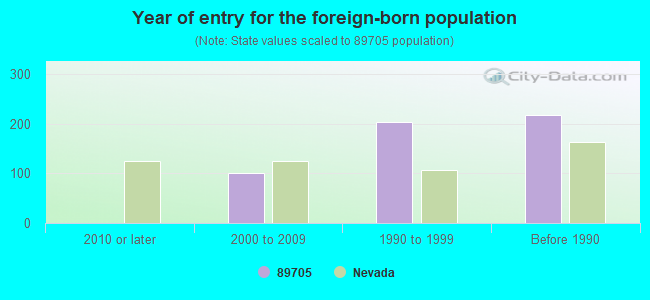
Year of entry for the foreign-born population
02010 or later
1012000 to 2009
2031990 to 1999
218Before 1990
Facilities with environmental interests located in this zip code:
COSTCO WHOLESALE #127 (700 OLD CLEAR CREEK RD in CARSON CITY, NV)
HAZARDOUS WASTE BIENNIAL REPORTER (Resource Conservation and Recovery Act (tracking hazardous waste)) Large Quantity Generators, more that 1000 kg of hazardous waste/month (Resource Conservation and Recovery Act (tracking hazardous waste)) Business NAICS classification: ONE-HOUR PHOTOFINISHING. Organizations: PHIL REDDICK (CONTACT/OPERATOR)
HOME DEPOT USA INC HD3312 (921 JACKS VALLEY RD in CARSON CITY, NV)
Small Quantity Generators, between 100 kg and 1000 kg of hazardous waste/month (Resource Conservation and Recovery Act (tracking hazardous waste)) Organizations: HOME DEPOT 3312 (CONTACT/OPERATOR)
Alternative names: HOME DEPOT 3312
PDQ NUMBER 509 (1615 EAST FIFTH STEET in CARSON CITY, NV)
(Resource Conservation and Recovery Act (tracking hazardous waste)) Organizations: PDQ FOOD STORES OF NEVADA INC (CONTACT/OWNER)
TARGET NO 1239 (911 JACKS VALLEY RD in CARSON CITY, NV)
Conditionally Exempt Small Quantity Generators, less than 100 kg/month of hazardous waste (Resource Conservation and Recovery Act (tracking hazardous waste)) Business NAICS classification: ONE-HOUR PHOTOFINISHING. Organizations: TARGET STORE 1239 (CONTACT/OPERATOR)
, DAYTON HUDSON CORP (CONTACT/OWNER)
, TARGET CORPORATION (CONTACT/OWNER)
EASTERN SIERRA PUBLISHING INC (3756 GROSS CIRCLE in CARSON CITY, NV)
(Resource Conservation and Recovery Act (tracking hazardous waste))
DOUGLAS / TAHOE LANDFILL (PINE NUT RD., T12N R21E SEC.18 in CARSON CITY, NV)
CRITERIA AND HAZARDOUS AIR POLLUTANT INVENTORY (Inventory of air pollution sources) Business SIC classification: REFUSE SYSTEMS Business NAICS classification: SOLID WASTE LANDFILL.
Housing units lacking complete plumbing facilities: 0.4% Housing units lacking complete kitchen facilities: 1.7%
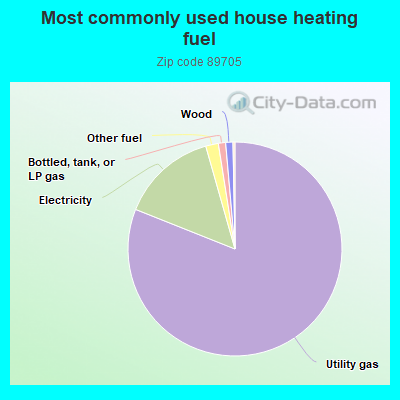
81.2%Utility gas
14.6%Electricity
1.9%Other fuel
1.1%Bottled, tank, or LP gas
1.1%Wood
Population in 1990: 2,703. Population change in the 1990s: +1,539 (+56.9%).
Place of birth for U.S.-born residents:
This state: 1,269
Northeast: 366
Midwest: 405
South: 370
West: 2,389
51% of the 89705 zip code residents lived in the same house 5 years ago. Out of people who lived in different houses, 24% lived in this county. Out of people who lived in different counties, 50% lived in Nevada.
94% of the 89705 zip code residents lived in the same house 1 year ago. Out of people who lived in different houses, 30% moved from this county. Out of people who lived in different houses, 39% moved from different county within same state. Out of people who lived in different houses, 42% moved from different state. Out of people who lived in different houses, 6% moved from abroad.
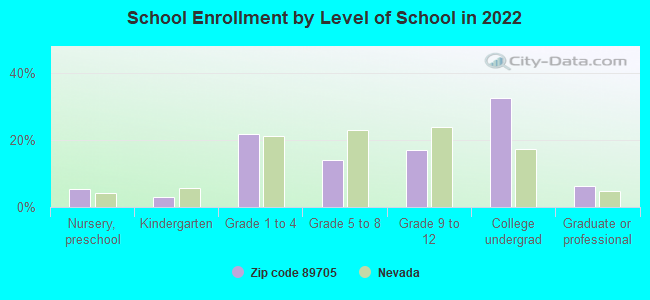
Private vs. public school enrollment:
Students in private schools in grades 1 to 8 (elementary and middle school): 16
Here:
4.4%
Nevada:
12.9%
Students in private schools in grades 9 to 12 (high school): 21
Here:
11.8%
Nevada:
6.9%
Students in private undergraduate colleges: 100
Here:
29.8%
Nevada:
16.0%
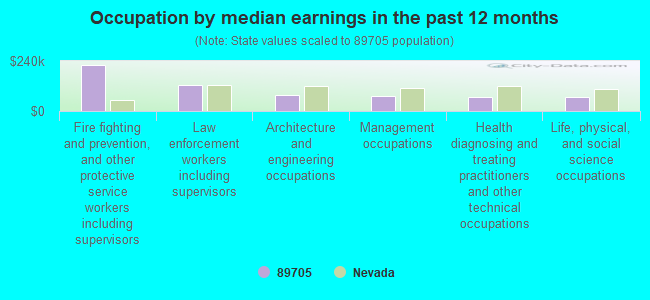
Occupation by median earnings in the past 12 months ($)
219,389Fire fighting and prevention, and other protective service workers including supervisors
124,126Law enforcement workers including supervisors
76,394Architecture and engineering occupations
72,743Management occupations
68,931Health diagnosing and treating practitioners and other technical occupations
68,627Life, physical, and social science occupations
Top industries in this zip code by the number of employees in 2005:
Accommodation and Food Services: Full-Service Restaurants (100-249: 1, 1-4: 1)
Accommodation and Food Services: Snack and Nonalcoholic Beverage Bars (20-49: 1, 10-19: 1)
Fatal accident statistics in 2011:
Fatal accident count: 2
Vehicles involved in fatal accidents: 4
Fatal accidents caused by drunken drivers: 0
Fatalities: 3
Persons involved in fatal accidents: 10
Pedestrians involved in fatal accidents: 0
2002 - 2018 National Fire Incident Reporting System (NFIRS) incidents
Based on the data from the years 2002 - 2018 the average number of fires per year is 16. The highest number of reported fire incidents - 21 took place in 2004, and the least - 9 in 2002. The data has a rising trend.
When looking into fire subcategories, the most incidents belonged to: Outside Fires (46.9%), and Structure Fires (33.8%).
Fire incident types reported to NFIRS in Zip Code 89705


 Nearest zip codes: 89703, 89413, 89411, 89448, 89702, 89701.


 Based on the data from the years 2002 - 2018 the average number of fires per year is 16. The highest number of reported fire incidents - 21 took place in 2004, and the least - 9 in 2002. The data has a rising trend.
 When looking into fire subcategories, the most incidents belonged to: Outside Fires (46.9%), and Structure Fires (33.8%).