Estimated zip code population in 2022: 7,493 Zip code population in 2010: 7,238 Zip code population in 2000: 4,558
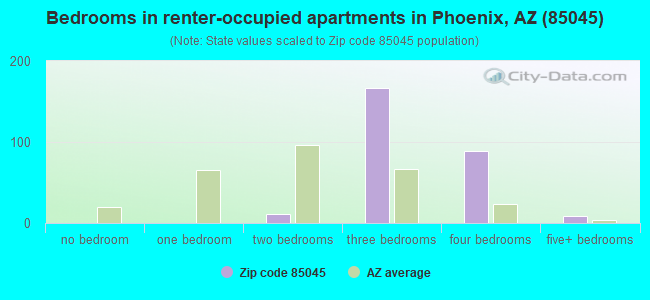
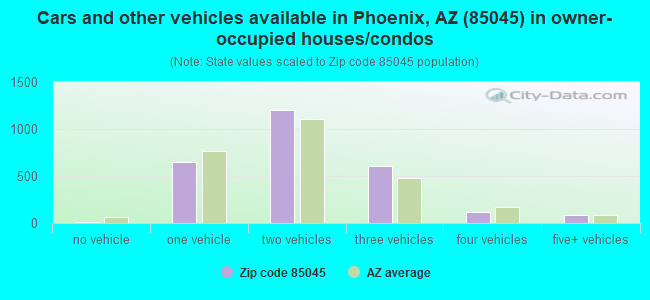
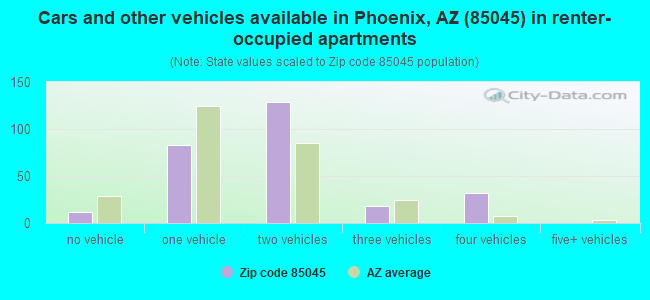
Houses and condos: 3,001 Renter-occupied apartments: 271
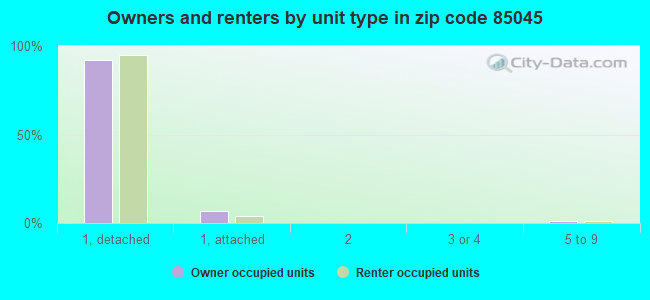
% of renters here:
9%
State:
33%
March 2022 cost of living index in zip code 85045: 102.3 (near average, U.S. average is 100)
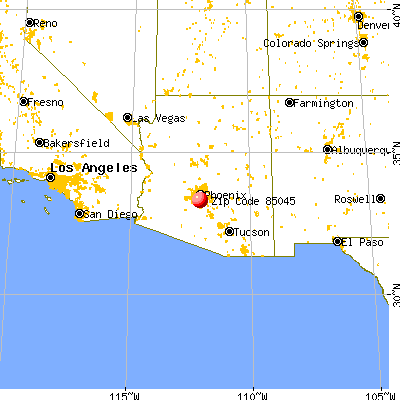
Land area: 3.6 sq. mi. Water area: 0.0 sq. mi.
Population density: 2,083 people per square mile
(low).
OSM Map
General Map
Google Map
MSN Map
OSM Map
General Map
Google Map
MSN Map
OSM Map
General Map
Google Map
MSN Map
OSM Map
General Map
Google Map
MSN Map
Please wait while loading the map...
Real estate property taxes paid for housing units in 2022:
This zip code:
0.5% ($3,190)
Arizona:
0.4% ($1,786)
Median real estate property taxes paid for housing units with mortgages in 2022: $3,208 (0.5%) Median real estate property taxes paid for housing units with no mortgage in 2022: $3,172 (0.5%)
Business Search- 14 Million verified businesses
Males: 3,695
(49.3%)
Females: 3,798
(50.7%)
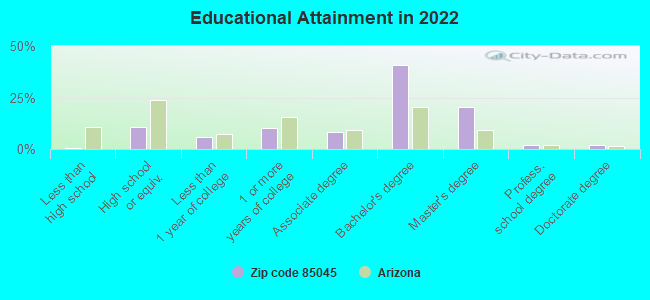
For population 25 years and over in 85045:
High school or higher: 101.3%
Bachelor's degree or higher: 65.9%
Graduate or professional degree: 24.4%
Unemployed: 1.7%
Mean travel time to work (commute): 29.9 minutes
For population 15 years and over in 85045:
Never married: 23.9%
Now married: 63.2%
Separated: 0.1%
Widowed: 3.6%
Divorced: 9.1%
Zip code 85045 compared to state average:
Median household income above state average.
Median house value above state average.
Unemployed percentage below state average.
Median age above state average.
Renting percentage significantly below state average.
Length of stay since moving in below state average.
Number of rooms per house above state average.
House age significantly below state average.
Percentage of population with a bachelor's degree or higher above state average.
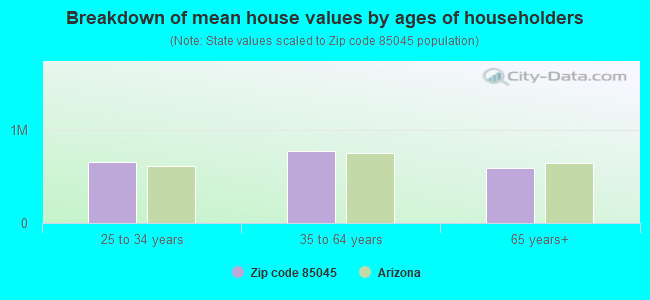
Estimated median house/condo value in 2022: $684,534
85045:
$684,534
Arizona:
$402,800
According to our research of Arizona and other state lists, there were 3 registered sex offenders living in 85045 zip code as of June 04, 2024. The ratio of all residents to sex offenders in zip code 85045 is 2,524 to 1. The ratio of registered sex offenders to all residents in this zip code is much lower than the state average.
Median resident age:
This zip code:
44.0 years
Arizona median age:
38.8 years
Average household size:
This zip code:
2.6 people
Arizona:
2.5 people
Averages for the 2020 tax year for zip code 85045, filed in 2021:
Average Adjusted Gross Income (AGI) in 2020: $131,889 (Individual Income Tax Returns)
Here:
$131,889
State:
$73,499
Salary/wage: $117,158 (reported on 85.8% of returns)
Here:
$117,158
State:
$59,499
(% of AGI for various income ranges: 1321.1% for AGIs below $25k, 3613.1% for AGIs $25k-50k, 6731.8% for AGIs $50k-75k, 9690.0% for AGIs $75k-100k, 21943.1% for AGIs $100k-200k, 77503.0% for AGIs over 200k)
Taxable interest for individuals: $1,378 (reported on 39.6% of returns)
This zip code:
$1,378
Arizona:
$2,325
(% of AGI for various income ranges: 6.2% for AGIs below $25k, 36.4% for AGIs $25k-50k, 67.9% for AGIs $50k-75k, 74.4% for AGIs $75k-100k, 100.4% for AGIs $100k-200k, 383.0% for AGIs over 200k)
Ordinary dividends: $5,131 (reported on 36.3% of returns)
Here:
$5,131
State:
$8,711
(% of AGI for various income ranges: 40.4% for AGIs below $25k, 57.7% for AGIs $25k-50k, 215.7% for AGIs $50k-75k, 157.2% for AGIs $75k-100k, 293.5% for AGIs $100k-200k, 1560.4% for AGIs over 200k)
Net capital gain/loss in AGI: +$20,176 (reported on 34.5% of returns)
Here:
+$20,176
State:
+$31,332
(% of AGI for various income ranges: 23.5% for AGIs below $25k, 95.1% for AGIs $25k-50k, 178.6% for AGIs $50k-75k, 188.0% for AGIs $75k-100k, 858.3% for AGIs $100k-200k, 7741.1% for AGIs over 200k)
Profit/loss from business: +$13,290 (reported on 18.1% of returns)
Here:
+$13,290
State:
+$13,214
(% of AGI for various income ranges: 20.9% for AGIs below $25k, 80.3% for AGIs $25k-50k, 355.0% for AGIs $50k-75k, 404.4% for AGIs $75k-100k, 737.3% for AGIs $100k-200k, 1124.4% for AGIs over 200k)
Taxable individual retirement arrangement distribution: $32,437 (reported on 10.6% of returns)
85045:
$32,437
Arizona:
$23,364
(% of AGI for various income ranges: 47.5% for AGIs below $25k, 100.0% for AGIs $25k-50k, 306.1% for AGIs $50k-75k, 602.4% for AGIs $75k-100k, 1152.9% for AGIs $100k-200k, 1588.9% for AGIs over 200k)
Self-employed (Keogh) retirement plans: $23,950 (reported on 1.0% of returns)
85045:
$23,950
Arizona:
$26,938
(% of AGI for various income ranges: 354.8% for AGIs over 200k)
Total itemized deductions: $31,535 (reported on 23.1% of returns)
Here:
$31,535
State:
$36,308
(% of AGI for various income ranges: 118.5% for AGIs below $25k, 253.1% for AGIs $25k-50k, 685.7% for AGIs $50k-75k, 775.6% for AGIs $75k-100k, 1775.6% for AGIs $100k-200k, 4938.9% for AGIs over 200k)
Charity contributions: $7,022 (reported on 19.7% of returns)
Here:
$7,022
State:
$11,955
(% of AGI for various income ranges: 18.2% for AGIs below $25k, 114.6% for AGIs $50k-75k, 78.4% for AGIs $75k-100k, 313.8% for AGIs $100k-200k, 1143.7% for AGIs over 200k)
Taxes paid: $8,101 (reported on 23.1% of returns)
85045:
$8,101
State:
$6,820
(% of AGI for various income ranges: 20.7% for AGIs below $25k, 32.8% for AGIs $25k-50k, 142.1% for AGIs $50k-75k, 191.2% for AGIs $75k-100k, 470.6% for AGIs $100k-200k, 1350.0% for AGIs over 200k)
Earned income credit: $1,811 (reported on 4.7% of returns)
Here:
$1,811
State:
$2,383
(% of AGI for various income ranges: 33.8% for AGIs below $25k, 35.9% for AGIs $25k-50k)
Percentage of individuals using paid preparers for their 2020 taxes: 93.0%
Here:
93%
State:
93%
(% for various income ranges: 91.4% for AGIs below $25k, 91.8% for AGIs $25k-50k, 92.7% for AGIs $50k-75k, 94.6% for AGIs $75k-100k, 95.1% for AGIs $100k-200k, 92.1% for AGIs over 200k)
Averages for the 2012 tax year for zip code 85045, filed in 2013:
Average Adjusted Gross Income (AGI) in 2012: $111,980 (Individual Income Tax Returns)
Here:
$111,980
State:
$57,644
Salary/wage: $102,184 (reported on 88.5% of returns)
Here:
$102,184
State:
$47,932
(% of AGI for various income ranges: 84.7% for AGIs below $25k, 72.8% for AGIs $25k-50k, 77.8% for AGIs $50k-75k, 76.6% for AGIs $75k-100k, 85.7% for AGIs $100k-200k, 77.8% for AGIs over 200k)
Taxable interest for individuals: $1,114 (reported on 47.1% of returns)
This zip code:
$1,114
Arizona:
$2,064
(% of AGI for various income ranges: 1.4% for AGIs below $25k, 1.6% for AGIs $25k-50k, 1.1% for AGIs $50k-75k, 0.6% for AGIs $75k-100k, 0.3% for AGIs $100k-200k, 0.3% for AGIs over 200k)
Ordinary dividends: $3,620 (reported on 36.9% of returns)
Here:
$3,620
State:
$7,268
(% of AGI for various income ranges: 2.6% for AGIs below $25k, 1.5% for AGIs $25k-50k, 1.2% for AGIs $50k-75k, 0.8% for AGIs $75k-100k, 1.0% for AGIs $100k-200k, 1.4% for AGIs over 200k)
Net capital gain/loss in AGI: +$5,394 (reported on 33.7% of returns)
Here:
+$5,394
State:
+$15,530
(% of AGI for various income ranges: 0.2% for AGIs $50k-75k, 0.1% for AGIs $75k-100k, 0.8% for AGIs $100k-200k, 3.3% for AGIs over 200k)
Profit/loss from business: +$17,137 (reported on 18.9% of returns)
Here:
+$17,137
State:
+$12,323
(% of AGI for various income ranges: 9.9% for AGIs below $25k, 7.7% for AGIs $25k-50k, 4.3% for AGIs $50k-75k, 4.0% for AGIs $75k-100k, 1.9% for AGIs $100k-200k, 2.6% for AGIs over 200k)
Taxable individual retirement arrangement distribution: $20,029 (reported on 11.2% of returns)
85045:
$20,029
Arizona:
$18,280
(% of AGI for various income ranges: 2.6% for AGIs below $25k, 5.5% for AGIs $25k-50k, 4.3% for AGIs $50k-75k, 3.7% for AGIs $75k-100k, 2.2% for AGIs $100k-200k, 0.7% for AGIs over 200k)
Self-employment retirement plans: $20,125 (reported on 1.3% of returns)
85045:
$20,125
Arizona:
$22,154
Total itemized deductions: $27,577 (18% of AGI, reported on 61.2% of returns)
Here:
$27,577
State:
$23,651
Here:
17.7% of AGI
State:
20.6% of AGI
(% of AGI for various income ranges: 20.1% for AGIs below $25k, 21.3% for AGIs $25k-50k, 20.0% for AGIs $50k-75k, 17.5% for AGIs $75k-100k, 16.1% for AGIs $100k-200k, 11.8% for AGIs over 200k)
Charity contributions: $3,327 (reported on 56.1% of returns)
Here:
$3,327
State:
$4,114
(% of AGI for various income ranges: 0.8% for AGIs below $25k, 1.5% for AGIs $25k-50k, 1.6% for AGIs $50k-75k, 1.6% for AGIs $75k-100k, 1.9% for AGIs $100k-200k, 1.5% for AGIs over 200k)
Taxes paid: $8,626 (reported on 61.2% of returns)
85045:
$8,626
State:
$6,509
(% of AGI for various income ranges: 3.1% for AGIs below $25k, 3.6% for AGIs $25k-50k, 4.2% for AGIs $50k-75k, 4.2% for AGIs $75k-100k, 4.9% for AGIs $100k-200k, 4.9% for AGIs over 200k)
Earned income credit: $1,879 (reported on 4.5% of returns)
Here:
$1,879
State:
$2,432
(% of AGI for various income ranges: 2.7% for AGIs below $25k, 0.6% for AGIs $25k-50k)
Percentage of individuals using paid preparers for their 2012 taxes: 52.9%
Here:
53%
State:
52%
(% for various income ranges: 43.3% for AGIs below $25k, 48.6% for AGIs $25k-50k, 55.9% for AGIs $50k-75k, 60.0% for AGIs $75k-100k, 52.6% for AGIs $100k-200k, 64.3% for AGIs over 200k)
Averages for the 2004 tax year for zip code 85045, filed in 2005:
Average Adjusted Gross Income (AGI) in 2004: $105,331 (Individual Income Tax Returns)
Here:
$105,331
State:
$50,097
Salary/wage: $98,038 (reported on 90.6% of returns)
Here:
$98,038
State:
$42,146
(% of AGI for various income ranges: 132.2% for AGIs below $10k, 78.7% for AGIs $10k-25k, 78.1% for AGIs $25k-50k, 82.9% for AGIs $50k-75k, 87.1% for AGIs $75k-100k, 84.3% for AGIs over 100k)
Taxable interest for individuals: $1,671 (reported on 64.7% of returns)
This zip code:
$1,671
Arizona:
$2,374
(% of AGI for various income ranges: 7.8% for AGIs below $10k, 3.1% for AGIs $10k-25k, 3.0% for AGIs $25k-50k, 1.0% for AGIs $50k-75k, 0.7% for AGIs $75k-100k, 0.9% for AGIs over 100k)
Taxable dividends: $1,783 (reported on 43.9% of returns)
Here:
$1,783
State:
$3,888
(% of AGI for various income ranges: 4.6% for AGIs below $10k, 1.9% for AGIs $10k-25k, 1.7% for AGIs $25k-50k, 0.7% for AGIs $50k-75k, 0.6% for AGIs $75k-100k, 0.7% for AGIs over 100k)
Net capital gain/loss: +$5,607 (reported on 41.8% of returns)
Here:
+$5,607
State:
+$17,569
(% of AGI for various income ranges: -6.7% for AGIs below $10k, 0.5% for AGIs $10k-25k, 1.4% for AGIs $25k-50k, -0.4% for AGIs $50k-75k, 0.8% for AGIs $75k-100k, 2.9% for AGIs over 100k)
Profit/loss from business: +$15,941 (reported on 17.5% of returns)
Here:
+$15,941
State:
+$11,088
(% of AGI for various income ranges: 5.7% for AGIs below $10k, 3.8% for AGIs $10k-25k, 4.8% for AGIs $25k-50k, 4.2% for AGIs $50k-75k, 2.9% for AGIs $75k-100k, 2.3% for AGIs over 100k)
IRA payment deduction: $3,253 (reported on 3.2% of returns)
85045:
$3,253
Arizona:
$3,023
(% of AGI for various income ranges: 0.2% for AGIs $25k-50k, 0.2% for AGIs $50k-75k, 0.1% for AGIs $75k-100k, 0.1% for AGIs over 100k)
Self-employed pension: $11,935 (reported on 1.7% of returns)
Here:
$11,935
Arizona:
$15,785
Total itemized deductions: $24,759 (19% of AGI, reported on 73.6% of returns)
Here:
$24,759
State:
$19,781
Here:
18.6% of AGI
State:
21.8% of AGI
(% of AGI for various income ranges: 23.1% for AGIs below $10k, 23.8% for AGIs $10k-25k, 25.0% for AGIs $25k-50k, 23.8% for AGIs $50k-75k, 22.5% for AGIs $75k-100k, 15.1% for AGIs over 100k)
Charity contributions deductions: $2,802 (2% of AGI, reported on 68.1% of returns)
Here:
$2,802
State:
$3,389
Here:
2.1% of AGI
State:
3.5% of AGI
(% of AGI for various income ranges: 0.6% for AGIs below $10k, 1.4% for AGIs $10k-25k, 2.5% for AGIs $25k-50k, 2.1% for AGIs $50k-75k, 2.3% for AGIs $75k-100k, 1.7% for AGIs over 100k)
Total tax: $19,080 (reported on 89.4% of returns)
85045:
$19,080
State:
$8,323
(% of AGI for various income ranges: 4.6% for AGIs below $10k, 4.6% for AGIs $10k-25k, 7.8% for AGIs $25k-50k, 8.7% for AGIs $50k-75k, 9.9% for AGIs $75k-100k, 18.9% for AGIs over 100k)
Earned income credit: $1,205 (reported on 3.0% of returns)
Here:
$1,205
State:
$1,786
Percentage of individuals using paid preparers for their 2004 taxes: 54.0%
Here:
54%
State:
60%
(% for various income ranges: 41.8% for AGIs below $10k, 40.1% for AGIs $10k-25k, 56.6% for AGIs $25k-50k, 60.7% for AGIs $50k-75k, 50.7% for AGIs $75k-100k, 58.9% for AGIs over 100k)
Likely homosexual households (counted as self-reported same-sex unmarried-partner households)
Lesbian couples: 0.7% of all households
Gay men: 0.0% of all households
Household received Food Stamps/SNAP in the past 12 months: 81 Household did not receive Food Stamps/SNAP in the past 12 months: 2,823
Women who had a birth in the past 12 months: 105 (89 now married, 17 unmarried) Women who did not have a birth in the past 12 months: 1,631 (934 now married, 685 unmarried)
Housing units in zip code 85045 with a mortgage: 2,047 (128 second mortgage, 23 home equity loan, 109 both second mortgage and home equity loan) Median monthly owner costs for units with a mortgage: $2,365 Median monthly owner costs for units without a mortgage: $663
Residents with income below the poverty level in 2022:
This zip code:
2.4%
Whole state:
12.5%
Residents with income below 50% of the poverty level in 2022:
This zip code:
1.1%
Whole state:
6.0%
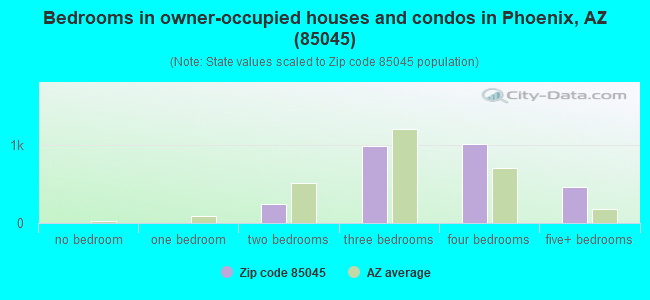
Median number of rooms in houses and condos:
Here:
7.2
State:
6.0
Median number of rooms in apartments:
Here:
6.6
State:
4.1
Notable locations in this zip code not listed on our city pages
Size of family households: 777 2-persons, 696 3-persons, 488 4-persons, 146 5-persons, 93 6-persons, 2 7-or-more-persons
Size of nonfamily households: 590 1-person, 116 2-persons
1,393 married couples with children.
242 single-parent households (77 men, 165 women).
79.9% of residents of 85045 zip code speak English at home.
10.3% of residents speak Spanish at home (68% very well, 19% well, 3% not well, 10% not at all).
4.0% of residents speak other Indo-European language at home (97% very well, 3% not well).
5.2% of residents speak Asian or Pacific Island language at home (71% very well, 24% well, 5% not well).
0.3% of residents speak other language at home (100% very well).
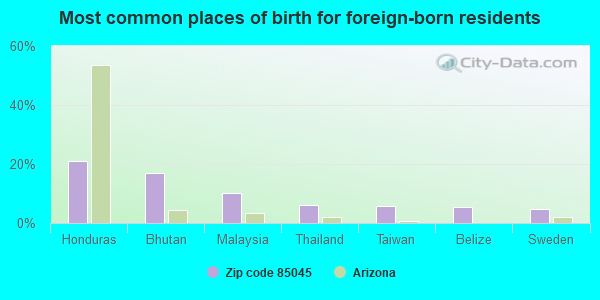
Foreign born population: 1,119 (14.9%) (66.6% of them are naturalized citizens)
Housing units lacking complete kitchen facilities: 0.3%
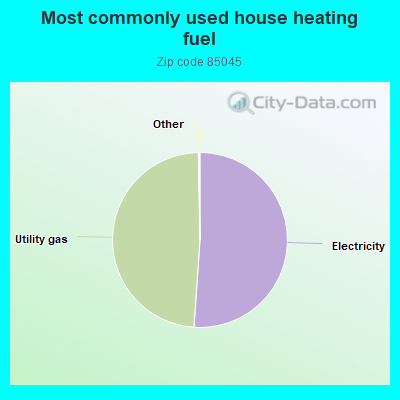
51.1%Electricity
48.6%Utility gas
Place of birth for U.S.-born residents:
This state: 2,325
Northeast: 784
Midwest: 1,648
South: 429
West: 1,057
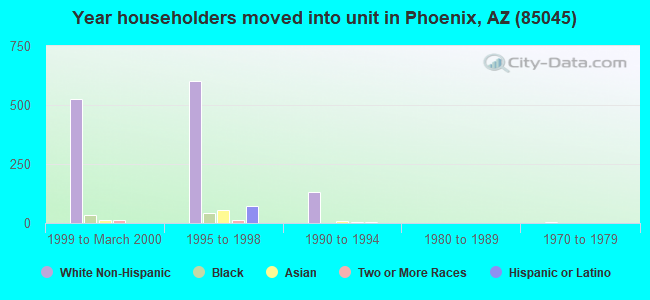
18% of the 85045 zip code residents lived in the same house 5 years ago. Out of people who lived in different houses, 40% lived in this county. Out of people who lived in different counties, 50% lived in Arizona.
89% of the 85045 zip code residents lived in the same house 1 year ago. Out of people who lived in different houses, 56% moved from this county. Out of people who lived in different houses, 3% moved from different county within same state. Out of people who lived in different houses, 40% moved from different state. Out of people who lived in different houses, 3% moved from abroad.
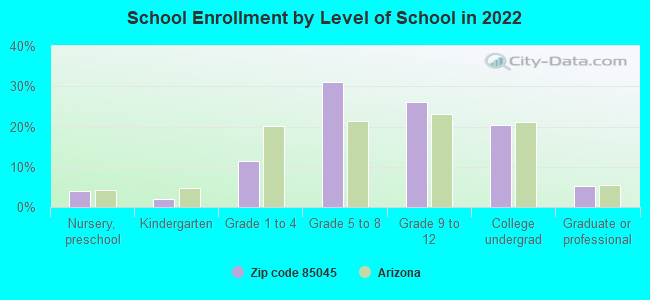
Private vs. public school enrollment:
Students in private schools in grades 1 to 8 (elementary and middle school): 93
Here:
11.2%
Arizona:
10.4%
Students in private schools in grades 9 to 12 (high school): 24
Here:
4.8%
Arizona:
8.8%
Students in private undergraduate colleges: 88
Here:
22.3%
Arizona:
13.1%
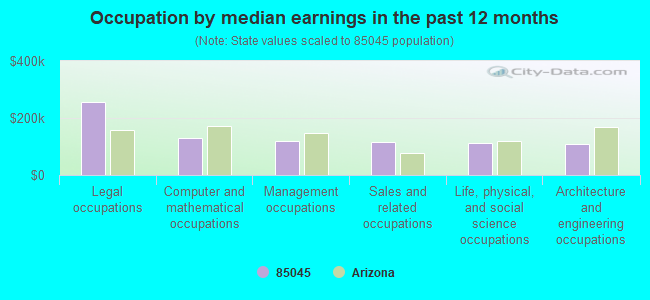
Occupation by median earnings in the past 12 months ($)
255,114Legal occupations
131,455Computer and mathematical occupations
120,816Management occupations
115,382Sales and related occupations
110,715Life, physical, and social science occupations
108,214Architecture and engineering occupations
Companies with federal contracts located in this zip code:
TISCHLER, MICHAEL (1401 W SALTSAGE DR in PHOENIX, AZ; small business) : $279,982 in 4 contractsin 2002
$69,997 with Air Force for Other Defense -- Management and Support (R&D). Signed on 2002-05-30. Completion date: 2002-12-07.
$69,997 with Army for Defense Missile and Space Systems -- Advanced Development (R&D). Signed on 2002-08-23. Completion date: 2003-02-23.
$69,997 with Air Force for Other Research and Development -- Management and Support (R&D). Signed on 2002-04-30. Completion date: 2002-11-15.
$69,991 with Army for Defense Missile and Space Systems -- Advanced Development (R&D). Signed on 2002-04-29. Completion date: 2002-10-29.
Top industries in this zip code by the number of employees in 2005:
Finance and Insurance: Mortgage and Nonmortgage Loan Brokers (50-99 employees: 1 establishment)
Administrative and Support and Waste Management and Remediation Services: Telemarketing Bureaus (50-99: 1)
Accommodation and Food Services: Full-Service Restaurants (20-49: 1)
Professional, Scientific, and Technical Services: Computer Systems Design Services (10-19: 1, 1-4: 4)
Accommodation and Food Services: Limited-Service Restaurants (10-19: 1, 1-4: 2)
Administrative and Support and Waste Management and Remediation Services: Landscaping Services (5-9: 1, 1-4: 2)
Construction: Highway, Street, and Bridge Construction (5-9: 1)
Fatal accident statistics in 2014:
Fatal accident count: 1
Vehicles involved in fatal accidents: 1
Fatal accidents caused by drunken drivers: 0
Fatalities: 1
Persons involved in fatal accidents: 1
Pedestrians involved in fatal accidents: 1
Fatal accident statistics in 2012:
Fatal accident count: 1
Vehicles involved in fatal accidents: 1
Fatal accidents caused by drunken drivers: 1
Fatalities: 1
Persons involved in fatal accidents: 1
Pedestrians involved in fatal accidents: 0
Home Mortgage Disclosure Act Aggregated Statistics For Year 2009 (Based on 4 partial tracts)
A) FHA, FSA/RHS & VA Home Purchase Loans
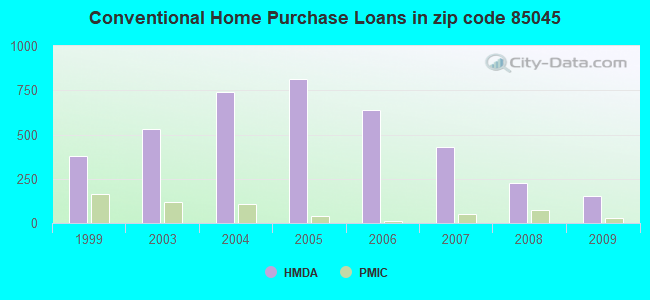
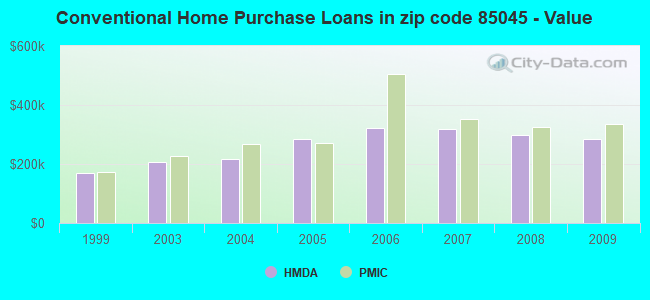
B) Conventional Home Purchase Loans
C) Refinancings
D) Home Improvement Loans
F) Non-occupant Loans on < 5 Family Dwellings (A B C & D)
G) Loans On Manufactured Home Dwelling (A B C & D)
Number
Average Value
Number
Average Value
Number
Average Value
Number
Average Value
Number
Average Value
Number
Average Value
LOANS ORIGINATED
114
$252,101
154
$284,338
454
$253,661
13
$127,343
52
$228,661
2
$390,230
APPLICATIONS APPROVED, NOT ACCEPTED
11
$288,644
19
$256,456
51
$305,961
2
$304,135
9
$185,617
0
$0
APPLICATIONS DENIED
17
$289,658
29
$295,901
129
$284,636
14
$163,946
11
$214,755
0
$0
APPLICATIONS WITHDRAWN
19
$251,742
9
$239,260
63
$269,340
4
$182,480
9
$175,514
0
$0
FILES CLOSED FOR INCOMPLETENESS
3
$264,440
4
$380,188
22
$307,243
1
$10,020
4
$242,372
0
$0
Aggregated Statistics For Year 2008 (Based on 4 partial tracts)
A) FHA, FSA/RHS & VA Home Purchase Loans
B) Conventional Home Purchase Loans
C) Refinancings
D) Home Improvement Loans
F) Non-occupant Loans on < 5 Family Dwellings (A B C & D)
Number
Average Value
Number
Average Value
Number
Average Value
Number
Average Value
Number
Average Value
LOANS ORIGINATED
45
$271,044
228
$297,559
235
$278,334
8
$120,529
60
$231,597
APPLICATIONS APPROVED, NOT ACCEPTED
2
$258,280
20
$268,380
28
$284,241
1
$26,730
1
$287,990
APPLICATIONS DENIED
17
$283,712
45
$289,560
118
$311,558
18
$70,215
14
$287,151
APPLICATIONS WITHDRAWN
14
$257,274
28
$293,722
55
$286,125
8
$322,582
5
$282,580
FILES CLOSED FOR INCOMPLETENESS
2
$233,015
12
$311,263
23
$293,180
1
$199,120
6
$304,273
Aggregated Statistics For Year 2007 (Based on 4 partial tracts)
A) FHA, FSA/RHS & VA Home Purchase Loans
B) Conventional Home Purchase Loans
C) Refinancings
D) Home Improvement Loans
F) Non-occupant Loans on < 5 Family Dwellings (A B C & D)
G) Loans On Manufactured Home Dwelling (A B C & D)
Number
Average Value
Number
Average Value
Number
Average Value
Number
Average Value
Number
Average Value
Number
Average Value
LOANS ORIGINATED
3
$209,183
428
$317,413
356
$305,382
30
$136,283
94
$280,804
0
$0
APPLICATIONS APPROVED, NOT ACCEPTED
0
$0
97
$319,330
78
$369,087
11
$32,446
11
$313,218
2
$84,220
APPLICATIONS DENIED
0
$0
56
$362,505
104
$370,054
42
$242,812
24
$390,965
0
$0
APPLICATIONS WITHDRAWN
0
$0
52
$382,947
82
$305,457
6
$153,722
8
$213,835
0
$0
FILES CLOSED FOR INCOMPLETENESS
0
$0
9
$384,302
20
$346,174
4
$289,162
1
$352,810
0
$0
Aggregated Statistics For Year 2006 (Based on 4 partial tracts)
A) FHA, FSA/RHS & VA Home Purchase Loans
B) Conventional Home Purchase Loans
C) Refinancings
D) Home Improvement Loans
F) Non-occupant Loans on < 5 Family Dwellings (A B C & D)
G) Loans On Manufactured Home Dwelling (A B C & D)
Number
Average Value
Number
Average Value
Number
Average Value
Number
Average Value
Number
Average Value
Number
Average Value
LOANS ORIGINATED
2
$320,045
640
$322,846
504
$321,598
55
$154,557
83
$276,121
0
$0
APPLICATIONS APPROVED, NOT ACCEPTED
0
$0
161
$356,007
64
$341,673
13
$203,718
17
$256,849
0
$0
APPLICATIONS DENIED
2
$241,435
129
$325,284
138
$391,636
37
$109,106
18
$274,240
2
$111,360
APPLICATIONS WITHDRAWN
0
$0
87
$339,513
116
$303,695
15
$105,933
20
$299,037
0
$0
FILES CLOSED FOR INCOMPLETENESS
0
$0
20
$330,234
24
$324,403
3
$78,023
4
$301,958
0
$0
Aggregated Statistics For Year 2005 (Based on 4 partial tracts)
A) FHA, FSA/RHS & VA Home Purchase Loans
B) Conventional Home Purchase Loans
C) Refinancings
D) Home Improvement Loans
F) Non-occupant Loans on < 5 Family Dwellings (A B C & D)
G) Loans On Manufactured Home Dwelling (A B C & D)
Number
Average Value
Number
Average Value
Number
Average Value
Number
Average Value
Number
Average Value
Number
Average Value
LOANS ORIGINATED
4
$297,585
815
$284,012
724
$292,937
66
$149,182
173
$237,420
2
$23,395
APPLICATIONS APPROVED, NOT ACCEPTED
0
$0
65
$291,568
75
$230,806
11
$57,322
10
$197,298
0
$0
APPLICATIONS DENIED
0
$0
146
$273,462
172
$308,428
42
$123,467
17
$186,378
1
$77,510
APPLICATIONS WITHDRAWN
0
$0
94
$306,656
111
$255,159
9
$190,359
11
$165,722
3
$105,690
FILES CLOSED FOR INCOMPLETENESS
0
$0
18
$309,901
57
$254,084
3
$143,683
3
$179,077
0
$0
Aggregated Statistics For Year 2004 (Based on 4 partial tracts)
A) FHA, FSA/RHS & VA Home Purchase Loans
B) Conventional Home Purchase Loans
C) Refinancings
D) Home Improvement Loans
F) Non-occupant Loans on < 5 Family Dwellings (A B C & D)
G) Loans On Manufactured Home Dwelling (A B C & D)
Number
Average Value
Number
Average Value
Number
Average Value
Number
Average Value
Number
Average Value
Number
Average Value
LOANS ORIGINATED
6
$237,883
738
$216,561
486
$222,552
21
$44,573
109
$194,541
0
$0
APPLICATIONS APPROVED, NOT ACCEPTED
0
$0
66
$243,000
70
$165,701
21
$26,137
7
$192,879
2
$32,755
APPLICATIONS DENIED
0
$0
102
$199,855
141
$227,786
46
$38,762
17
$173,780
1
$34,750
APPLICATIONS WITHDRAWN
1
$195,110
95
$208,992
90
$228,358
6
$68,790
8
$194,741
0
$0
FILES CLOSED FOR INCOMPLETENESS
0
$0
6
$229,667
54
$226,730
4
$59,352
1
$157,700
0
$0
Aggregated Statistics For Year 2003 (Based on 4 partial tracts)
A) FHA, FSA/RHS & VA Home Purchase Loans
B) Conventional Home Purchase Loans
C) Refinancings
D) Home Improvement Loans
F) Non-occupant Loans on < 5 Family Dwellings (A B C & D)
Number
Average Value
Number
Average Value
Number
Average Value
Number
Average Value
Number
Average Value
LOANS ORIGINATED
10
$230,965
530
$207,773
1,117
$196,315
28
$39,615
80
$170,996
APPLICATIONS APPROVED, NOT ACCEPTED
3
$136,433
24
$203,771
117
$190,371
8
$57,770
3
$110,187
APPLICATIONS DENIED
1
$106,240
32
$186,556
175
$203,672
25
$53,211
22
$176,352
APPLICATIONS WITHDRAWN
6
$215,627
55
$201,421
174
$207,143
5
$40,580
12
$140,147
FILES CLOSED FOR INCOMPLETENESS
0
$0
5
$284,776
23
$169,986
4
$32,585
0
$0
Aggregated Statistics For Year 1999 (Based on 1 partial tract)
A) FHA, FSA/RHS & VA Home Purchase Loans
B) Conventional Home Purchase Loans
C) Refinancings
D) Home Improvement Loans
F) Non-occupant Loans on < 5 Family Dwellings (A B C & D)


 Nearest zip codes: 85048, 85339, 85041, 85042, 85044, 85226.
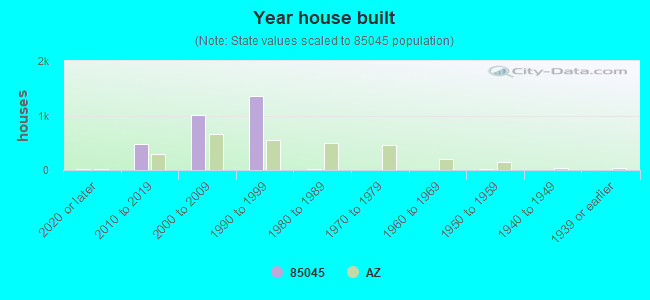


 : $279,982 in 4 contracts in 2002