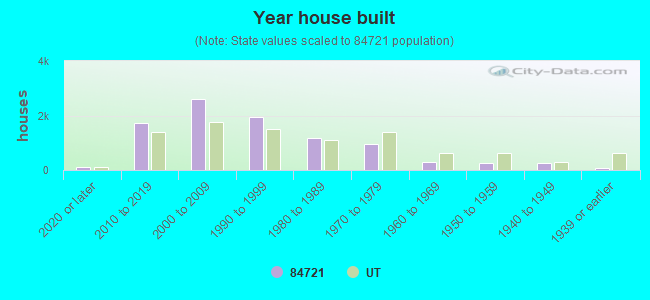
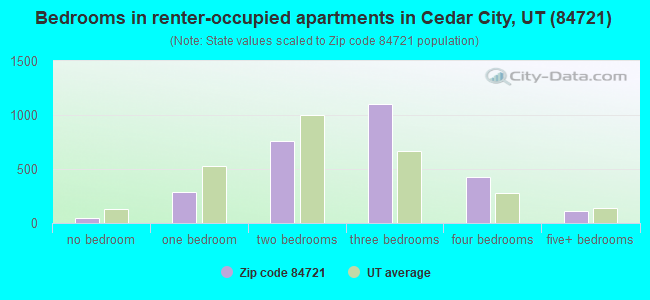
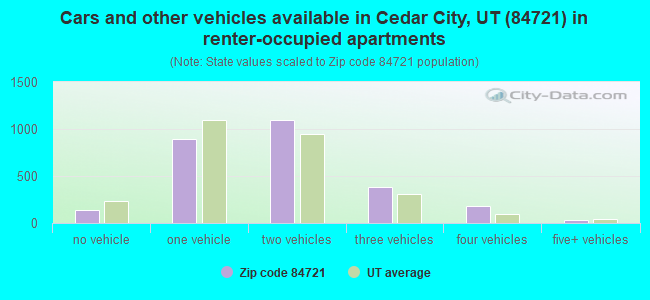
Houses and condos: 9,673 Renter-occupied apartments: 2,724
% of renters here:
30%
State:
29%
March 2022 cost of living index in zip code 84721: 85.2 (less than average, U.S. average is 100)
Land area: 253.5 sq. mi. Water area: 1.2 sq. mi.
Population density: 117 people per square mile
(very low).
OSM Map
Google Map
MSN Map
OSM Map
General Map
Google Map
MSN Map
OSM Map
Google Map
MSN Map
OSM Map
Google Map
MSN Map
Please wait while loading the map...
Real estate property taxes paid for housing units in 2022:
This zip code:
0.4% ($1,434)
Utah:
0.5% ($2,376)
Median real estate property taxes paid for housing units with mortgages in 2022: $1,420 (0.4%) Median real estate property taxes paid for housing units with no mortgage in 2022: $1,472 (0.4%)
Averages for the 2020 tax year for zip code 84721, filed in 2021:
Average Adjusted Gross Income (AGI) in 2020: $52,867 (Individual Income Tax Returns)
Here:
$52,867
State:
$81,660
Salary/wage: $44,303 (reported on 86.7% of returns)
Here:
$44,303
State:
$63,027
(% of AGI for various income ranges: 1278.5% for AGIs below $25k, 3690.8% for AGIs $25k-50k, 6755.6% for AGIs $50k-75k, 9887.2% for AGIs $75k-100k, 17443.2% for AGIs $100k-200k, 56398.6% for AGIs over 200k)
Taxable interest for individuals: $1,103 (reported on 22.8% of returns)
This zip code:
$1,103
Utah:
$2,255
(% of AGI for various income ranges: 8.6% for AGIs below $25k, 13.1% for AGIs $25k-50k, 24.1% for AGIs $50k-75k, 57.5% for AGIs $75k-100k, 95.3% for AGIs $100k-200k, 1387.1% for AGIs over 200k)
Ordinary dividends: $3,842 (reported on 9.7% of returns)
Here:
$3,842
State:
$7,362
(% of AGI for various income ranges: 8.7% for AGIs below $25k, 16.6% for AGIs $25k-50k, 23.4% for AGIs $50k-75k, 71.9% for AGIs $75k-100k, 164.4% for AGIs $100k-200k, 2525.7% for AGIs over 200k)
Net capital gain/loss in AGI: +$16,780 (reported on 11.0% of returns)
Here:
+$16,780
State:
+$43,433
(% of AGI for various income ranges: 2.8% for AGIs below $25k, 33.3% for AGIs $25k-50k, 60.8% for AGIs $50k-75k, 207.6% for AGIs $75k-100k, 858.8% for AGIs $100k-200k, 18360.0% for AGIs over 200k)
Profit/loss from business: +$6,883 (reported on 15.1% of returns)
Here:
+$6,883
State:
+$9,957
(% of AGI for various income ranges: 86.1% for AGIs below $25k, 136.9% for AGIs $25k-50k, 208.6% for AGIs $50k-75k, 96.0% for AGIs $75k-100k, 302.9% for AGIs $100k-200k, 621.4% for AGIs over 200k)
Taxable individual retirement arrangement distribution: $16,473 (reported on 5.3% of returns)
84721:
$16,473
Utah:
$21,167
(% of AGI for various income ranges: 25.0% for AGIs below $25k, 59.6% for AGIs $25k-50k, 88.4% for AGIs $50k-75k, 206.4% for AGIs $75k-100k, 551.7% for AGIs $100k-200k, 2372.9% for AGIs over 200k)
Total itemized deductions: $35,995 (reported on 7.0% of returns)
Here:
$35,995
State:
$41,056
(% of AGI for various income ranges: 25.6% for AGIs below $25k, 66.8% for AGIs $25k-50k, 230.5% for AGIs $50k-75k, 446.5% for AGIs $75k-100k, 1789.1% for AGIs $100k-200k, 13001.4% for AGIs over 200k)
Charity contributions: $17,839 (reported on 6.1% of returns)
Here:
$17,839
State:
$22,261
(% of AGI for various income ranges: 3.2% for AGIs below $25k, 15.4% for AGIs $25k-50k, 69.7% for AGIs $50k-75k, 149.1% for AGIs $75k-100k, 751.8% for AGIs $100k-200k, 7630.0% for AGIs over 200k)
Taxes paid: $7,054 (reported on 7.0% of returns)
84721:
$7,054
State:
$7,985
(% of AGI for various income ranges: 2.8% for AGIs below $25k, 10.4% for AGIs $25k-50k, 45.6% for AGIs $50k-75k, 90.1% for AGIs $75k-100k, 447.4% for AGIs $100k-200k, 1802.9% for AGIs over 200k)
Earned income credit: $2,421 (reported on 19.7% of returns)
Here:
$2,421
State:
$2,169
(% of AGI for various income ranges: 96.0% for AGIs below $25k, 91.1% for AGIs $25k-50k, 3.8% for AGIs $50k-75k)
Percentage of individuals using paid preparers for their 2020 taxes: 93.4%
Here:
93%
State:
94%
(% for various income ranges: 91.8% for AGIs below $25k, 94.2% for AGIs $25k-50k, 94.4% for AGIs $50k-75k, 93.7% for AGIs $75k-100k, 95.2% for AGIs $100k-200k, 95.7% for AGIs over 200k)
Averages for the 2012 tax year for zip code 84721, filed in 2013:
Average Adjusted Gross Income (AGI) in 2012: $41,619 (Individual Income Tax Returns)
Here:
$41,619
State:
$60,327
Salary/wage: $36,594 (reported on 88.0% of returns)
Here:
$36,594
State:
$48,762
(% of AGI for various income ranges: 83.4% for AGIs below $25k, 82.1% for AGIs $25k-50k, 83.5% for AGIs $50k-75k, 79.6% for AGIs $75k-100k, 71.5% for AGIs $100k-200k, 44.8% for AGIs over 200k)
Taxable interest for individuals: $982 (reported on 28.3% of returns)
This zip code:
$982
Utah:
$1,534
(% of AGI for various income ranges: 0.7% for AGIs below $25k, 0.5% for AGIs $25k-50k, 0.4% for AGIs $50k-75k, 0.6% for AGIs $75k-100k, 1.0% for AGIs $100k-200k, 1.2% for AGIs over 200k)
Ordinary dividends: $2,705 (reported on 9.9% of returns)
Here:
$2,705
State:
$5,711
(% of AGI for various income ranges: 0.5% for AGIs below $25k, 0.3% for AGIs $25k-50k, 0.3% for AGIs $50k-75k, 0.7% for AGIs $75k-100k, 1.1% for AGIs $100k-200k, 1.5% for AGIs over 200k)
Net capital gain/loss in AGI: +$3,752 (reported on 9.1% of returns)
Here:
+$3,752
State:
+$23,734
(% of AGI for various income ranges: 0.2% for AGIs $25k-50k, 0.4% for AGIs $50k-75k, 0.7% for AGIs $75k-100k, 1.9% for AGIs $100k-200k, 3.0% for AGIs over 200k)
Profit/loss from business: +$5,476 (reported on 16.2% of returns)
Here:
+$5,476
State:
+$8,845
(% of AGI for various income ranges: 5.9% for AGIs below $25k, 3.4% for AGIs $25k-50k, 1.2% for AGIs $50k-75k, 1.2% for AGIs $75k-100k, 0.9% for AGIs $100k-200k)
Taxable individual retirement arrangement distribution: $12,867 (reported on 6.1% of returns)
84721:
$12,867
Utah:
$15,565
(% of AGI for various income ranges: 1.7% for AGIs below $25k, 1.0% for AGIs $25k-50k, 1.9% for AGIs $50k-75k, 1.8% for AGIs $75k-100k, 3.9% for AGIs $100k-200k)
Total itemized deductions: $21,309 (27% of AGI, reported on 30.1% of returns)
Here:
$21,309
State:
$25,197
Here:
27.4% of AGI
State:
22.4% of AGI
(% of AGI for various income ranges: 7.1% for AGIs below $25k, 12.0% for AGIs $25k-50k, 16.9% for AGIs $50k-75k, 19.3% for AGIs $75k-100k, 19.4% for AGIs $100k-200k, 16.8% for AGIs over 200k)
Charity contributions: $6,776 (reported on 25.3% of returns)
Here:
$6,776
State:
$8,502
(% of AGI for various income ranges: 1.0% for AGIs below $25k, 2.4% for AGIs $25k-50k, 4.3% for AGIs $50k-75k, 5.1% for AGIs $75k-100k, 5.5% for AGIs $100k-200k, 7.8% for AGIs over 200k)
Taxes paid: $4,928 (reported on 29.9% of returns)
84721:
$4,928
State:
$7,001
(% of AGI for various income ranges: 1.0% for AGIs below $25k, 2.0% for AGIs $25k-50k, 3.4% for AGIs $50k-75k, 4.6% for AGIs $75k-100k, 5.8% for AGIs $100k-200k, 4.7% for AGIs over 200k)
Earned income credit: $2,442 (reported on 26.4% of returns)
Here:
$2,442
State:
$2,259
(% of AGI for various income ranges: 8.3% for AGIs below $25k, 2.3% for AGIs $25k-50k)
Percentage of individuals using paid preparers for their 2012 taxes: 50.0%
Here:
50%
State:
51%
(% for various income ranges: 45.3% for AGIs below $25k, 52.1% for AGIs $25k-50k, 50.9% for AGIs $50k-75k, 53.8% for AGIs $75k-100k, 63.6% for AGIs $100k-200k, 85.7% for AGIs over 200k)
Averages for the 2004 tax year for zip code 84721, filed in 2005:
Average Adjusted Gross Income (AGI) in 2004: $43,301 (Individual Income Tax Returns)
Here:
$43,301
State:
$45,498
Salary/wage: $32,505 (reported on 83.6% of returns)
Here:
$32,505
State:
$38,975
(% of AGI for various income ranges: 208.3% for AGIs below $10k, 77.6% for AGIs $10k-25k, 72.4% for AGIs $25k-50k, 81.1% for AGIs $50k-75k, 80.6% for AGIs $75k-100k, 30.6% for AGIs over 100k)
Taxable interest for individuals: $2,223 (reported on 42.8% of returns)
This zip code:
$2,223
Utah:
$1,445
(% of AGI for various income ranges: 6.6% for AGIs below $10k, 2.1% for AGIs $10k-25k, 1.4% for AGIs $25k-50k, 1.2% for AGIs $50k-75k, 2.0% for AGIs $75k-100k, 3.2% for AGIs over 100k)
Taxable dividends: $4,552 (reported on 16.0% of returns)
Here:
$4,552
State:
$3,152
(% of AGI for various income ranges: 0.2% for AGIs $10k-25k, 0.2% for AGIs $25k-50k, 0.8% for AGIs $50k-75k, 1.1% for AGIs $75k-100k, 3.8% for AGIs over 100k)
Net capital gain/loss: +$11,068 (reported on 18.2% of returns)
Here:
+$11,068
State:
+$14,059
(% of AGI for various income ranges: -1.1% for AGIs below $10k, -0.2% for AGIs $10k-25k, 0.6% for AGIs $25k-50k, 1.3% for AGIs $50k-75k, 1.9% for AGIs $75k-100k, 11.8% for AGIs over 100k)
Profit/loss from business: +$5,748 (reported on 21.4% of returns)
Here:
+$5,748
State:
+$6,903
(% of AGI for various income ranges: 27.4% for AGIs below $10k, 8.1% for AGIs $10k-25k, 4.4% for AGIs $25k-50k, 1.0% for AGIs $50k-75k, 1.5% for AGIs over 100k)
IRA payment deduction: $2,900 (reported on 1.4% of returns)
84721:
$2,900
Utah:
$2,970
Total itemized deductions: $21,856 (26% of AGI, reported on 34.5% of returns)
Here:
$21,856
State:
$20,312
Here:
26.4% of AGI
State:
24.9% of AGI
(% of AGI for various income ranges: 15.7% for AGIs $10k-25k, 14.1% for AGIs $25k-50k, 17.7% for AGIs $50k-75k, 19.7% for AGIs $75k-100k, 19.7% for AGIs over 100k)
Charity contributions deductions: $7,095 (9% of AGI, reported on 29.1% of returns)
Here:
$7,095
State:
$6,250
Here:
8.8% of AGI
State:
7.4% of AGI
(% of AGI for various income ranges: 2.0% for AGIs $10k-25k, 3.5% for AGIs $25k-50k, 4.0% for AGIs $50k-75k, 5.2% for AGIs $75k-100k, 6.8% for AGIs over 100k)
Total tax: $6,430 (reported on 71.6% of returns)
84721:
$6,430
State:
$6,523
(% of AGI for various income ranges: 6.4% for AGIs below $10k, 3.8% for AGIs $10k-25k, 5.9% for AGIs $25k-50k, 7.9% for AGIs $50k-75k, 9.4% for AGIs $75k-100k, 17.9% for AGIs over 100k)
Earned income credit: $1,944 (reported on 19.6% of returns)
Here:
$1,944
State:
$1,703
Percentage of individuals using paid preparers for their 2004 taxes: 65.2%
Here:
65%
State:
53%
(% for various income ranges: 54.1% for AGIs below $10k, 68.1% for AGIs $10k-25k, 62.6% for AGIs $25k-50k, 63.6% for AGIs $50k-75k, 82.0% for AGIs $75k-100k, 84.0% for AGIs over 100k)
Likely homosexual households (counted as self-reported same-sex unmarried-partner households)
Lesbian couples: 0.0% of all households
Gay men: 0.2% of all households
Household received Food Stamps/SNAP in the past 12 months: 609 Household did not receive Food Stamps/SNAP in the past 12 months: 8,443
Women who had a birth in the past 12 months: 301 (274 now married, 28 unmarried) Women who did not have a birth in the past 12 months: 7,379 (3,635 now married, 3,744 unmarried)
Housing units in zip code 84721 with a mortgage: 4,422 (520 second mortgage, 439 both second mortgage and home equity loan) Houses without a mortgage: 127
Median monthly owner costs for units with a mortgage: $1,425 Median monthly owner costs for units without a mortgage: $370
Residents with income below the poverty level in 2022:
This zip code:
11.8%
Whole state:
8.2%
Residents with income below 50% of the poverty level in 2022:
This zip code:
6.4%
Whole state:
4.3%
Median number of rooms in houses and condos:
Here:
7.0
State:
7.6
Median number of rooms in apartments:
Here:
4.5
State:
4.3
Notable locations in this zip code not listed on our city pages
Notable locations in zip code 84721: Cedar City KOA (A), Leigh Farm (B), Stevensville (C), Cedar City Fire Department Station 2 (D), Cedar City Fire Department Station 1 (E). Display/hide their locations on the map
Churches in zip code 84721 include: Assembly of God Church (A), First Baptist Church (B), Jehovahs Witnesses Cedar City Congregation (C), Valley Bible Church (D), The Church of Jesus Christ of Latter Day Saints (E). Display/hide their locations on the map
7,094 married couples with children.
1,135 single-parent households (493 men, 642 women).
90.4% of residents of 84721 zip code speak English at home.
7.2% of residents speak Spanish at home (52% very well, 20% well, 22% not well, 5% not at all).
1.1% of residents speak other Indo-European language at home (89% very well, 11% well).
0.3% of residents speak Asian or Pacific Island language at home (82% very well, 18% well).
0.6% of residents speak other language at home (89% very well, 11% well).
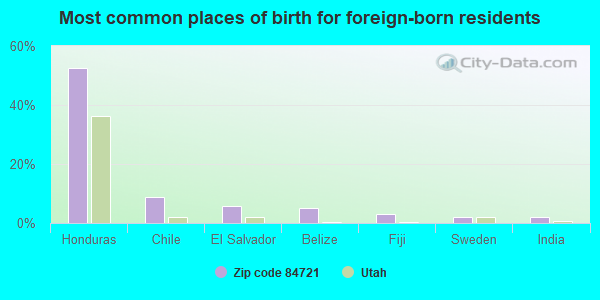
Foreign born population: 1,514 (5.1%) (41.6% of them are naturalized citizens)
This zip code:
5.1%
Whole state:
8.6%
53%Honduras
9%Chile
6%El Salvador
5%Belize
3%Fiji
2%Sweden
2%India
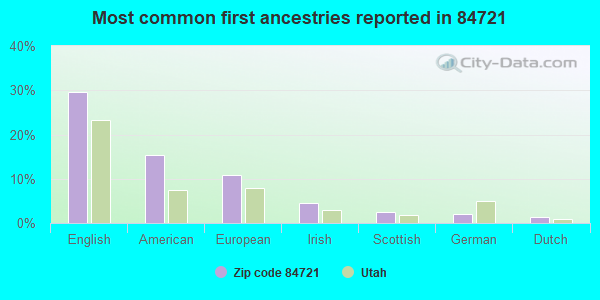
30%English
15%American
11%European
5%Irish
2%Scottish
2%German
1%Dutch
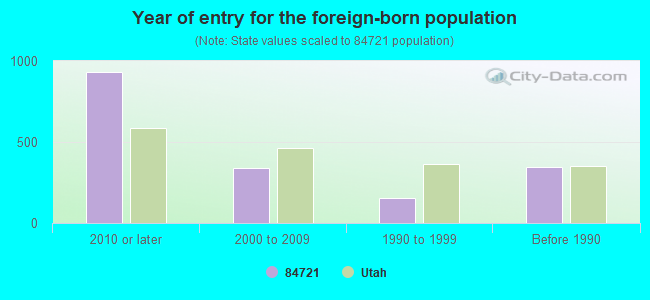
Year of entry for the foreign-born population
9302010 or later
3402000 to 2009
1521990 to 1999
347Before 1990
Facilities with environmental interests located in this zip code:
CEDAR CITY WATERWORKS SYSTEM (SITE INFORMATION RESTRICTED in CEDAR CITY, UT)
STATE MASTER (Utah compliance and permitting operations) - DMAC-5, DRINKING WATER SYSTEM ENFORCEMENT/COMPLIANCE ACTIVITY (Integrated Compliance Information System)
Housing units lacking complete plumbing facilities: 0.1% Housing units lacking complete kitchen facilities: 1.3%
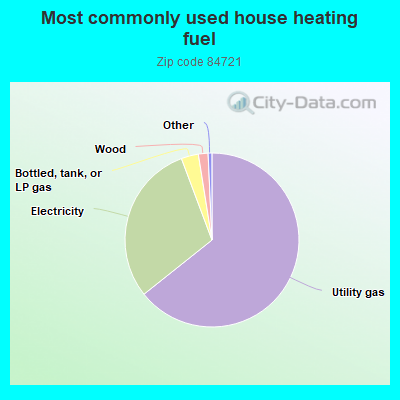
64.3%Utility gas
30.0%Electricity
3.2%Bottled, tank, or LP gas
1.8%Wood
Place of birth for U.S.-born residents:
This state: 17,312
Northeast: 514
Midwest: 1,342
South: 875
West: 7,898
90% of the 84721 zip code residents lived in the same house 1 year ago. Out of people who lived in different houses, 36% moved from this county. Out of people who lived in different houses, 36% moved from different county within same state. Out of people who lived in different houses, 25% moved from different state. Out of people who lived in different houses, 6% moved from abroad.
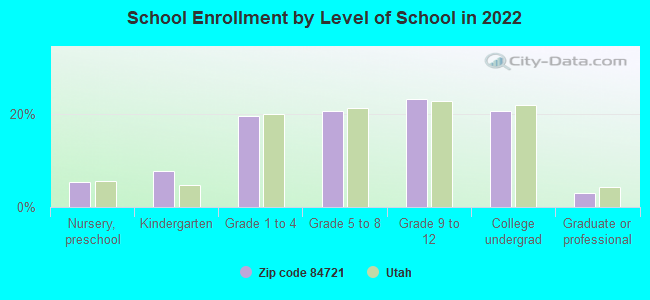
Private vs. public school enrollment:
Students in private schools in grades 1 to 8 (elementary and middle school): 197
Here:
5.2%
Utah:
7.2%
Students in private schools in grades 9 to 12 (high school): 30
Here:
1.4%
Utah:
5.3%
Students in private undergraduate colleges: 41
Here:
2.1%
Utah:
26.7%
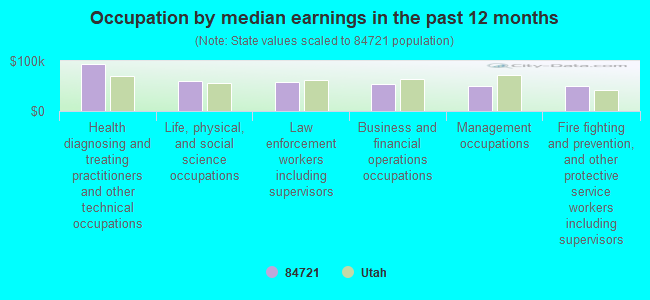
Occupation by median earnings in the past 12 months ($)
93,657Health diagnosing and treating practitioners and other technical occupations
59,501Life, physical, and social science occupations
57,165Law enforcement workers including supervisors
54,625Business and financial operations occupations
50,777Management occupations
50,314Fire fighting and prevention, and other protective service workers including supervisors
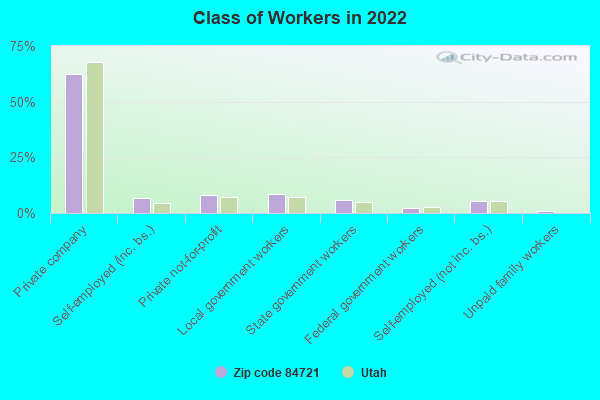
Top industries in this zip code by the number of employees in 2005:
Construction: All Other Specialty Trade Contractors (50-99 employees: 1 establishment, 5-9 employees: 1 establishment, 1-4 employees: 2 establishments)
Accommodation and Food Services: Limited-Service Restaurants (20-49: 1, 10-19: 1)
Health Care and Social Assistance: Offices of Physicians (except Mental Health Specialists) (10-19: 1, 1-4: 1)
Accommodation and Food Services: Full-Service Restaurants (10-19: 1)
Construction: Commercial and Institutional Building Construction (10-19: 1)
Construction: New Single-Family Housing Construction (except Operative Builders) (1-4: 6)
Information: Data Processing, Hosting, and Related Services (5-9: 1)
Fatal accident statistics in 2011:
Fatal accident count: 3
Vehicles involved in fatal accidents: 6
Fatal accidents caused by drunken drivers: 1
Fatalities: 3
Persons involved in fatal accidents: 9
Pedestrians involved in fatal accidents: 0
Fatal accident statistics in 2010:
Fatal accident count: 1
Vehicles involved in fatal accidents: 2
Fatal accidents caused by drunken drivers: 0
Fatalities: 1
Persons involved in fatal accidents: 7
Pedestrians involved in fatal accidents: 0
2008 - 2018 National Fire Incident Reporting System (NFIRS) incidents
According to the data from the years 2008 - 2018 the average number of fires per year is 46. The highest number of reported fires - 87 took place in 2017, and the least - 2 in 2008. The data has an increasing trend.
When looking into fire subcategories, the most reports belonged to: Outside Fires (46.0%), and Structure Fires (36.6%).
Fire incident types reported to NFIRS in Zip Code 84721


 According to the data from the years 2008 - 2018 the average number of fires per year is 46. The highest number of reported fires - 87 took place in 2017, and the least - 2 in 2008. The data has an increasing trend.
 When looking into fire subcategories, the most reports belonged to: Outside Fires (46.0%), and Structure Fires (36.6%).