Estimated zip code population in 2022: 4,856 Zip code population in 2010: 4,111 Zip code population in 2000: 3,126
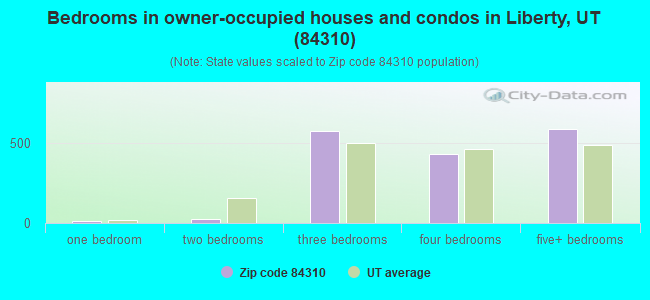
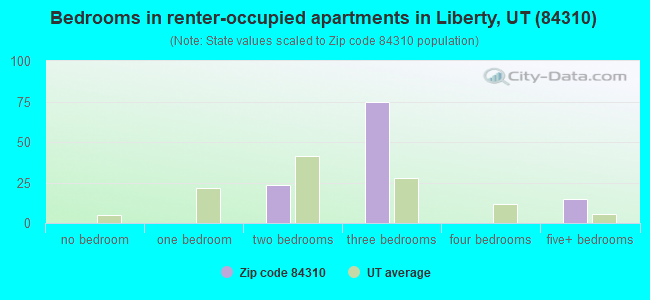
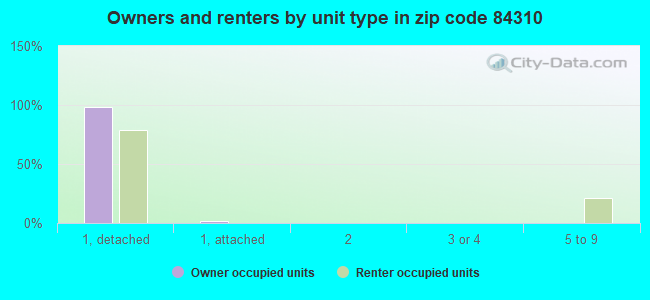
Houses and condos: 2,449 Renter-occupied apartments: 114
% of renters here:
7%
State:
29%
March 2022 cost of living index in zip code 84310: 91.3 (less than average, U.S. average is 100)
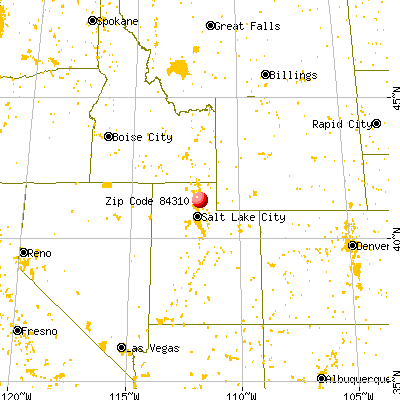
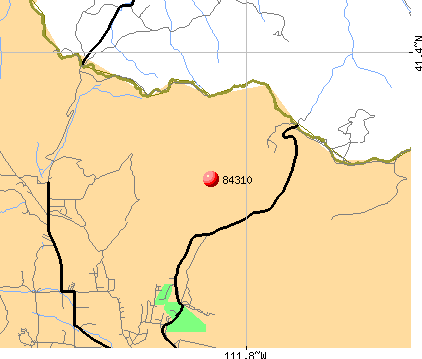
Land area: 112.7 sq. mi. Water area: 1.6 sq. mi.
Population density: 43 people per square mile
(very low).
OSM Map
General Map
Google Map
MSN Map
OSM Map
General Map
Google Map
MSN Map
OSM Map
General Map
Google Map
MSN Map
OSM Map
General Map
Google Map
MSN Map
Please wait while loading the map...
Real estate property taxes paid for housing units in 2022:
This zip code:
0.5% ($3,664)
Utah:
0.5% ($2,376)
Median real estate property taxes paid for housing units with mortgages in 2022: $3,538 (0.4%) Median real estate property taxes paid for housing units with no mortgage in 2022: $3,848 (0.5%)
Business Search- 14 Million verified businesses
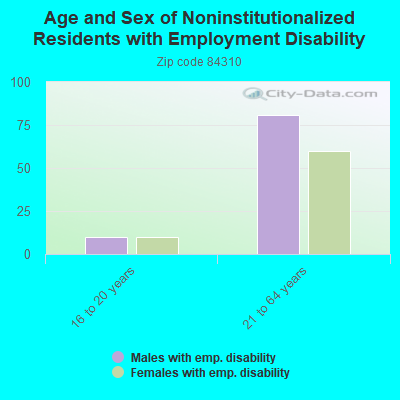
Males: 2,688
(55.4%)
Females: 2,168
(44.6%)
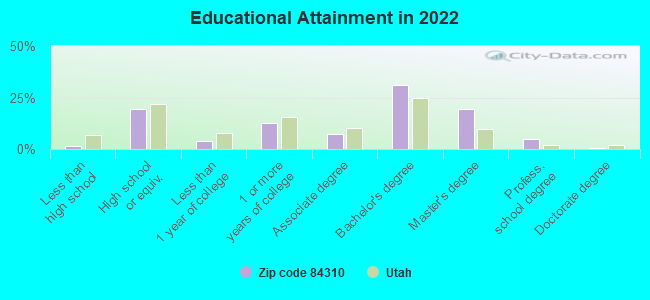
For population 25 years and over in 84310:
High school or higher: 99.5%
Bachelor's degree or higher: 56.2%
Graduate or professional degree: 24.8%
Unemployed: 0.5%
Mean travel time to work (commute): 30.0 minutes
For population 15 years and over in 84310:
Never married: 15.1%
Now married: 76.4%
Separated: 1.4%
Widowed: 1.5%
Divorced: 5.6%
Zip code 84310 compared to state average:
Median household income above state average.
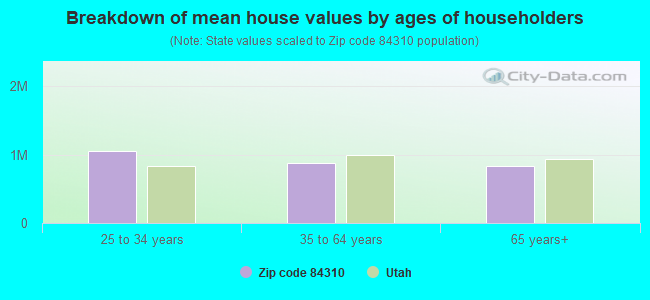
Median house value above state average.
Unemployed percentage significantly below state average.
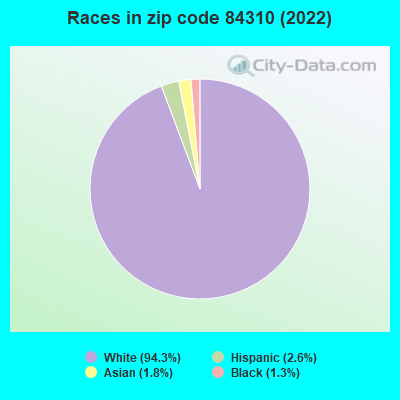
Hispanic race population percentage significantly below state average.
Median age significantly above state average.
Foreign-born population percentage significantly below state average.
Renting percentage significantly below state average.
House age below state average.
Percentage of population with a bachelor's degree or higher above state average.
Estimated median house/condo value in 2022: $808,738
84310:
$808,738
Utah:
$499,500
According to our research of Utah and other state lists, there were 5 registered sex offenders living in 84310 zip code as of June 04, 2024. The ratio of all residents to sex offenders in zip code 84310 is 860 to 1. The ratio of registered sex offenders to all residents in this zip code is lower than the state average.
Median resident age:
This zip code:
40.8 years
Utah median age:
32.1 years
Average household size:
This zip code:
2.8 people
Utah:
3.0 people
Averages for the 2020 tax year for zip code 84310, filed in 2021:
Average Adjusted Gross Income (AGI) in 2020: $133,034 (Individual Income Tax Returns)
Here:
$133,034
State:
$81,660
Salary/wage: $89,120 (reported on 79.5% of returns)
Here:
$89,120
State:
$63,027
(% of AGI for various income ranges: 1340.8% for AGIs below $25k, 3483.5% for AGIs $25k-50k, 6594.7% for AGIs $50k-75k, 9798.6% for AGIs $75k-100k, 20105.2% for AGIs $100k-200k, 83367.8% for AGIs over 200k)
Taxable interest for individuals: $2,758 (reported on 47.0% of returns)
This zip code:
$2,758
Utah:
$2,255
(% of AGI for various income ranges: 26.7% for AGIs below $25k, 90.0% for AGIs $25k-50k, 121.3% for AGIs $50k-75k, 129.3% for AGIs $75k-100k, 325.6% for AGIs $100k-200k, 1654.4% for AGIs over 200k)
Ordinary dividends: $9,209 (reported on 29.1% of returns)
Here:
$9,209
State:
$7,362
(% of AGI for various income ranges: 56.9% for AGIs below $25k, 130.9% for AGIs $25k-50k, 95.3% for AGIs $50k-75k, 306.4% for AGIs $75k-100k, 495.9% for AGIs $100k-200k, 4272.2% for AGIs over 200k)
Net capital gain/loss in AGI: +$30,744 (reported on 30.8% of returns)
Here:
+$30,744
State:
+$43,433
(% of AGI for various income ranges: 67.2% for AGIs below $25k, 169.1% for AGIs $25k-50k, 208.0% for AGIs $50k-75k, 440.7% for AGIs $75k-100k, 1333.7% for AGIs $100k-200k, 18861.1% for AGIs over 200k)
Profit/loss from business: +$19,578 (reported on 21.4% of returns)
Here:
+$19,578
State:
+$9,957
(% of AGI for various income ranges: 135.0% for AGIs below $25k, 217.8% for AGIs $25k-50k, 512.0% for AGIs $50k-75k, 209.3% for AGIs $75k-100k, 585.6% for AGIs $100k-200k, 6844.4% for AGIs over 200k)
Taxable individual retirement arrangement distribution: $25,833 (reported on 12.8% of returns)
84310:
$25,833
Utah:
$21,167
(% of AGI for various income ranges: 52.8% for AGIs below $25k, 229.1% for AGIs $25k-50k, 430.0% for AGIs $50k-75k, 792.9% for AGIs $75k-100k, 1107.0% for AGIs $100k-200k, 2543.3% for AGIs over 200k)
Total itemized deductions: $43,682 (reported on 23.5% of returns)
Here:
$43,682
State:
$41,056
(% of AGI for various income ranges: 397.4% for AGIs $25k-50k, 616.7% for AGIs $50k-75k, 888.6% for AGIs $75k-100k, 2858.5% for AGIs $100k-200k, 14693.3% for AGIs over 200k)
Charity contributions: $17,167 (reported on 19.7% of returns)
Here:
$17,167
State:
$22,261
(% of AGI for various income ranges: 47.8% for AGIs $25k-50k, 107.3% for AGIs $50k-75k, 224.3% for AGIs $75k-100k, 860.0% for AGIs $100k-200k, 5544.4% for AGIs over 200k)
Taxes paid: $8,567 (reported on 23.5% of returns)
84310:
$8,567
State:
$7,985
(% of AGI for various income ranges: 71.3% for AGIs $25k-50k, 148.0% for AGIs $50k-75k, 262.1% for AGIs $75k-100k, 738.5% for AGIs $100k-200k, 2183.3% for AGIs over 200k)
Earned income credit: $1,575 (reported on 5.1% of returns)
Here:
$1,575
State:
$2,169
(% of AGI for various income ranges: 39.2% for AGIs below $25k, 20.9% for AGIs $25k-50k)
Percentage of individuals using paid preparers for their 2020 taxes: 92.3%
Here:
92%
State:
94%
(% for various income ranges: 87.7% for AGIs below $25k, 94.1% for AGIs $25k-50k, 88.5% for AGIs $50k-75k, 95.8% for AGIs $75k-100k, 93.2% for AGIs $100k-200k, 97.1% for AGIs over 200k)
Averages for the 2012 tax year for zip code 84310, filed in 2013:
Average Adjusted Gross Income (AGI) in 2012: $86,720 (Individual Income Tax Returns)
Here:
$86,720
State:
$60,327
Salary/wage: $67,319 (reported on 83.1% of returns)
Here:
$67,319
State:
$48,762
(% of AGI for various income ranges: 70.3% for AGIs below $25k, 72.3% for AGIs $25k-50k, 65.5% for AGIs $50k-75k, 70.2% for AGIs $75k-100k, 70.9% for AGIs $100k-200k, 55.3% for AGIs over 200k)
Taxable interest for individuals: $1,449 (reported on 52.2% of returns)
This zip code:
$1,449
Utah:
$1,534
(% of AGI for various income ranges: 2.2% for AGIs below $25k, 1.8% for AGIs $25k-50k, 0.7% for AGIs $50k-75k, 0.6% for AGIs $75k-100k, 1.0% for AGIs $100k-200k, 0.6% for AGIs over 200k)
Ordinary dividends: $9,188 (reported on 23.6% of returns)
Here:
$9,188
State:
$5,711
(% of AGI for various income ranges: 2.0% for AGIs below $25k, 2.0% for AGIs $25k-50k, 1.7% for AGIs $50k-75k, 1.5% for AGIs $75k-100k, 1.9% for AGIs $100k-200k, 3.7% for AGIs over 200k)
Net capital gain/loss in AGI: +$13,002 (reported on 24.2% of returns)
Here:
+$13,002
State:
+$23,734
(% of AGI for various income ranges: 2.8% for AGIs $75k-100k, 1.9% for AGIs $100k-200k, 8.4% for AGIs over 200k)
Profit/loss from business: +$10,431 (reported on 19.7% of returns)
Here:
+$10,431
State:
+$8,845
(% of AGI for various income ranges: 9.6% for AGIs below $25k, 2.9% for AGIs $25k-50k, 3.3% for AGIs $50k-75k, 0.6% for AGIs $75k-100k, 2.0% for AGIs $100k-200k, 2.2% for AGIs over 200k)
Taxable individual retirement arrangement distribution: $21,368 (reported on 10.7% of returns)
84310:
$21,368
Utah:
$15,565
(% of AGI for various income ranges: 2.1% for AGIs below $25k, 1.7% for AGIs $25k-50k, 3.2% for AGIs $50k-75k, 4.7% for AGIs $75k-100k, 5.2% for AGIs $100k-200k)
Total itemized deductions: $29,230 (21% of AGI, reported on 52.2% of returns)
Here:
$29,230
State:
$25,197
Here:
21.2% of AGI
State:
22.4% of AGI
(% of AGI for various income ranges: 21.3% for AGIs below $25k, 18.7% for AGIs $25k-50k, 20.8% for AGIs $50k-75k, 18.5% for AGIs $75k-100k, 19.6% for AGIs $100k-200k, 14.3% for AGIs over 200k)
Charity contributions: $8,248 (reported on 47.2% of returns)
Here:
$8,248
State:
$8,502
(% of AGI for various income ranges: 1.8% for AGIs below $25k, 3.4% for AGIs $25k-50k, 4.1% for AGIs $50k-75k, 4.8% for AGIs $75k-100k, 5.1% for AGIs $100k-200k, 4.5% for AGIs over 200k)
Taxes paid: $9,074 (reported on 52.2% of returns)
84310:
$9,074
State:
$7,001
(% of AGI for various income ranges: 3.4% for AGIs below $25k, 3.6% for AGIs $25k-50k, 4.9% for AGIs $50k-75k, 5.3% for AGIs $75k-100k, 6.4% for AGIs $100k-200k, 5.6% for AGIs over 200k)
Earned income credit: $1,922 (reported on 10.1% of returns)
Here:
$1,922
State:
$2,259
(% of AGI for various income ranges: 4.5% for AGIs below $25k, 0.7% for AGIs $25k-50k)
Percentage of individuals using paid preparers for their 2012 taxes: 56.7%
Here:
57%
State:
51%
(% for various income ranges: 47.2% for AGIs below $25k, 56.7% for AGIs $25k-50k, 61.5% for AGIs $50k-75k, 60.9% for AGIs $75k-100k, 57.6% for AGIs $100k-200k, 76.9% for AGIs over 200k)
Averages for the 2004 tax year for zip code 84310, filed in 2005:
Average Adjusted Gross Income (AGI) in 2004: $78,739 (Individual Income Tax Returns)
Here:
$78,739
State:
$45,498
Salary/wage: $60,548 (reported on 85.0% of returns)
Here:
$60,548
State:
$38,975
(% of AGI for various income ranges: 76.4% for AGIs $10k-25k, 74.5% for AGIs $25k-50k, 75.9% for AGIs $50k-75k, 75.7% for AGIs $75k-100k, 55.9% for AGIs over 100k)
Taxable interest for individuals: $1,342 (reported on 70.9% of returns)
This zip code:
$1,342
Utah:
$1,445
(% of AGI for various income ranges: 1.3% for AGIs $10k-25k, 1.8% for AGIs $25k-50k, 1.2% for AGIs $50k-75k, 0.8% for AGIs $75k-100k, 1.2% for AGIs over 100k)
Taxable dividends: $3,319 (reported on 28.0% of returns)
Here:
$3,319
State:
$3,152
(% of AGI for various income ranges: 1.2% for AGIs $10k-25k, 1.9% for AGIs $25k-50k, 0.8% for AGIs $50k-75k, 0.5% for AGIs $75k-100k, 1.4% for AGIs over 100k)
Net capital gain/loss: +$11,530 (reported on 27.8% of returns)
Here:
+$11,530
State:
+$14,059
(% of AGI for various income ranges: 0.1% for AGIs $10k-25k, 1.7% for AGIs $25k-50k, 0.4% for AGIs $50k-75k, 2.6% for AGIs $75k-100k, 6.5% for AGIs over 100k)
Profit/loss from business: +$7,425 (reported on 20.0% of returns)
Here:
+$7,425
State:
+$6,903
(% of AGI for various income ranges: 4.2% for AGIs $10k-25k, 3.1% for AGIs $25k-50k, 1.8% for AGIs $50k-75k, 1.3% for AGIs $75k-100k, 1.7% for AGIs over 100k)
IRA payment deduction: $3,298 (reported on 3.4% of returns)
84310:
$3,298
Utah:
$2,970
Self-employed pension: $12,929 (reported on 1.0% of returns)
Here:
$12,929
Utah:
$14,916
Total itemized deductions: $22,520 (23% of AGI, reported on 65.0% of returns)
Here:
$22,520
State:
$20,312
Here:
22.5% of AGI
State:
24.9% of AGI
(% of AGI for various income ranges: 16.0% for AGIs $10k-25k, 22.4% for AGIs $25k-50k, 24.1% for AGIs $50k-75k, 21.1% for AGIs $75k-100k, 15.5% for AGIs over 100k)
Charity contributions deductions: $6,149 (6% of AGI, reported on 60.3% of returns)
Here:
$6,149
State:
$6,250
Here:
6.0% of AGI
State:
7.4% of AGI
(% of AGI for various income ranges: 2.8% for AGIs $10k-25k, 4.5% for AGIs $25k-50k, 5.2% for AGIs $50k-75k, 4.7% for AGIs $75k-100k, 4.8% for AGIs over 100k)
Total tax: $11,575 (reported on 89.2% of returns)
84310:
$11,575
State:
$6,523
(% of AGI for various income ranges: 5.4% for AGIs $10k-25k, 5.9% for AGIs $25k-50k, 7.2% for AGIs $50k-75k, 9.7% for AGIs $75k-100k, 18.2% for AGIs over 100k)
Earned income credit: $1,940 (reported on 4.9% of returns)
Here:
$1,940
State:
$1,703
Percentage of individuals using paid preparers for their 2004 taxes: 57.0%
Here:
57%
State:
53%
(% for various income ranges: 50.0% for AGIs $10k-25k, 55.0% for AGIs $25k-50k, 64.9% for AGIs $50k-75k, 54.8% for AGIs $75k-100k, 62.9% for AGIs over 100k)
Household received Food Stamps/SNAP in the past 12 months: 12 Household did not receive Food Stamps/SNAP in the past 12 months: 1,712
Women who had a birth in the past 12 months: 81 (82 now married, 0 unmarried) Women who did not have a birth in the past 12 months: 712 (539 now married, 166 unmarried)
Housing units in zip code 84310 with a mortgage: 1,013 (250 second mortgage, 9 home equity loan, 240 both second mortgage and home equity loan) Houses without a mortgage: 60
Median monthly owner costs for units with a mortgage: $2,586 Median monthly owner costs for units without a mortgage: $688
Residents with income below the poverty level in 2022:
This zip code:
3.7%
Whole state:
8.2%
Residents with income below 50% of the poverty level in 2022:
This zip code:
1.3%
Whole state:
4.3%
Median number of rooms in houses and condos:
Here:
7.6
State:
7.6
Median number of rooms in apartments:
Here:
4.2
State:
4.3
Notable locations in this zip code not listed on our city pages
Notable locations in zip code 84310: North Arm Campground (A), North Ogden Canyon Trail Head (B), Nordic Valley Ski Area (C), Ben Lomond Camp (D), Lakeview Camp (E), The Point Picnic Area (F), Camp Browning (G), North Ogden Divide Trailhead (H), Cold Water Picnic Area (I), Wolf Creek Country Club (J), Camp Lamondi (K), Camp Utaba (L), Weber Fire District Station 62 (M). Display/hide their locations on the map
Rivers and creeks: Gertsen Creek (A), Durfee Creek (B), Sheep Creek (C), Union Creek (D), Thimbleberry Creek (E), Rattlesnake Creek (F), North Fork Ogden River (G), Wolf Creek (H), Cutler Creek (I). Display/hide their locations on the map
In group quarters: 24 (-1 institutionalized population)
Size of family households: 802 2-persons, 126 3-persons, 150 4-persons, 136 5-persons, 87 6-persons, 110 7-or-more-persons
Size of nonfamily households: 288 1-person, 9 2-persons
1,126 married couples with children.
0 single-parent households ().
95.8% of residents of 84310 zip code speak English at home.
2.2% of residents speak Spanish at home (78% very well, 22% well).
2.0% of residents speak other Indo-European language at home (56% very well, 44% not well).
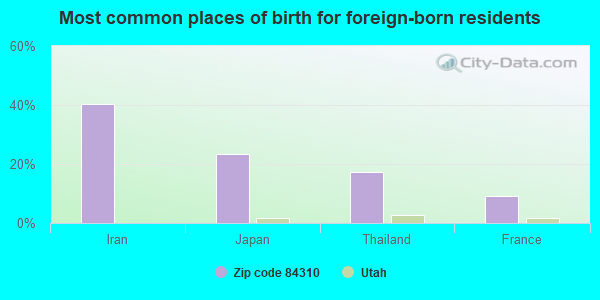
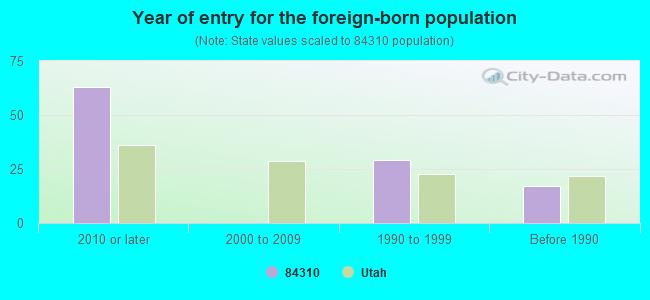
Foreign born population: 98 (2.0%) (64.6% of them are naturalized citizens)
This zip code:
2.0%
Whole state:
8.6%
40%Iran
23%Japan
17%Thailand
9%France
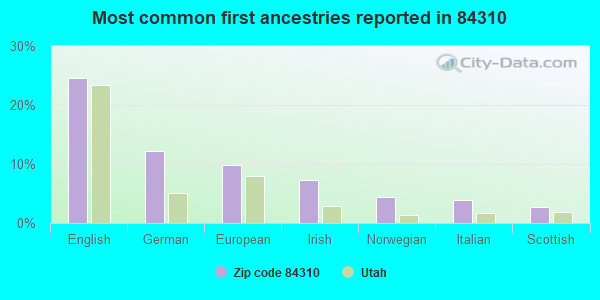
25%English
12%German
10%European
7%Irish
4%Norwegian
4%Italian
3%Scottish
Year of entry for the foreign-born population
632010 or later
02000 to 2009
291990 to 1999
17Before 1990
Housing units lacking complete plumbing facilities: 1.9% Housing units lacking complete kitchen facilities: 3.3%
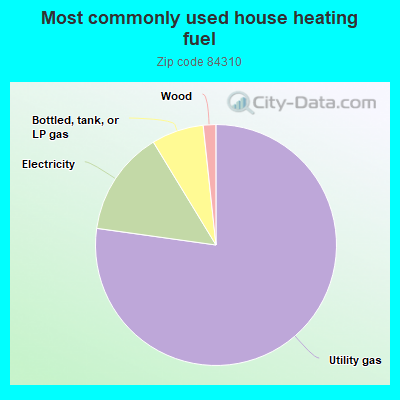
77.3%Utility gas
14.1%Electricity
7.0%Bottled, tank, or LP gas
1.7%Wood
Population in 1990: 1,707. Population change in the 1990s: +1,419 (+83.1%).
Place of birth for U.S.-born residents:
This state: 2,576
Northeast: 207
Midwest: 558
South: 686
West: 728
59% of the 84310 zip code residents lived in the same house 5 years ago. Out of people who lived in different houses, 49% lived in this county. Out of people who lived in different counties, 50% lived in Utah.
94% of the 84310 zip code residents lived in the same house 1 year ago. Out of people who lived in different houses, 5% moved from this county. Out of people who lived in different houses, 62% moved from different county within same state. Out of people who lived in different houses, 27% moved from different state. Out of people who lived in different houses, 20% moved from abroad.
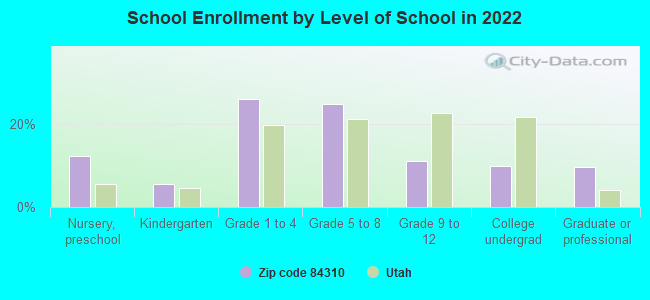
Private vs. public school enrollment:
Students in private schools in grades 1 to 8 (elementary and middle school): 38
Here:
6.2%
Utah:
7.2%
Students in private schools in grades 9 to 12 (high school): 23
Here:
17.5%
Utah:
5.3%
Students in private undergraduate colleges: 28
Here:
23.2%
Utah:
26.7%
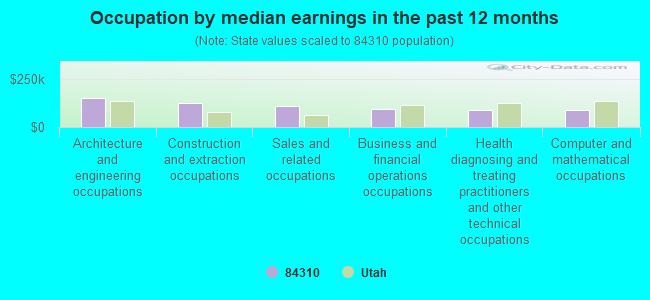
Occupation by median earnings in the past 12 months ($)
151,739Architecture and engineering occupations
124,829Construction and extraction occupations
106,424Sales and related occupations
91,938Business and financial operations occupations
88,994Health diagnosing and treating practitioners and other technical occupations
85,993Computer and mathematical occupations
Companies with federal contracts located in this zip code (EDEN, UT):
TRIHILLS LLC (2815 N 5100 E; small business) : $140,282 in 3 contractsfrom 2003 to 2005
$105,082 with Air Force for Aircraft Ground Servicing Equipment. Signed on 2003-09-30. Completion date: 2004-03-12.
$28,600 with Air Force for Aircraft Maintenance and Repair Shop Specialized Equipment. Signed on 2004-07-13. Completion date: 2004-11-18.
$6,600, same as above.Signed on 2005-02-15. Completion date: 2004-11-18.
WITT, DEREK (3245 N RIVER DR; small business)
$45,000 with Air Force for Other Management Support Services. Signed on 2005-04-07. Completion date: 2006-03-31.
IN HOT WATER SYSTEMS (2639 N 3750 E; small business) : $28,953 in 3 contractsin 2005
$27,129 with Army for Solar Electric Power Systems. Signed on 2005-07-27. Completion date: 2005-09-01.
$1,824, same as above.Signed on 2005-12-19. Completion date: 2005-12-22.
$0, same as above.Signed on 2005-12-19. Completion date: 2005-12-22.
RAPID TOOL LLC (3839 N RIVER DR; small business) : $20,750 in 2 contractsfrom 2005 to 2006
$16,565 with Air Force for Miscellaneous Electrical and Electronic Components. Signed on 2005-02-04. Completion date: 2005-03-16.
$4,185 with Air Force for Plate, Sheet, Strip, and Foil; Nonferrous Base Metal. Signed on 2006-05-15. Completion date: 2006-05-30.
WOLF CREEK RESORT (3900 N WOLF CREEK DR; small business)
$5,000 with Air Force for Chaplain Services. Signed on 2006-07-06. Completion date: 2006-07-23.
Top industries in this zip code by the number of employees in 2005:
Accommodation and Food Services: Hotels (except Casino Hotels) and Motels (250-499 employees: 1 establishment, 5-9 employees: 1 establishment)
Other Services (except Public Administration): Religious Organizations (10-19: 1, 1-4: 1)
Other Services (except Public Administration): Other Similar Organizations (except Business, Professional, Labor, and Political Organizations) (5-9: 2, 1-4: 1)
Fatal accident statistics in 2012:
Fatal accident count: 1
Vehicles involved in fatal accidents: 1
Fatal accidents caused by drunken drivers: 0
Fatalities: 1
Persons involved in fatal accidents: 1
Pedestrians involved in fatal accidents: 0
Home Mortgage Disclosure Act Aggregated Statistics For Year 2009 (Based on 2 partial tracts)
A) FHA, FSA/RHS & VA Home Purchase Loans
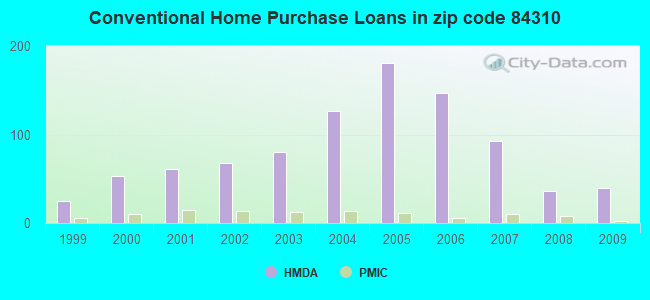
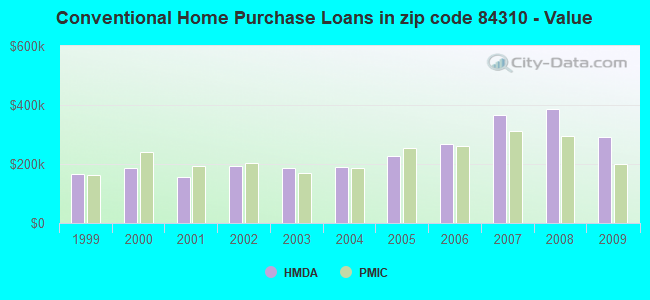
B) Conventional Home Purchase Loans
C) Refinancings
D) Home Improvement Loans
F) Non-occupant Loans on < 5 Family Dwellings (A B C & D)
G) Loans On Manufactured Home Dwelling (A B C & D)
Number
Average Value
Number
Average Value
Number
Average Value
Number
Average Value
Number
Average Value
Number
Average Value
LOANS ORIGINATED
7
$256,623
39
$291,599
195
$255,395
6
$168,300
58
$270,744
1
$143,310
APPLICATIONS APPROVED, NOT ACCEPTED
1
$302,060
7
$333,554
18
$247,305
1
$90,400
8
$260,304
0
$0
APPLICATIONS DENIED
1
$144,410
14
$247,410
75
$385,098
5
$88,964
34
$296,140
3
$138,167
APPLICATIONS WITHDRAWN
3
$291,033
8
$513,719
34
$289,039
1
$90,400
6
$210,927
1
$70,000
FILES CLOSED FOR INCOMPLETENESS
0
$0
1
$374,820
6
$265,403
1
$214,970
2
$332,925
0
$0
Aggregated Statistics For Year 2008 (Based on 2 partial tracts)
A) FHA, FSA/RHS & VA Home Purchase Loans
B) Conventional Home Purchase Loans
C) Refinancings
D) Home Improvement Loans
F) Non-occupant Loans on < 5 Family Dwellings (A B C & D)
G) Loans On Manufactured Home Dwelling (A B C & D)
Number
Average Value
Number
Average Value
Number
Average Value
Number
Average Value
Number
Average Value
Number
Average Value
LOANS ORIGINATED
3
$262,553
36
$386,483
115
$264,571
10
$182,723
39
$364,852
2
$186,030
APPLICATIONS APPROVED, NOT ACCEPTED
0
$0
3
$341,560
16
$266,815
0
$0
3
$459,700
0
$0
APPLICATIONS DENIED
0
$0
12
$433,381
39
$399,394
4
$207,390
23
$433,866
1
$140,560
APPLICATIONS WITHDRAWN
0
$0
6
$269,445
24
$347,348
2
$131,185
8
$275,394
0
$0
FILES CLOSED FOR INCOMPLETENESS
0
$0
1
$110,240
2
$371,235
1
$27,560
2
$249,970
0
$0
Aggregated Statistics For Year 2007 (Based on 2 partial tracts)
A) FHA, FSA/RHS & VA Home Purchase Loans
B) Conventional Home Purchase Loans
C) Refinancings
D) Home Improvement Loans
E) Loans on Dwellings For 5+ Families
F) Non-occupant Loans on < 5 Family Dwellings (A B C & D)
G) Loans On Manufactured Home Dwelling (A B C & D)
Number
Average Value
Number
Average Value
Number
Average Value
Number
Average Value
Number
Average Value
Number
Average Value
Number
Average Value
LOANS ORIGINATED
1
$293,240
93
$366,827
136
$283,795
14
$141,304
0
$0
78
$358,633
2
$152,405
APPLICATIONS APPROVED, NOT ACCEPTED
0
$0
20
$312,310
26
$326,650
3
$112,630
0
$0
15
$332,888
1
$116,850
APPLICATIONS DENIED
0
$0
36
$464,248
49
$389,788
4
$124,710
1
$180,240
30
$382,680
2
$208,080
APPLICATIONS WITHDRAWN
1
$128,430
8
$521,021
22
$337,785
0
$0
0
$0
7
$451,669
1
$118,510
FILES CLOSED FOR INCOMPLETENESS
0
$0
1
$66,140
8
$348,634
1
$28,660
0
$0
3
$246,203
0
$0
Aggregated Statistics For Year 2006 (Based on 2 partial tracts)
A) FHA, FSA/RHS & VA Home Purchase Loans
B) Conventional Home Purchase Loans
C) Refinancings
D) Home Improvement Loans
F) Non-occupant Loans on < 5 Family Dwellings (A B C & D)
G) Loans On Manufactured Home Dwelling (A B C & D)
Number
Average Value
Number
Average Value
Number
Average Value
Number
Average Value
Number
Average Value
Number
Average Value
LOANS ORIGINATED
1
$59,530
147
$268,018
147
$272,162
25
$111,960
119
$269,898
2
$103,075
APPLICATIONS APPROVED, NOT ACCEPTED
0
$0
20
$328,846
21
$415,473
4
$108,588
12
$414,824
1
$40,790
APPLICATIONS DENIED
0
$0
40
$279,996
56
$317,137
4
$140,142
30
$259,137
2
$333,750
APPLICATIONS WITHDRAWN
0
$0
15
$295,002
37
$288,158
1
$110,240
7
$315,444
0
$0
FILES CLOSED FOR INCOMPLETENESS
0
$0
2
$260,440
10
$317,546
1
$69,450
1
$150,480
0
$0
Aggregated Statistics For Year 2005 (Based on 2 partial tracts)
A) FHA, FSA/RHS & VA Home Purchase Loans
B) Conventional Home Purchase Loans
C) Refinancings
D) Home Improvement Loans
F) Non-occupant Loans on < 5 Family Dwellings (A B C & D)
G) Loans On Manufactured Home Dwelling (A B C & D)
Number
Average Value
Number
Average Value
Number
Average Value
Number
Average Value
Number
Average Value
Number
Average Value
LOANS ORIGINATED
1
$47,950
181
$228,766
138
$204,160
10
$71,050
110
$223,256
1
$81,580
APPLICATIONS APPROVED, NOT ACCEPTED
0
$0
31
$237,869
28
$232,823
1
$48,510
17
$238,442
0
$0
APPLICATIONS DENIED
0
$0
44
$278,970
49
$223,506
8
$175,901
18
$222,899
0
$0
APPLICATIONS WITHDRAWN
1
$140,000
32
$212,660
39
$210,262
1
$130,630
18
$254,808
1
$121,820
FILES CLOSED FOR INCOMPLETENESS
0
$0
6
$267,057
10
$239,000
1
$137,800
1
$214,970
0
$0
Aggregated Statistics For Year 2004 (Based on 2 partial tracts)
A) FHA, FSA/RHS & VA Home Purchase Loans
B) Conventional Home Purchase Loans
C) Refinancings
D) Home Improvement Loans
F) Non-occupant Loans on < 5 Family Dwellings (A B C & D)
G) Loans On Manufactured Home Dwelling (A B C & D)
Number
Average Value
Number
Average Value
Number
Average Value
Number
Average Value
Number
Average Value
Number
Average Value
LOANS ORIGINATED
3
$199,350
126
$188,458
144
$202,834
8
$80,612
66
$191,776
1
$85,990
APPLICATIONS APPROVED, NOT ACCEPTED
0
$0
23
$228,125
28
$214,496
2
$93,155
14
$204,929
0
$0
APPLICATIONS DENIED
1
$203,940
44
$239,108
58
$195,628
4
$55,258
15
$178,809
1
$96,460
APPLICATIONS WITHDRAWN
0
$0
23
$172,358
43
$196,932
1
$68,900
13
$187,112
1
$94,810
FILES CLOSED FOR INCOMPLETENESS
1
$59,530
5
$180,904
15
$198,616
1
$29,210
1
$218,280
0
$0
Aggregated Statistics For Year 2003 (Based on 2 partial tracts)
A) FHA, FSA/RHS & VA Home Purchase Loans
B) Conventional Home Purchase Loans
C) Refinancings
D) Home Improvement Loans
F) Non-occupant Loans on < 5 Family Dwellings (A B C & D)
Number
Average Value
Number
Average Value
Number
Average Value
Number
Average Value
Number
Average Value
LOANS ORIGINATED
4
$165,360
80
$186,850
308
$172,726
8
$70,140
63
$188,248
APPLICATIONS APPROVED, NOT ACCEPTED
1
$131,190
8
$256,033
46
$208,677
2
$38,035
6
$175,742
APPLICATIONS DENIED
1
$139,450
24
$232,308
72
$226,168
1
$122,920
13
$155,608
APPLICATIONS WITHDRAWN
1
$159,300
18
$200,667
47
$224,960
1
$11,580
8
$183,274
FILES CLOSED FOR INCOMPLETENESS
0
$0
8
$153,371
16
$235,534
0
$0
5
$118,288
Aggregated Statistics For Year 2002 (Based on 2 partial tracts)
A) FHA, FSA/RHS & VA Home Purchase Loans
B) Conventional Home Purchase Loans
C) Refinancings
D) Home Improvement Loans
F) Non-occupant Loans on < 5 Family Dwellings (A B C & D)
Number
Average Value
Number
Average Value
Number
Average Value
Number
Average Value
Number
Average Value
LOANS ORIGINATED
5
$154,556
68
$194,176
225
$174,726
7
$21,733
46
$154,360
APPLICATIONS APPROVED, NOT ACCEPTED
0
$0
6
$241,885
23
$200,469
3
$24,987
4
$186,720
APPLICATIONS DENIED
2
$108,860
21
$214,128
34
$211,174
4
$24,252
11
$167,064
APPLICATIONS WITHDRAWN
0
$0
7
$216,149
50
$193,240
2
$39,410
6
$174,730
FILES CLOSED FOR INCOMPLETENESS
0
$0
7
$169,849
13
$218,912
0
$0
3
$305,917
Aggregated Statistics For Year 2001 (Based on 2 partial tracts)
A) FHA, FSA/RHS & VA Home Purchase Loans
B) Conventional Home Purchase Loans
C) Refinancings
D) Home Improvement Loans
F) Non-occupant Loans on < 5 Family Dwellings (A B C & D)
Number
Average Value
Number
Average Value
Number
Average Value
Number
Average Value
Number
Average Value
LOANS ORIGINATED
2
$92,050
61
$157,408
187
$171,895
15
$31,492
33
$127,394
APPLICATIONS APPROVED, NOT ACCEPTED
0
$0
12
$150,156
28
$156,068
1
$11,020
7
$137,091
APPLICATIONS DENIED
1
$52,920
7
$187,014
50
$195,103
4
$46,852
3
$164,257
APPLICATIONS WITHDRAWN
0
$0
10
$160,730
36
$206,853
1
$19,290
4
$120,300
FILES CLOSED FOR INCOMPLETENESS
0
$0
5
$174,400
7
$210,873
1
$24,800
2
$109,965
Aggregated Statistics For Year 2000 (Based on 2 partial tracts)
A) FHA, FSA/RHS & VA Home Purchase Loans
B) Conventional Home Purchase Loans
C) Refinancings
D) Home Improvement Loans
F) Non-occupant Loans on < 5 Family Dwellings (A B C & D)
Number
Average Value
Number
Average Value
Number
Average Value
Number
Average Value
Number
Average Value
LOANS ORIGINATED
4
$150,890
53
$187,554
70
$168,675
9
$47,709
15
$158,341
APPLICATIONS APPROVED, NOT ACCEPTED
0
$0
7
$201,897
11
$177,235
2
$38,585
3
$178,407
APPLICATIONS DENIED
0
$0
22
$343,949
31
$241,585
4
$77,030
6
$177,853
APPLICATIONS WITHDRAWN
0
$0
8
$231,711
24
$251,324
2
$33,070
2
$112,445
FILES CLOSED FOR INCOMPLETENESS
0
$0
7
$232,370
8
$212,142
0
$0
2
$271,190
Aggregated Statistics For Year 1999 (Based on 1 partial tract)
A) FHA, FSA/RHS & VA Home Purchase Loans
B) Conventional Home Purchase Loans
C) Refinancings
D) Home Improvement Loans
F) Non-occupant Loans on < 5 Family Dwellings (A B C & D)
Detailed PMIC statistics for the following Tracts:2101.00
2002 - 2018 National Fire Incident Reporting System (NFIRS) incidents
Based on the data from the years 2002 - 2018 the average number of fire incidents per year is 15. The highest number of fires - 26 took place in 2014, and the least - 1 in 2010. The data has a growing trend.
When looking into fire subcategories, the most incidents belonged to: Outside Fires (50.8%), and Structure Fires (20.0%).
Fire incident types reported to NFIRS in Zip Code 84310


 Nearest zip codes: 84414, 84403, 84324, 84340, 84328, 84405.
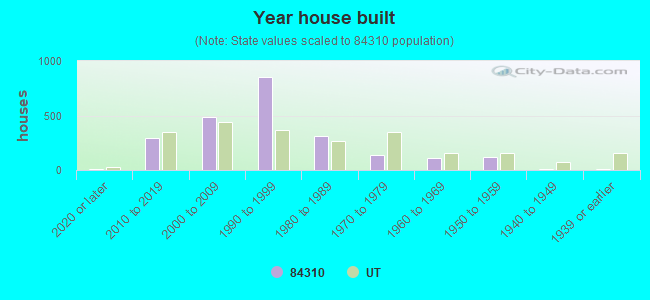


 : $140,282 in 3 contracts from 2003 to 2005
 Based on the data from the years 2002 - 2018 the average number of fire incidents per year is 15. The highest number of fires - 26 took place in 2014, and the least - 1 in 2010. The data has a growing trend.
 When looking into fire subcategories, the most incidents belonged to: Outside Fires (50.8%), and Structure Fires (20.0%).