Estimated zip code population in 2022: 5,393 Zip code population in 2010: 4,716 Zip code population in 2000: 4,486
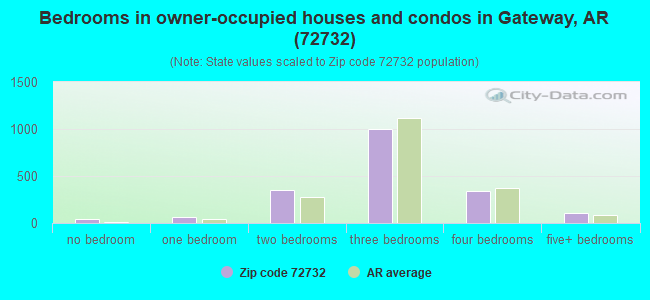
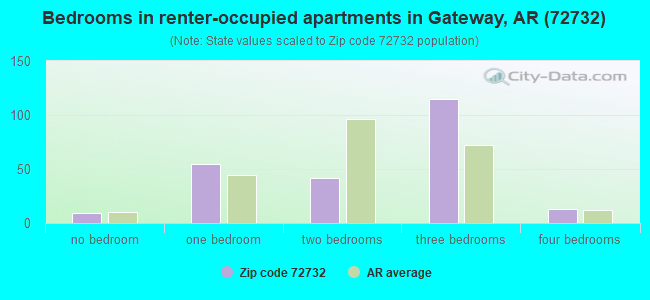
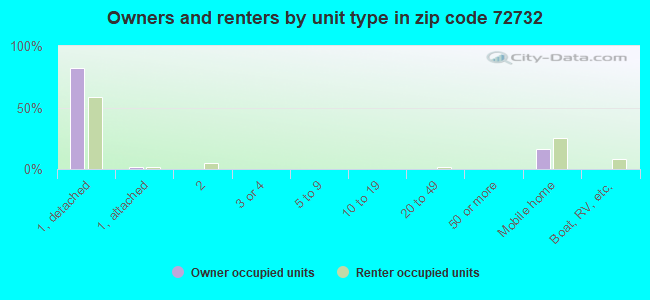
Houses and condos: 2,852 Renter-occupied apartments: 237
% of renters here:
11%
State:
34%
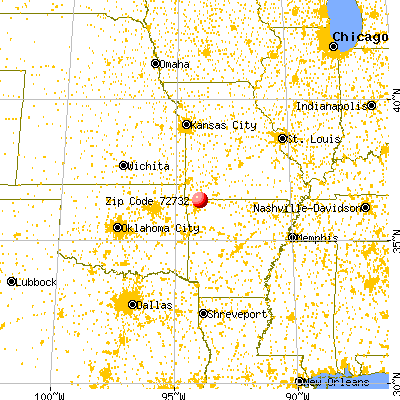
March 2022 cost of living index in zip code 72732: 80.3 (low, U.S. average is 100)
Land area: 85.1 sq. mi. Water area: 12.7 sq. mi.
Population density: 63 people per square mile
(very low).
OSM Map
General Map
Google Map
MSN Map
OSM Map
General Map
Google Map
MSN Map
OSM Map
General Map
Google Map
MSN Map
OSM Map
General Map
Google Map
MSN Map
Please wait while loading the map...
Real estate property taxes paid for housing units in 2022:
This zip code:
0.5% ($1,255)
Arkansas:
0.5% ($977)
Median real estate property taxes paid for housing units with mortgages in 2022: $1,319 (0.4%) Median real estate property taxes paid for housing units with no mortgage in 2022: $1,204 (0.6%)
Averages for the 2020 tax year for zip code 72732, filed in 2021:
Average Adjusted Gross Income (AGI) in 2020: $76,385 (Individual Income Tax Returns)
Here:
$76,385
State:
$64,872
Salary/wage: $60,630 (reported on 78.7% of returns)
Here:
$60,630
State:
$50,644
(% of AGI for various income ranges: 1144.8% for AGIs below $25k, 3673.1% for AGIs $25k-50k, 5992.7% for AGIs $50k-75k, 9241.5% for AGIs $75k-100k, 17097.1% for AGIs $100k-200k, 81392.5% for AGIs over 200k)
Taxable interest for individuals: $1,647 (reported on 30.6% of returns)
This zip code:
$1,647
Arkansas:
$1,857
(% of AGI for various income ranges: 31.7% for AGIs below $25k, 42.1% for AGIs $25k-50k, 22.3% for AGIs $50k-75k, 43.1% for AGIs $75k-100k, 190.7% for AGIs $100k-200k, 932.5% for AGIs over 200k)
Ordinary dividends: $6,229 (reported on 20.8% of returns)
Here:
$6,229
State:
$21,681
(% of AGI for various income ranges: 23.8% for AGIs below $25k, 24.0% for AGIs $25k-50k, 72.3% for AGIs $50k-75k, 156.9% for AGIs $75k-100k, 404.3% for AGIs $100k-200k, 4122.5% for AGIs over 200k)
Net capital gain/loss in AGI: +$32,810 (reported on 19.4% of returns)
Here:
+$32,810
State:
+$22,815
(% of AGI for various income ranges: 11.3% for AGIs below $25k, 53.6% for AGIs $25k-50k, 159.5% for AGIs $50k-75k, 439.2% for AGIs $75k-100k, 864.3% for AGIs $100k-200k, 28410.0% for AGIs over 200k)
Profit/loss from business: +$9,709 (reported on 19.9% of returns)
Here:
+$9,709
State:
+$9,743
(% of AGI for various income ranges: 260.0% for AGIs below $25k, 216.4% for AGIs $25k-50k, 223.2% for AGIs $50k-75k, 393.8% for AGIs $75k-100k, 336.4% for AGIs $100k-200k, 1100.0% for AGIs over 200k)
Taxable individual retirement arrangement distribution: $21,408 (reported on 11.6% of returns)
72732:
$21,408
Arkansas:
$18,502
(% of AGI for various income ranges: 48.1% for AGIs below $25k, 152.6% for AGIs $25k-50k, 317.7% for AGIs $50k-75k, 551.5% for AGIs $75k-100k, 2175.0% for AGIs $100k-200k)
Total itemized deductions: $36,207 (reported on 6.5% of returns)
Here:
$36,207
State:
$52,840
(% of AGI for various income ranges: 656.4% for AGIs $50k-75k, 927.9% for AGIs $100k-200k, 5815.0% for AGIs over 200k)
Charity contributions: $14,800 (reported on 4.6% of returns)
Here:
$14,800
State:
$35,735
(% of AGI for various income ranges: 105.5% for AGIs $50k-75k, 257.1% for AGIs $100k-200k, 2220.0% for AGIs over 200k)
Taxes paid: $7,721 (reported on 6.5% of returns)
72732:
$7,721
State:
$7,196
(% of AGI for various income ranges: 101.4% for AGIs $50k-75k, 244.3% for AGIs $100k-200k, 1290.0% for AGIs over 200k)
Earned income credit: $2,505 (reported on 19.0% of returns)
Here:
$2,505
State:
$2,546
(% of AGI for various income ranges: 120.2% for AGIs below $25k, 95.7% for AGIs $25k-50k)
Percentage of individuals using paid preparers for their 2020 taxes: 94.9%
Here:
95%
State:
94%
(% for various income ranges: 94.4% for AGIs below $25k, 94.6% for AGIs $25k-50k, 96.6% for AGIs $50k-75k, 95.0% for AGIs $75k-100k, 92.6% for AGIs $100k-200k, 100.0% for AGIs over 200k)
Averages for the 2012 tax year for zip code 72732, filed in 2013:
Average Adjusted Gross Income (AGI) in 2012: $57,976 (Individual Income Tax Returns)
Here:
$57,976
State:
$52,148
Salary/wage: $47,610 (reported on 79.9% of returns)
Here:
$47,610
State:
$41,669
(% of AGI for various income ranges: 72.2% for AGIs below $25k, 71.5% for AGIs $25k-50k, 73.0% for AGIs $50k-75k, 65.0% for AGIs $75k-100k, 67.8% for AGIs $100k-200k, 53.7% for AGIs over 200k)
Taxable interest for individuals: $1,371 (reported on 32.5% of returns)
This zip code:
$1,371
Arkansas:
$1,648
(% of AGI for various income ranges: 1.6% for AGIs below $25k, 0.9% for AGIs $25k-50k, 0.5% for AGIs $50k-75k, 0.5% for AGIs $75k-100k, 0.7% for AGIs $100k-200k, 0.8% for AGIs over 200k)
Ordinary dividends: $2,885 (reported on 23.1% of returns)
Here:
$2,885
State:
$20,675
(% of AGI for various income ranges: 1.8% for AGIs below $25k, 0.8% for AGIs $25k-50k, 1.2% for AGIs $50k-75k, 0.7% for AGIs $75k-100k, 0.6% for AGIs $100k-200k, 1.9% for AGIs over 200k)
Net capital gain/loss in AGI: +$7,578 (reported on 21.3% of returns)
Here:
+$7,578
State:
+$15,222
(% of AGI for various income ranges: 1.4% for AGIs $25k-50k, 0.9% for AGIs $50k-75k, 0.5% for AGIs $75k-100k, 3.0% for AGIs $100k-200k, 7.0% for AGIs over 200k)
Profit/loss from business: +$7,422 (reported on 18.9% of returns)
Here:
+$7,422
State:
+$9,665
(% of AGI for various income ranges: 8.5% for AGIs below $25k, 4.2% for AGIs $25k-50k, 3.4% for AGIs $50k-75k, 1.1% for AGIs $75k-100k, 1.8% for AGIs $100k-200k)
Taxable individual retirement arrangement distribution: $17,440 (reported on 14.8% of returns)
72732:
$17,440
Arkansas:
$13,644
(% of AGI for various income ranges: 4.8% for AGIs below $25k, 4.4% for AGIs $25k-50k, 3.2% for AGIs $50k-75k, 4.9% for AGIs $75k-100k, 6.4% for AGIs $100k-200k, 3.2% for AGIs over 200k)
Total itemized deductions: $23,077 (20% of AGI, reported on 31.4% of returns)
Here:
$23,077
State:
$23,276
Here:
20.5% of AGI
State:
19.1% of AGI
(% of AGI for various income ranges: 9.8% for AGIs below $25k, 10.6% for AGIs $25k-50k, 11.7% for AGIs $50k-75k, 12.9% for AGIs $75k-100k, 14.7% for AGIs $100k-200k, 12.9% for AGIs over 200k)
Charity contributions: $4,498 (reported on 24.3% of returns)
Here:
$4,498
State:
$5,996
(% of AGI for various income ranges: 1.4% for AGIs below $25k, 1.3% for AGIs $25k-50k, 1.5% for AGIs $50k-75k, 2.6% for AGIs $75k-100k, 2.0% for AGIs $100k-200k, 2.2% for AGIs over 200k)
Taxes paid: $7,508 (reported on 31.4% of returns)
72732:
$7,508
State:
$7,941
(% of AGI for various income ranges: 1.6% for AGIs below $25k, 2.3% for AGIs $25k-50k, 2.7% for AGIs $50k-75k, 4.1% for AGIs $75k-100k, 5.6% for AGIs $100k-200k, 5.4% for AGIs over 200k)
Earned income credit: $2,311 (reported on 21.3% of returns)
Here:
$2,311
State:
$2,455
(% of AGI for various income ranges: 7.3% for AGIs below $25k, 1.6% for AGIs $25k-50k)
Percentage of individuals using paid preparers for their 2012 taxes: 66.9%
Here:
67%
State:
61%
(% for various income ranges: 61.5% for AGIs below $25k, 65.9% for AGIs $25k-50k, 72.0% for AGIs $50k-75k, 70.6% for AGIs $75k-100k, 73.3% for AGIs $100k-200k, 83.3% for AGIs over 200k)
Averages for the 2004 tax year for zip code 72732, filed in 2005:
Average Adjusted Gross Income (AGI) in 2004: $40,556 (Individual Income Tax Returns)
Here:
$40,556
State:
$39,270
Salary/wage: $36,208 (reported on 80.8% of returns)
Here:
$36,208
State:
$34,079
(% of AGI for various income ranges: 96.9% for AGIs below $10k, 73.7% for AGIs $10k-25k, 79.7% for AGIs $25k-50k, 73.9% for AGIs $50k-75k, 72.6% for AGIs $75k-100k, 61.3% for AGIs over 100k)
Taxable interest for individuals: $1,883 (reported on 37.0% of returns)
This zip code:
$1,883
Arkansas:
$1,904
(% of AGI for various income ranges: 5.1% for AGIs below $10k, 2.3% for AGIs $10k-25k, 1.6% for AGIs $25k-50k, 1.9% for AGIs $50k-75k, 1.8% for AGIs $75k-100k, 1.2% for AGIs over 100k)
Taxable dividends: $2,090 (reported on 25.0% of returns)
Here:
$2,090
State:
$5,995
(% of AGI for various income ranges: 3.6% for AGIs below $10k, 1.5% for AGIs $10k-25k, 0.7% for AGIs $25k-50k, 1.0% for AGIs $50k-75k, 0.7% for AGIs $75k-100k, 2.1% for AGIs over 100k)
Net capital gain/loss: +$8,363 (reported on 23.4% of returns)
Here:
+$8,363
State:
+$10,430
(% of AGI for various income ranges: -0.8% for AGIs below $10k, 0.5% for AGIs $10k-25k, 1.4% for AGIs $25k-50k, 2.5% for AGIs $50k-75k, 6.1% for AGIs $75k-100k, 11.5% for AGIs over 100k)
Profit/loss from business: +$5,994 (reported on 20.1% of returns)
Here:
+$5,994
State:
+$7,823
(% of AGI for various income ranges: 24.6% for AGIs below $10k, 9.5% for AGIs $10k-25k, 2.5% for AGIs $25k-50k, 0.6% for AGIs $50k-75k, 3.1% for AGIs $75k-100k, 1.2% for AGIs over 100k)
IRA payment deduction: $3,382 (reported on 1.9% of returns)
72732:
$3,382
Arkansas:
$3,204
Total itemized deductions: $17,881 (24% of AGI, reported on 29.4% of returns)
Here:
$17,881
State:
$18,389
Here:
23.5% of AGI
State:
21.0% of AGI
(% of AGI for various income ranges: 12.8% for AGIs $10k-25k, 10.8% for AGIs $25k-50k, 12.5% for AGIs $50k-75k, 15.9% for AGIs $75k-100k, 14.8% for AGIs over 100k)
Charity contributions deductions: $3,317 (4% of AGI, reported on 23.1% of returns)
Here:
$3,317
State:
$4,725
Here:
4.0% of AGI
State:
5.1% of AGI
(% of AGI for various income ranges: 1.3% for AGIs $10k-25k, 1.7% for AGIs $25k-50k, 1.9% for AGIs $50k-75k, 2.4% for AGIs $75k-100k, 2.1% for AGIs over 100k)
Total tax: $5,136 (reported on 75.1% of returns)
72732:
$5,136
State:
$6,047
(% of AGI for various income ranges: 6.1% for AGIs below $10k, 4.3% for AGIs $10k-25k, 5.8% for AGIs $25k-50k, 7.9% for AGIs $50k-75k, 10.2% for AGIs $75k-100k, 16.4% for AGIs over 100k)
Earned income credit: $1,809 (reported on 19.4% of returns)
Here:
$1,809
State:
$1,909
Percentage of individuals using paid preparers for their 2004 taxes: 72.1%
Here:
72%
State:
67%
(% for various income ranges: 64.2% for AGIs below $10k, 74.0% for AGIs $10k-25k, 72.7% for AGIs $25k-50k, 73.9% for AGIs $50k-75k, 68.8% for AGIs $75k-100k, 83.2% for AGIs over 100k)
Household received Food Stamps/SNAP in the past 12 months: 146 Household did not receive Food Stamps/SNAP in the past 12 months: 1,986
Women who had a birth in the past 12 months: 83 (69 now married, 14 unmarried) Women who did not have a birth in the past 12 months: 860 (516 now married, 345 unmarried)
Housing units in zip code 72732 with a mortgage: 887 (89 second mortgage, 77 both second mortgage and home equity loan) Houses without a mortgage: 5
Median monthly owner costs for units with a mortgage: $1,355 Median monthly owner costs for units without a mortgage: $468
Residents with income below the poverty level in 2022:
This zip code:
7.0%
Whole state:
16.8%
Residents with income below 50% of the poverty level in 2022:
This zip code:
6.0%
Whole state:
8.5%
Median number of rooms in houses and condos:
Here:
6.2
State:
6.1
Median number of rooms in apartments:
Here:
4.5
State:
4.3
Notable locations in this zip code not listed on our city pages
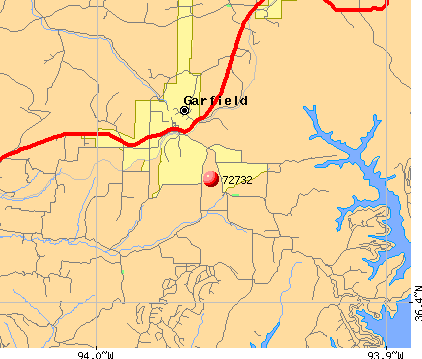
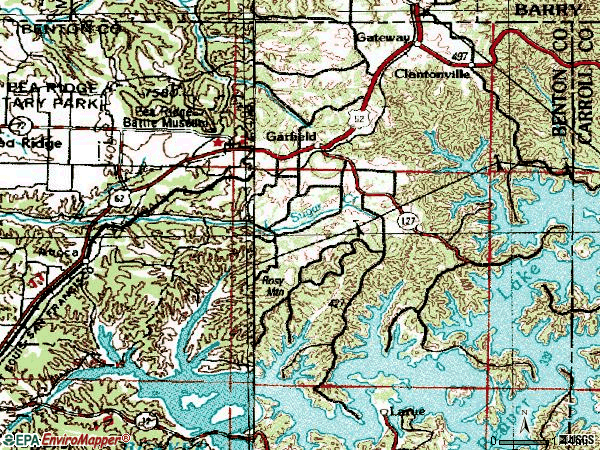
Notable locations in zip code 72732: Corinth Community Hall (A), Pea Ridge Battlefield (B), Nebco Fire Department (C), Nebco Fire Department Station 4 (D), Northeast Benton County Fire Department Station 2 (E), Northeast Benton County Fire Department Station 3 (F), Northeast Benton County Fire Department Station 5 (G), Volunteer Ambulance Service Northeast Benton County (H), Pea Ridge National Military Park (Park Security) (I). Display/hide their locations on the map
Churches in zip code 72732 include: Walnut Hill Chapel Baptist Church (A), Reddick Assembly of God Church (B), Providence Primitive Baptist Church (C), New Prospect Baptist Church (D), Freedom Freewill Baptist Church (E), Gateway Assembly of God Church (F), Garfield Church of Christ (G), Garfield Baptist Church (H). Display/hide their locations on the map
Cemeteries: Liberty Cemetery (1), Scott Cemetery (2), Ford Cemetery (3), Williams Cemetery (4), Pratt Cemetery (5), Snoderley Cemetery (6), Dean Cemetery (7). Display/hide their locations on the map
Streams, rivers, and creeks: North Clifty Creek (A), Fords Creek (B), Indian Creek (C), Horn Branch (D), Hall Spring Branch (E), Cedar Creek (F), Big Clifty Creek (G), Taylor Branch (H), Pulhane Branch (I). Display/hide their locations on the map
Parks in zip code 72732 include: Indian Creek Public Use Area (1), Ventris Public Use Area (2), Lost Bridge Public Use Area (3), Pea Ridge National Military Park (4). Display/hide their locations on the map
Size of family households: 1,084 2-persons, 219 3-persons, 208 4-persons, 91 5-persons, 98 6-persons, 11 7-or-more-persons
Size of nonfamily households: 349 1-person, 62 2-persons, 4 3-persons
754 married couples with children.
220 single-parent households (92 men, 128 women).
96.6% of residents of 72732 zip code speak English at home.
3.0% of residents speak Spanish at home (30% very well, 19% well, 51% not well).
0.1% of residents speak other Indo-European language at home (83% very well, 17% well).
0.1% of residents speak Asian or Pacific Island language at home (100% very well).
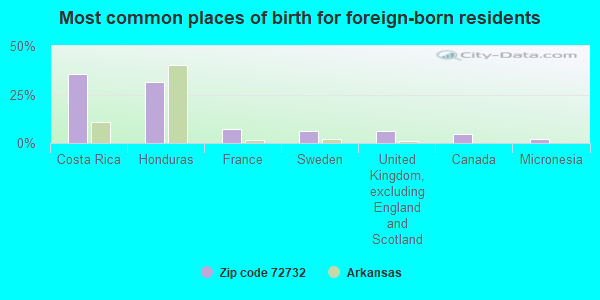
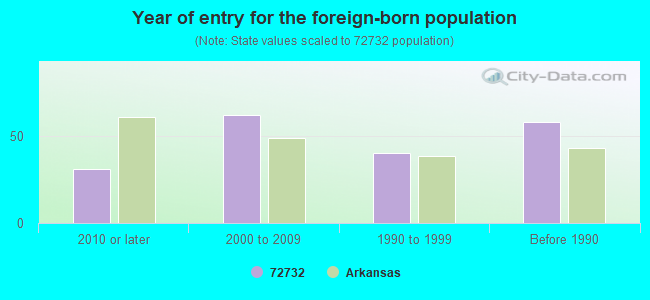
Foreign born population: 159 (3.0%) (32.3% of them are naturalized citizens)
This zip code:
3.0%
Whole state:
5.1%
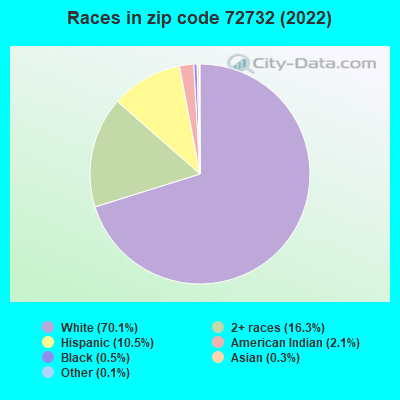
35%Costa Rica
32%Honduras
7%France
6%Sweden
6%United Kingdom, excluding England and Scotland
4%Canada
2%Micronesia
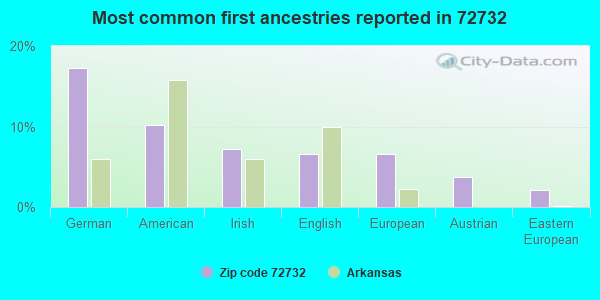
17%German
10%American
7%Irish
7%English
7%European
4%Austrian
2%Eastern European
Year of entry for the foreign-born population
312010 or later
622000 to 2009
401990 to 1999
58Before 1990
Facilities with environmental interests located in this zip code:
LOST BRIDGE VILLAGE WATER (460 BLACK OAK DR in GARFIELD, AR)
National Pollutant Discharge Elimination System NON-MAJOR (Tracking pollutant discharge elimination systems) - permit STATE MASTER (PDS) - WATER-AR0036676, National Pollutant Discharge Elimination System Permit COMMUNITY WATER SYSTEM (SDWIS) - SDWIS-AR0000049 1, WATER TREATMENT PLANT Business SIC classification: SEWERAGE SYSTEMS Alternative names: ENVIRON. SERVICES CO., INC., LOST BRIDGE VILL WAT-SEW DISTS, LOST BRIDGE VILLAGE W&S DIST, LOST BRIDGE VILLAGE WATER & SE
GARFIELD ELEMENTARY SCHOOL (18432 MARSHALL ST. in GARFIELD, AR)
(Geographic Names Information System) (National Center for Education Statistics) - STATE ID-0405032 Organizations: ROGERS (SCHOOL DISTRICT)
Housing units lacking complete plumbing facilities: 8.0% Housing units lacking complete kitchen facilities: 5.8%
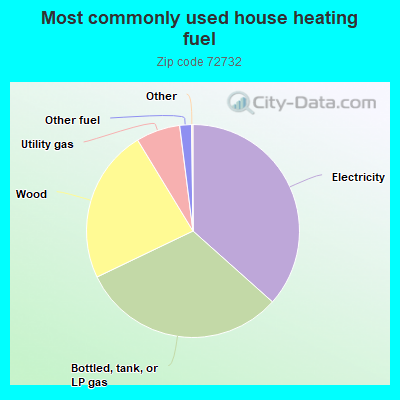
36.6%Electricity
31.3%Bottled, tank, or LP gas
23.4%Wood
6.7%Utility gas
1.8%Other fuel
Population in 1990: 1,389. Population change in the 1990s: +3,097 (+223.0%).
Place of birth for U.S.-born residents:
This state: 2,028
Northeast: 117
Midwest: 1,338
South: 893
West: 878
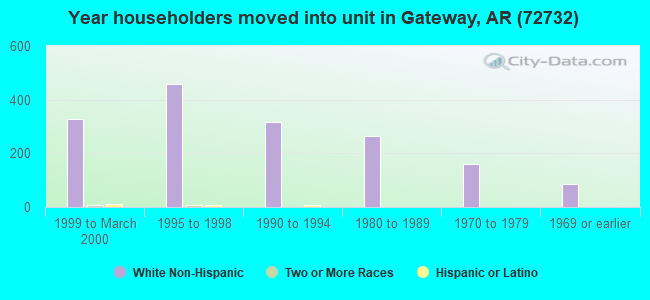
59% of the 72732 zip code residents lived in the same house 5 years ago. Out of people who lived in different houses, 50% lived in this county. Out of people who lived in different counties, 50% lived in Arkansas.
93% of the 72732 zip code residents lived in the same house 1 year ago. Out of people who lived in different houses, 47% moved from this county. Out of people who lived in different houses, 17% moved from different county within same state. Out of people who lived in different houses, 30% moved from different state. Out of people who lived in different houses, 8% moved from abroad.
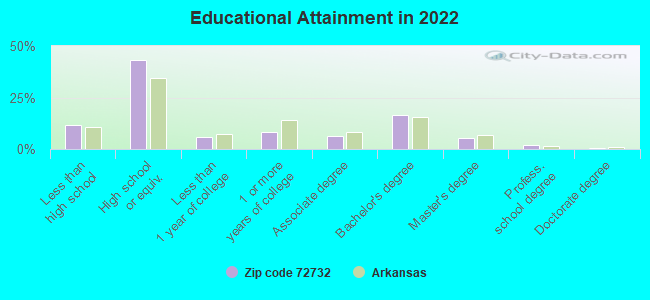
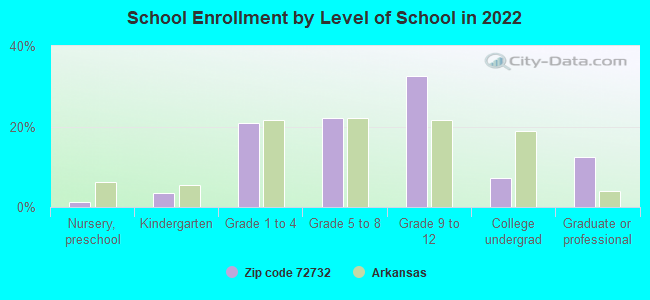
Private vs. public school enrollment:
Students in private schools in grades 1 to 8 (elementary and middle school): 61
Here:
13.3%
Arkansas:
10.5%
Students in private schools in grades 9 to 12 (high school): 45
Here:
12.7%
Arkansas:
8.7%
Students in private undergraduate colleges:
Here:
0.0%
Arkansas:
19.4%
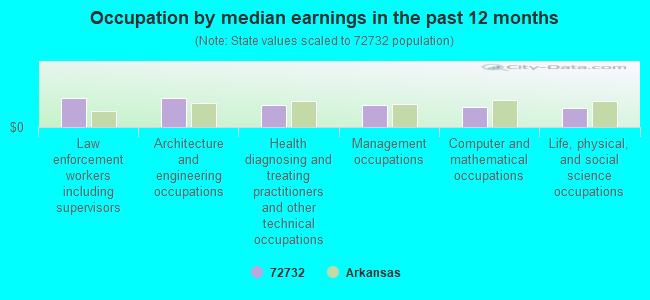
Occupation by median earnings in the past 12 months ($)
107,646Law enforcement workers including supervisors
105,792Architecture and engineering occupations
81,819Health diagnosing and treating practitioners and other technical occupations
80,197Management occupations
73,210Computer and mathematical occupations
71,217Life, physical, and social science occupations
Companies with federal contracts located in this zip code:
MCKINNEY, JAMES C (15935 TWELVE CORNERS RD in GARFIELD, AR; small business) : $68,420 in 12 contractsfrom 2002 to 2006
Contracts for Operation of Government-Owned Facilities -- Other Conservation and Development Facilities, Operation of Government-Owned Facilities -- Recreation Facilities (Non-Building) by Army, U.S. Army Corps of Engineers - civil program financing only Signed by year:2000: $0; 2001: $0; 2002: $1,607; 2003: $12,555; 2004: $22,016; 2005: $19,992; 2006: $12,250.
Biggest contracts:
$12,250 with Army for Operation of Government-Owned Facilities -- Other Conservation and Development Facilities. Taking place in MO. Signed on 2006-02-10. Completion date: 2006-09-30.
$9,996 with U.S. Army Corps of Engineers - civil program financing only for Operation of Government-Owned Facilities -- Recreation Facilities (Non-Building). Signed on 2005-09-13. Completion date: 2005-09-30.
$9,996 with Army for Operation of Government-Owned Facilities -- Recreation Facilities (Non-Building). Signed on 2005-09-13. Completion date: 2005-09-30.
$9,461 with U.S. Army Corps of Engineers - civil program financing only for Operation of Government-Owned Facilities -- Recreation Facilities (Non-Building). Signed on 2003-01-22. Completion date: 2002-10-02.
MOORE, HARVEY (19751 NORTH HWY 127 in GARFIELD, AR; small business) : $27,040 in 18 contractsfrom 2003 to 2006
Contracts for Landscaping/Groundskeeping Services, Maintenance, Repair or Alteration of Real Property -- Highways, Roads, Streets, Bridges, and Railways (includes resurfacing) by U.S. Army Corps of Engineers - civil program financing only, Army Signed by year:2000: $0; 2001: $0; 2002: $0; 2003: $5,720; 2004: $9,360; 2005: $8,320; 2006: $3,640.
Biggest contracts:
$4,680 with U.S. Army Corps of Engineers - civil program financing only for Landscaping/Groundskeeping Services. Signed on 2003-02-11. Completion date: 2004-02-29.
$3,640 with Army for Landscaping/Groundskeeping Services. Signed on 2006-01-13. Completion date: 2004-02-29.
$3,640, same as above.Signed on 2005-04-08. Completion date: 2004-02-29.
$3,640 with U.S. Army Corps of Engineers - civil program financing only for Landscaping/Groundskeeping Services. Signed on 2005-04-08. Completion date: 2004-02-29.
SPJ ENTERPRISES INC (10615 SLATE GAP RD in GARFIELD, AR; small business)
$7,200 with U.S. Army Corps of Engineers - civil program financing only for Construction of Structures and Facilities -- Other Non-Building Facilities. Signed on 2003-04-21. Completion date: 2003-05-15.
Top industries in this zip code by the number of employees in 2005:
Accommodation and Food Services: Limited-Service Restaurants (50-99 employees: 1 establishment)
Accommodation and Food Services: Hotels (except Casino Hotels) and Motels (20-49: 2, 1-4: 1)
Health Care and Social Assistance: Home Health Care Services (10-19: 1, 1-4: 1)
Construction: Power and Communication Line and Related Structures Construction (10-19: 1, 1-4: 1)
Health Care and Social Assistance: Child Day Care Services (10-19: 1, 1-4: 1)
Construction: New Single-Family Housing Construction (except Operative Builders) (1-4: 8)
Accommodation and Food Services: Cafeterias (10-19: 1)
Fatal accident statistics in 2014:
Fatal accident count: 1
Vehicles involved in fatal accidents: 1
Fatal accidents caused by drunken drivers: 0
Fatalities: 1
Persons involved in fatal accidents: 1
Pedestrians involved in fatal accidents: 0
Fatal accident statistics in 2013:
Fatal accident count: 1
Vehicles involved in fatal accidents: 2
Fatal accidents caused by drunken drivers: 0
Fatalities: 1
Persons involved in fatal accidents: 2
Pedestrians involved in fatal accidents: 0
Home Mortgage Disclosure Act Aggregated Statistics For Year 2009 (Based on 4 partial tracts)
A) FHA, FSA/RHS & VA Home Purchase Loans
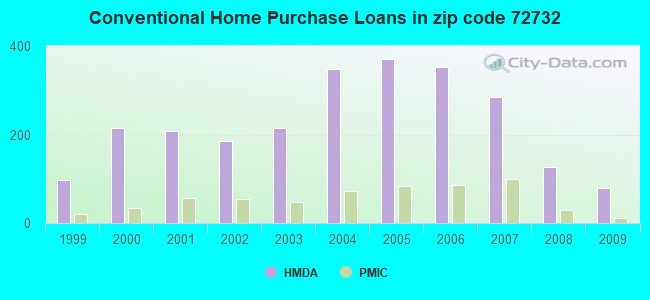
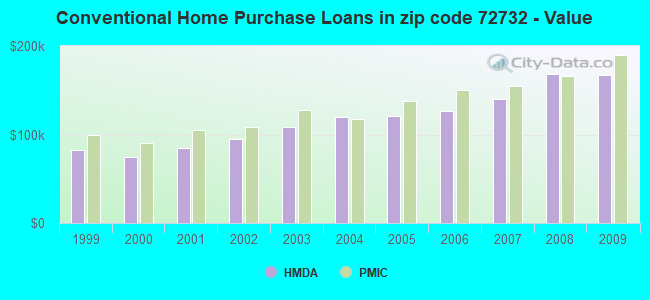
B) Conventional Home Purchase Loans
C) Refinancings
D) Home Improvement Loans
E) Loans on Dwellings For 5+ Families
F) Non-occupant Loans on < 5 Family Dwellings (A B C & D)
G) Loans On Manufactured Home Dwelling (A B C & D)
Number
Average Value
Number
Average Value
Number
Average Value
Number
Average Value
Number
Average Value
Number
Average Value
Number
Average Value
LOANS ORIGINATED
108
$125,410
80
$167,684
450
$152,588
53
$44,149
1
$1,779,930
62
$159,047
25
$51,623
APPLICATIONS APPROVED, NOT ACCEPTED
3
$63,497
7
$131,700
34
$135,662
4
$34,018
0
$0
6
$68,352
9
$79,114
APPLICATIONS DENIED
25
$99,095
31
$141,376
154
$176,527
22
$25,135
0
$0
13
$165,733
7
$79,551
APPLICATIONS WITHDRAWN
8
$107,682
11
$216,115
112
$156,298
4
$189,458
0
$0
8
$224,764
6
$81,723
FILES CLOSED FOR INCOMPLETENESS
5
$105,828
5
$76,722
18
$141,261
6
$11,845
0
$0
4
$60,248
1
$22,570
Aggregated Statistics For Year 2008 (Based on 4 partial tracts)
A) FHA, FSA/RHS & VA Home Purchase Loans
B) Conventional Home Purchase Loans
C) Refinancings
D) Home Improvement Loans
E) Loans on Dwellings For 5+ Families
F) Non-occupant Loans on < 5 Family Dwellings (A B C & D)
G) Loans On Manufactured Home Dwelling (A B C & D)
Number
Average Value
Number
Average Value
Number
Average Value
Number
Average Value
Number
Average Value
Number
Average Value
Number
Average Value
LOANS ORIGINATED
95
$126,845
127
$167,927
367
$135,250
108
$52,485
1
$133,580
75
$147,490
31
$67,126
APPLICATIONS APPROVED, NOT ACCEPTED
5
$153,442
17
$126,222
29
$181,763
2
$8,125
0
$0
6
$144,400
7
$69,164
APPLICATIONS DENIED
16
$141,371
31
$227,276
158
$170,606
21
$64,942
1
$1,227,540
10
$275,790
16
$103,769
APPLICATIONS WITHDRAWN
5
$129,348
12
$241,200
61
$169,704
9
$40,363
0
$0
6
$73,305
1
$66,790
FILES CLOSED FOR INCOMPLETENESS
3
$113,687
5
$146,094
15
$149,050
1
$13,540
1
$1,114,710
1
$101,430
2
$84,395
Aggregated Statistics For Year 2007 (Based on 4 partial tracts)
A) FHA, FSA/RHS & VA Home Purchase Loans
B) Conventional Home Purchase Loans
C) Refinancings
D) Home Improvement Loans
E) Loans on Dwellings For 5+ Families
F) Non-occupant Loans on < 5 Family Dwellings (A B C & D)
G) Loans On Manufactured Home Dwelling (A B C & D)
Number
Average Value
Number
Average Value
Number
Average Value
Number
Average Value
Number
Average Value
Number
Average Value
Number
Average Value
LOANS ORIGINATED
45
$122,473
285
$140,092
450
$134,096
128
$54,979
1
$40,620
149
$148,383
37
$82,459
APPLICATIONS APPROVED, NOT ACCEPTED
1
$174,200
34
$98,579
52
$139,834
11
$42,622
0
$0
10
$154,753
21
$77,624
APPLICATIONS DENIED
12
$112,437
98
$124,717
173
$136,059
35
$52,384
0
$0
32
$133,872
43
$79,960
APPLICATIONS WITHDRAWN
8
$86,579
26
$153,779
61
$172,787
22
$39,814
0
$0
8
$187,174
0
$0
FILES CLOSED FOR INCOMPLETENESS
0
$0
7
$124,091
23
$132,509
1
$139,780
0
$0
5
$157,480
0
$0
Aggregated Statistics For Year 2006 (Based on 4 partial tracts)
A) FHA, FSA/RHS & VA Home Purchase Loans
B) Conventional Home Purchase Loans
C) Refinancings
D) Home Improvement Loans
F) Non-occupant Loans on < 5 Family Dwellings (A B C & D)
G) Loans On Manufactured Home Dwelling (A B C & D)
Number
Average Value
Number
Average Value
Number
Average Value
Number
Average Value
Number
Average Value
Number
Average Value
LOANS ORIGINATED
49
$116,958
352
$126,371
383
$131,173
161
$37,482
123
$130,787
61
$73,904
APPLICATIONS APPROVED, NOT ACCEPTED
5
$82,318
41
$106,915
47
$161,176
7
$53,187
3
$273,587
19
$70,021
APPLICATIONS DENIED
8
$95,464
128
$115,112
143
$138,810
36
$41,404
13
$87,675
53
$66,854
APPLICATIONS WITHDRAWN
10
$125,138
43
$110,279
106
$137,976
22
$58,231
14
$130,126
8
$68,494
FILES CLOSED FOR INCOMPLETENESS
0
$0
13
$132,545
24
$138,548
2
$50,100
1
$30,930
0
$0
Aggregated Statistics For Year 2005 (Based on 4 partial tracts)
A) FHA, FSA/RHS & VA Home Purchase Loans
B) Conventional Home Purchase Loans
C) Refinancings
D) Home Improvement Loans
E) Loans on Dwellings For 5+ Families
F) Non-occupant Loans on < 5 Family Dwellings (A B C & D)
G) Loans On Manufactured Home Dwelling (A B C & D)
Number
Average Value
Number
Average Value
Number
Average Value
Number
Average Value
Number
Average Value
Number
Average Value
Number
Average Value
LOANS ORIGINATED
53
$112,339
370
$120,545
434
$121,378
200
$41,142
2
$77,170
115
$131,511
59
$85,806
APPLICATIONS APPROVED, NOT ACCEPTED
3
$122,593
44
$102,706
46
$143,766
12
$45,378
0
$0
9
$168,913
16
$56,958
APPLICATIONS DENIED
18
$88,312
137
$107,415
167
$112,389
43
$28,310
0
$0
12
$89,690
50
$52,367
APPLICATIONS WITHDRAWN
7
$70,961
43
$105,866
127
$143,891
20
$160,683
0
$0
13
$109,661
13
$73,732
FILES CLOSED FOR INCOMPLETENESS
2
$115,985
13
$219,061
26
$106,525
0
$0
0
$0
1
$108,860
1
$143,490
Aggregated Statistics For Year 2004 (Based on 4 partial tracts)
A) FHA, FSA/RHS & VA Home Purchase Loans
B) Conventional Home Purchase Loans
C) Refinancings
D) Home Improvement Loans
F) Non-occupant Loans on < 5 Family Dwellings (A B C & D)
G) Loans On Manufactured Home Dwelling (A B C & D)
Number
Average Value
Number
Average Value
Number
Average Value
Number
Average Value
Number
Average Value
Number
Average Value
LOANS ORIGINATED
60
$99,132
347
$120,337
419
$106,122
219
$40,416
126
$107,370
79
$61,891
APPLICATIONS APPROVED, NOT ACCEPTED
4
$91,325
31
$76,339
56
$96,816
4
$54,260
9
$75,892
21
$62,182
APPLICATIONS DENIED
17
$91,746
92
$90,024
149
$116,012
31
$41,169
14
$72,871
51
$60,366
APPLICATIONS WITHDRAWN
3
$66,660
33
$135,178
109
$115,606
13
$39,765
8
$134,480
7
$53,081
FILES CLOSED FOR INCOMPLETENESS
5
$76,582
8
$127,111
22
$130,334
1
$44,230
2
$91,185
1
$39,710
Aggregated Statistics For Year 2003 (Based on 4 partial tracts)
A) FHA, FSA/RHS & VA Home Purchase Loans
B) Conventional Home Purchase Loans
C) Refinancings
D) Home Improvement Loans
E) Loans on Dwellings For 5+ Families
F) Non-occupant Loans on < 5 Family Dwellings (A B C & D)
Number
Average Value
Number
Average Value
Number
Average Value
Number
Average Value
Number
Average Value
Number
Average Value
LOANS ORIGINATED
58
$99,408
214
$108,705
782
$102,542
105
$26,845
1
$40,620
110
$101,936
APPLICATIONS APPROVED, NOT ACCEPTED
3
$82,620
36
$80,103
61
$97,996
3
$17,750
0
$0
7
$124,544
APPLICATIONS DENIED
16
$72,969
92
$56,424
192
$93,119
17
$15,975
0
$0
16
$85,402
APPLICATIONS WITHDRAWN
4
$112,108
22
$136,924
86
$122,417
10
$26,226
0
$0
6
$89,240
FILES CLOSED FOR INCOMPLETENESS
0
$0
6
$192,043
39
$115,485
0
$0
0
$0
4
$177,820
Aggregated Statistics For Year 2002 (Based on 4 partial tracts)
A) FHA, FSA/RHS & VA Home Purchase Loans
B) Conventional Home Purchase Loans
C) Refinancings
D) Home Improvement Loans
F) Non-occupant Loans on < 5 Family Dwellings (A B C & D)
Number
Average Value
Number
Average Value
Number
Average Value
Number
Average Value
Number
Average Value
LOANS ORIGINATED
55
$86,906
185
$94,863
569
$91,026
94
$27,386
102
$86,356
APPLICATIONS APPROVED, NOT ACCEPTED
5
$55,420
38
$50,503
55
$84,099
6
$14,275
3
$118,630
APPLICATIONS DENIED
7
$88,713
83
$68,283
118
$87,301
29
$14,003
11
$143,017
APPLICATIONS WITHDRAWN
2
$73,330
17
$128,991
73
$117,783
7
$21,506
6
$104,842
FILES CLOSED FOR INCOMPLETENESS
3
$74,313
3
$53,580
19
$102,090
0
$0
2
$61,450
Aggregated Statistics For Year 2001 (Based on 4 partial tracts)
A) FHA, FSA/RHS & VA Home Purchase Loans
B) Conventional Home Purchase Loans
C) Refinancings
D) Home Improvement Loans
F) Non-occupant Loans on < 5 Family Dwellings (A B C & D)
Number
Average Value
Number
Average Value
Number
Average Value
Number
Average Value
Number
Average Value
LOANS ORIGINATED
64
$82,143
208
$85,139
463
$95,077
86
$25,232
62
$81,318
APPLICATIONS APPROVED, NOT ACCEPTED
1
$85,750
25
$59,464
30
$78,369
7
$61,387
2
$100,865
APPLICATIONS DENIED
11
$73,737
110
$60,994
121
$70,935
43
$25,143
7
$76,061
APPLICATIONS WITHDRAWN
7
$79,077
24
$86,743
104
$93,610
6
$41,562
6
$107,935
FILES CLOSED FOR INCOMPLETENESS
1
$102,900
1
$556,650
17
$89,381
0
$0
1
$168,230
Aggregated Statistics For Year 2000 (Based on 4 partial tracts)
A) FHA, FSA/RHS & VA Home Purchase Loans
B) Conventional Home Purchase Loans
C) Refinancings
D) Home Improvement Loans
F) Non-occupant Loans on < 5 Family Dwellings (A B C & D)
Number
Average Value
Number
Average Value
Number
Average Value
Number
Average Value
Number
Average Value
LOANS ORIGINATED
56
$75,616
214
$74,995
202
$72,003
83
$20,665
61
$74,891
APPLICATIONS APPROVED, NOT ACCEPTED
5
$53,268
56
$48,818
21
$64,617
8
$28,334
4
$41,750
APPLICATIONS DENIED
24
$59,467
160
$47,490
127
$69,358
25
$18,768
6
$59,228
APPLICATIONS WITHDRAWN
5
$52,712
12
$149,585
70
$63,710
4
$59,182
3
$76,420
FILES CLOSED FOR INCOMPLETENESS
1
$141,710
0
$0
16
$66,006
0
$0
2
$103,900
Aggregated Statistics For Year 1999 (Based on 2 partial tracts)
A) FHA, FSA/RHS & VA Home Purchase Loans
B) Conventional Home Purchase Loans
C) Refinancings
D) Home Improvement Loans
F) Non-occupant Loans on < 5 Family Dwellings (A B C & D)
Detailed PMIC statistics for the following Tracts:0201.00
, 0214.01
2002 - 2018 National Fire Incident Reporting System (NFIRS) incidents
Based on the data from the years 2002 - 2018 the average number of fire incidents per year is 53. The highest number of reported fires - 77 took place in 2005, and the least - 17 in 2004. The data has a rising trend.
When looking into fire subcategories, the most incidents belonged to: Outside Fires (52.4%), and Structure Fires (38.6%).
Fire incident types reported to NFIRS in Zip Code 72732


 Nearest zip codes: 65745, 72756, 72631, 72751, 65772, 65641.
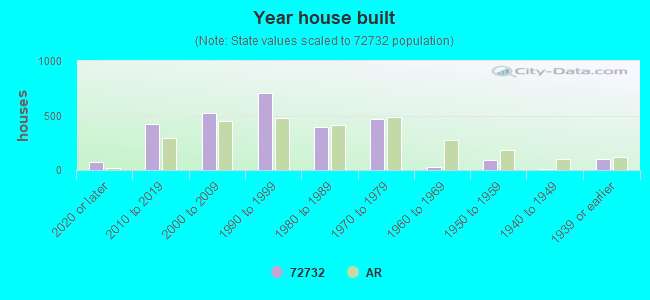


 Based on the data from the years 2002 - 2018 the average number of fire incidents per year is 53. The highest number of reported fires - 77 took place in 2005, and the least - 17 in 2004. The data has a rising trend.
 When looking into fire subcategories, the most incidents belonged to: Outside Fires (52.4%), and Structure Fires (38.6%).