Estimated median house/condo value in 2022: $175,482
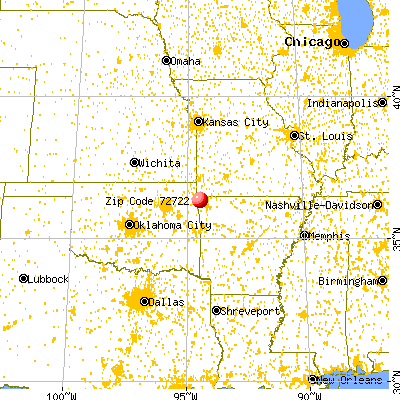
72722:
$175,482
Arkansas:
$179,800
According to our research of Arkansas and other state lists, there were 8 registered sex offenders living in 72722 zip code as of June 06, 2024. The ratio of all residents to sex offenders in zip code 72722 is 457 to 1. The ratio of registered sex offenders to all residents in this zip code is near the state average.
Median resident age:
This zip code:
34.9 years
Arkansas median age:
38.9 years
Average household size:
This zip code:
2.5 people
Arkansas:
2.4 people
Averages for the 2020 tax year for zip code 72722, filed in 2021:
Average Adjusted Gross Income (AGI) in 2020: $52,294 (Individual Income Tax Returns)
Here:
$52,294
State:
$64,872
Salary/wage: $47,311 (reported on 87.6% of returns)
Here:
$47,311
State:
$50,644
(% of AGI for various income ranges: 1292.2% for AGIs below $25k, 4172.7% for AGIs $25k-50k, 7362.5% for AGIs $50k-75k, 10410.0% for AGIs $75k-100k, 16431.4% for AGIs $100k-200k)
Taxable interest for individuals: $600 (reported on 17.8% of returns)
This zip code:
$600
Arkansas:
$1,857
(% of AGI for various income ranges: 2.5% for AGIs below $25k, 2.7% for AGIs $25k-50k, 16.7% for AGIs $50k-75k, 10.0% for AGIs $75k-100k, 132.9% for AGIs $100k-200k)
Ordinary dividends: $2,764 (reported on 8.5% of returns)
Here:
$2,764
State:
$21,681
(% of AGI for various income ranges: 5.8% for AGIs below $25k, 11.7% for AGIs $50k-75k, 384.3% for AGIs $100k-200k)
Net capital gain/loss in AGI: +$8,950 (reported on 7.8% of returns)
Here:
+$8,950
State:
+$22,815
(% of AGI for various income ranges: 6.4% for AGIs below $25k, 44.2% for AGIs $50k-75k, 1170.0% for AGIs $100k-200k)
Profit/loss from business: +$5,743 (reported on 10.9% of returns)
Here:
+$5,743
State:
+$9,743
(% of AGI for various income ranges: 89.7% for AGIs below $25k, 64.5% for AGIs $25k-50k, 61.7% for AGIs $50k-75k, 277.1% for AGIs $100k-200k)
Taxable individual retirement arrangement distribution: $18,483 (reported on 4.7% of returns)
72722:
$18,483
Arkansas:
$18,502
(% of AGI for various income ranges: 88.3% for AGIs below $25k, 1130.0% for AGIs $75k-100k)
Total itemized deductions: $31,140 (reported on 3.9% of returns)
Here:
$31,140
State:
$52,840
(% of AGI for various income ranges: 2224.3% for AGIs $100k-200k)
Charity contributions: $10,175 (reported on 3.1% of returns)
Here:
$10,175
State:
$35,735
(% of AGI for various income ranges: 581.4% for AGIs $100k-200k)
Taxes paid: $8,225 (reported on 3.1% of returns)
72722:
$8,225
State:
$7,196
(% of AGI for various income ranges: 470.0% for AGIs $100k-200k)
Earned income credit: $2,631 (reported on 27.1% of returns)
Here:
$2,631
State:
$2,546
(% of AGI for various income ranges: 167.8% for AGIs below $25k, 96.1% for AGIs $25k-50k)
Percentage of individuals using paid preparers for their 2020 taxes: 94.6%
Here:
95%
State:
94%
(% for various income ranges: 93.6% for AGIs below $25k, 95.1% for AGIs $25k-50k, 94.1% for AGIs $50k-75k, 90.0% for AGIs $75k-100k, 100.0% for AGIs $100k-200k, 100.0% for AGIs over 200k)
Averages for the 2012 tax year for zip code 72722, filed in 2013:
Average Adjusted Gross Income (AGI) in 2012: $37,963 (Individual Income Tax Returns)
Here:
$37,963
State:
$52,148
Salary/wage: $33,903 (reported on 89.6% of returns)
Here:
$33,903
State:
$41,669
(% of AGI for various income ranges: 85.8% for AGIs below $25k, 85.3% for AGIs $25k-50k, 82.5% for AGIs $50k-75k, 79.6% for AGIs $75k-100k, 67.9% for AGIs $100k-200k)
Taxable interest for individuals: $418 (reported on 19.1% of returns)
This zip code:
$418
Arkansas:
$1,648
(% of AGI for various income ranges: 0.3% for AGIs below $25k, 0.2% for AGIs $25k-50k, 0.2% for AGIs $50k-75k, 0.3% for AGIs $75k-100k)
Ordinary dividends: $1,262 (reported on 11.3% of returns)
Here:
$1,262
State:
$20,675
(% of AGI for various income ranges: 0.1% for AGIs below $25k, 0.4% for AGIs $50k-75k, 0.3% for AGIs $75k-100k, 0.9% for AGIs $100k-200k)
Net capital gain/loss in AGI: +$4,817 (reported on 10.4% of returns)
Here:
+$4,817
State:
+$15,222
(% of AGI for various income ranges: 3.2% for AGIs $25k-50k, 1.1% for AGIs $75k-100k, 1.5% for AGIs $100k-200k)
Profit/loss from business: +$9,613 (reported on 13.0% of returns)
Here:
+$9,613
State:
+$9,665
(% of AGI for various income ranges: 5.2% for AGIs below $25k, 3.4% for AGIs $25k-50k, 3.6% for AGIs $50k-75k, 5.9% for AGIs $75k-100k)
Taxable individual retirement arrangement distribution: $10,943 (reported on 6.1% of returns)
72722:
$10,943
Arkansas:
$13,644
Total itemized deductions: $21,240 (25% of AGI, reported on 17.4% of returns)
Here:
$21,240
State:
$23,276
Here:
24.6% of AGI
State:
19.1% of AGI
(% of AGI for various income ranges: 3.3% for AGIs below $25k, 5.8% for AGIs $25k-50k, 9.7% for AGIs $50k-75k, 13.5% for AGIs $75k-100k, 16.9% for AGIs $100k-200k)
Charity contributions: $5,433 (reported on 10.4% of returns)
Here:
$5,433
State:
$5,996
(% of AGI for various income ranges: 1.1% for AGIs $25k-50k, 1.1% for AGIs $50k-75k, 2.9% for AGIs $75k-100k, 2.6% for AGIs $100k-200k)
Taxes paid: $5,735 (reported on 17.4% of returns)
72722:
$5,735
State:
$7,941
(% of AGI for various income ranges: 0.8% for AGIs below $25k, 1.1% for AGIs $25k-50k, 2.1% for AGIs $50k-75k, 3.7% for AGIs $75k-100k, 5.5% for AGIs $100k-200k)
Earned income credit: $2,542 (reported on 28.7% of returns)
Here:
$2,542
State:
$2,455
(% of AGI for various income ranges: 8.2% for AGIs below $25k, 1.6% for AGIs $25k-50k)
Percentage of individuals using paid preparers for their 2012 taxes: 73.9%
Here:
74%
State:
61%
(% for various income ranges: 71.9% for AGIs below $25k, 71.9% for AGIs $25k-50k, 69.2% for AGIs $50k-75k, 85.7% for AGIs $75k-100k, 100.0% for AGIs $100k-200k)
Averages for the 2004 tax year for zip code 72722, filed in 2005:
Average Adjusted Gross Income (AGI) in 2004: $32,891 (Individual Income Tax Returns)
Here:
$32,891
State:
$39,270
Salary/wage: $30,045 (reported on 87.3% of returns)
Here:
$30,045
State:
$34,079
(% of AGI for various income ranges: 102.3% for AGIs below $10k, 83.1% for AGIs $10k-25k, 90.4% for AGIs $25k-50k, 85.7% for AGIs $50k-75k, 78.1% for AGIs $75k-100k, 55.7% for AGIs over 100k)
Taxable interest for individuals: $837 (reported on 31.9% of returns)
This zip code:
$837
Arkansas:
$1,904
(% of AGI for various income ranges: 1.5% for AGIs below $10k, 2.2% for AGIs $10k-25k, 0.3% for AGIs $25k-50k, 0.6% for AGIs $50k-75k, 1.3% for AGIs $75k-100k, 0.3% for AGIs over 100k)
Taxable dividends: $814 (reported on 13.0% of returns)
Here:
$814
State:
$5,995
(% of AGI for various income ranges: 0.5% for AGIs below $10k, 0.6% for AGIs $10k-25k, 0.3% for AGIs $25k-50k, 0.1% for AGIs $50k-75k, 0.5% for AGIs over 100k)
Net capital gain/loss: +$7,597 (reported on 12.0% of returns)
Here:
+$7,597
State:
+$10,430
(% of AGI for various income ranges: -0.3% for AGIs below $10k, 1.4% for AGIs $10k-25k, 1.1% for AGIs $25k-50k, 2.0% for AGIs $50k-75k, 2.0% for AGIs $75k-100k, 7.4% for AGIs over 100k)
Profit/loss from business: +$3,983 (reported on 16.2% of returns)
Here:
+$3,983
State:
+$7,823
(% of AGI for various income ranges: 11.2% for AGIs below $10k, 5.1% for AGIs $10k-25k, 2.7% for AGIs $25k-50k, -0.1% for AGIs $50k-75k)
Total itemized deductions: $17,366 (22% of AGI, reported on 17.0% of returns)
Here:
$17,366
State:
$18,389
Here:
21.9% of AGI
State:
21.0% of AGI
(% of AGI for various income ranges: 8.1% for AGIs $10k-25k, 6.5% for AGIs $25k-50k, 9.6% for AGIs $50k-75k, 13.2% for AGIs $75k-100k, 11.6% for AGIs over 100k)
Charity contributions deductions: $4,223 (5% of AGI, reported on 12.9% of returns)
Here:
$4,223
State:
$4,725
Here:
4.8% of AGI
State:
5.1% of AGI
(% of AGI for various income ranges: 1.2% for AGIs $10k-25k, 1.0% for AGIs $25k-50k, 2.3% for AGIs $50k-75k, 3.0% for AGIs $75k-100k, 1.8% for AGIs over 100k)
Total tax: $3,683 (reported on 65.2% of returns)
72722:
$3,683
State:
$6,047
(% of AGI for various income ranges: 3.3% for AGIs below $10k, 3.3% for AGIs $10k-25k, 5.6% for AGIs $25k-50k, 7.5% for AGIs $50k-75k, 11.6% for AGIs $75k-100k, 11.0% for AGIs over 100k)
Earned income credit: $2,021 (reported on 30.2% of returns)
Here:
$2,021
State:
$1,909
Percentage of individuals using paid preparers for their 2004 taxes: 78.6%
Here:
79%
State:
67%
(% for various income ranges: 69.8% for AGIs below $10k, 81.8% for AGIs $10k-25k, 81.2% for AGIs $25k-50k, 75.7% for AGIs $50k-75k, 87.8% for AGIs $75k-100k, 88.9% for AGIs over 100k)
Likely homosexual households (counted as self-reported same-sex unmarried-partner households)
Lesbian couples: 0.6% of all households
Gay men: 0.0% of all households
Household received Food Stamps/SNAP in the past 12 months: 102 Household did not receive Food Stamps/SNAP in the past 12 months: 869
Women who had a birth in the past 12 months: 90 (84 now married, 8 unmarried) Women who did not have a birth in the past 12 months: 538 (312 now married, 227 unmarried)
Housing units in zip code 72722 with a mortgage: 287 (3 second mortgage, 2 both second mortgage and home equity loan) Median monthly owner costs for units with a mortgage: $1,085 Median monthly owner costs for units without a mortgage: $467
Residents with income below the poverty level in 2022:
This zip code:
22.8%
Whole state:
16.8%
Residents with income below 50% of the poverty level in 2022:
This zip code:
10.1%
Whole state:
8.5%
Median number of rooms in houses and condos:
Here:
5.6
State:
6.1
Median number of rooms in apartments:
Here:
3.7
State:
4.3
Notable locations in this zip code not listed on our city pages
Notable locations in zip code 72722: R B Farms (A), Spring Creek Farm (B), Decatur Police Department (C), Decatur Fire Station (D). Display/hide their locations on the map
Churches in zip code 72722 include: Bethel Heights Church (A), Midway Church (B), Falling Springs Community Church (C). Display/hide their locations on the map
In group quarters: 55 (-1 institutionalized population)
Size of family households: 227 2-persons, 126 3-persons, 215 4-persons, 40 5-persons, 18 6-persons, 5 7-or-more-persons
Size of nonfamily households: 264 1-person, 60 2-persons
526 married couples with children.
91 single-parent households (43 men, 48 women).
82.6% of residents of 72722 zip code speak English at home.
9.6% of residents speak Spanish at home (36% very well, 1% well, 12% not well, 50% not at all).
1.7% of residents speak other Indo-European language at home (11% very well, 89% well).
5.2% of residents speak Asian or Pacific Island language at home (48% very well, 41% well, 11% not well).
Foreign born population: 268 (10.6%) (17.6% of them are naturalized citizens)
This zip code:
10.6%
Whole state:
5.1%
29%Honduras
27%El Salvador
12%Togo
11%Thailand
9%Fiji
3%Indonesia
2%Costa Rica
9%American
9%German
7%Irish
2%European
2%English
2%Welsh
1%Polish
Year of entry for the foreign-born population
1882010 or later
662000 to 2009
601990 to 1999
25Before 1990
Facilities with environmental interests located in this zip code:
FEEDMILL (2565 N. HWY. 59 in DECATUR, AR)
ENFORCEMENT/COMPLIANCE ACTIVITY (Integrated Compliance Information System) - ICIS-06-2003-0511, FORMAL ENFORCEMENT ACTION, (Integrated Compliance Information System) - ICIS-06-2003-0511, FORMAL ENFORCEMENT ACTION, COMPLIANCE ACTIVITY (Tracking inspections of insecticide, fungicide, and rodenticide, and toxic substances) STATE MASTER (PDS) - RST-04001603, FACILITY TRI REPORTER (Tracking of toxic chemicals releasing facilities) Business SIC classification: PREPARED FEEDS AND FEED INGREDIENTS FOR ANIMALS AND FOWLS, EXCEPT DOGS AND CATS Organizations: PETERSON INDUSTRIES ATTN: BOB (CONTACT/GENERAL)
Alternative names: CRYSTAL LAKE FOODS, CRYSTAL LAKE FOODS - DECATUR FEED MILL
DEVILBISS AIR POWER CO (1265 INDUSTRIAL STREET in DECATUR, AR)
AIR SYNTHETIC MINOR (AIRS/AFS) STATE MASTER (PDS) - AIR-2073-A, AIR MINOR Business SIC classification: PUMPS AND PUMPING EQUIPMENT
19TH JUDICIAL TASK FORCE (22415 DAVIS VALLEY in DECATUR, AR)
EX CELL MFG CO (HWY 59 S .5M S 102-59 JCT in DECATUR, AR)
Conditionally Exempt Small Quantity Generators, less than 100 kg/month of hazardous waste (Resource Conservation and Recovery Act (tracking hazardous waste)) - notification Organizations: WILLIAMSON BOB (CONTACT/OWNER)
, YARBOROUGH LEWIS (CONTACT/OWNER)
Housing units lacking complete plumbing facilities: 4.6% Housing units lacking complete kitchen facilities: 6.7%
42.8%Electricity
35.1%Utility gas
15.5%Bottled, tank, or LP gas
5.5%Wood
1.4%Other fuel
Population in 1990: 1,633. Population change in the 1990s: +947 (+58.0%).
Place of birth for U.S.-born residents:
This state: 1,327
Northeast: 21
Midwest: 297
South: 354
West: 206
53% of the 72722 zip code residents lived in the same house 5 years ago. Out of people who lived in different houses, 51% lived in this county. Out of people who lived in different counties, 50% lived in Arkansas.
90% of the 72722 zip code residents lived in the same house 1 year ago. Out of people who lived in different houses, 30% moved from this county. Out of people who lived in different houses, 32% moved from different county within same state. Out of people who lived in different houses, 34% moved from different state. Out of people who lived in different houses, 10% moved from abroad.
Private vs. public school enrollment:
Students in private schools in grades 1 to 8 (elementary and middle school): 10
Here:
4.3%
Arkansas:
10.5%
Students in private schools in grades 9 to 12 (high school): 4
Here:
5.0%
Arkansas:
8.7%
Students in private undergraduate colleges: 19
Here:
12.4%
Arkansas:
19.4%
Occupation by median earnings in the past 12 months ($)
161,093Architecture and engineering occupations
139,549Business and financial operations occupations
117,868Sales and related occupations
54,687Installation, maintenance, and repair occupations
50,596Transportation occupations
49,479Community and social service occupations
Companies with federal contracts located in this zip code:
JUDY C LANE (17101 W HWY 102 in DECATUR, AR) : $25,425 in 9 contractsfrom 2002 to 2006
Contracts for Operation of Government-Owned Facilities -- Recreation Facilities (Non-Building), Operation of Government-Owned Facilities -- Other Conservation and Development Facilities by Army, U.S. Army Corps of Engineers - civil program financing only Signed by year:2000: $0; 2001: $0; 2002: $2,400; 2003: $0; 2004: $0; 2005: $23,025; 2006: $0.
Biggest contracts:
$10,200 with Army for Operation of Government-Owned Facilities -- Recreation Facilities (Non-Building). Taking place in MO. Signed on 2005-05-16. Completion date: 2005-05-16.
$10,200 with U.S. Army Corps of Engineers - civil program financing only for Operation of Government-Owned Facilities -- Recreation Facilities (Non-Building). Taking place in MO. Signed on 2005-05-16. Completion date: 2005-05-16.
$9,225 with Army for Operation of Government-Owned Facilities -- Other Conservation and Development Facilities. Taking place in MO. Signed on 2006-02-15. Completion date: 2006-10-31.
$2,400 with U.S. Army Corps of Engineers - civil program financing only for Operation of Government-Owned Facilities -- Recreation Facilities (Non-Building). Signed on 2002-11-13. Completion date: 2002-10-02.
TDS TELECOMMUNICATIONS CORPORA (185 N MAIN in DECATUR, AR; small business)
$4,100 with Defense Information Systems Agency for ADP Telecommunications and Transmission Services. Signed on 2004-03-31. Completion date: 2014-03-08.
Top industries in this zip code by the number of employees in 2005:
Finance and Insurance: Commercial Banking (20-49 employees: 1 establishment)
Health Care and Social Assistance: Offices of Physicians (except Mental Health Specialists) (10-19: 1)
Health Care and Social Assistance: Emergency and Other Relief Services (5-9: 1)
People in group quarters in 2010:
46 people in correctional residential facilities
Home Mortgage Disclosure Act Aggregated Statistics For Year 2009 (Based on 8 partial tracts)
A) FHA, FSA/RHS & VA Home Purchase Loans
B) Conventional Home Purchase Loans
C) Refinancings
D) Home Improvement Loans
E) Loans on Dwellings For 5+ Families
F) Non-occupant Loans on < 5 Family Dwellings (A B C & D)
G) Loans On Manufactured Home Dwelling (A B C & D)
Number
Average Value
Number
Average Value
Number
Average Value
Number
Average Value
Number
Average Value
Number
Average Value
Number
Average Value
LOANS ORIGINATED
107
$130,767
56
$162,190
181
$157,493
22
$35,256
1
$1,563,570
29
$210,637
8
$51,265
APPLICATIONS APPROVED, NOT ACCEPTED
3
$129,097
4
$134,040
16
$158,572
1
$57,210
0
$0
1
$47,200
3
$81,490
APPLICATIONS DENIED
20
$135,928
17
$101,617
71
$160,948
8
$24,690
0
$0
6
$112,360
6
$77,565
APPLICATIONS WITHDRAWN
8
$143,358
7
$133,611
36
$159,837
2
$37,500
0
$0
3
$57,093
0
$0
FILES CLOSED FOR INCOMPLETENESS
4
$133,000
3
$130,103
7
$147,457
0
$0
0
$0
0
$0
0
$0
Aggregated Statistics For Year 2008 (Based on 8 partial tracts)
A) FHA, FSA/RHS & VA Home Purchase Loans
B) Conventional Home Purchase Loans
C) Refinancings
D) Home Improvement Loans
F) Non-occupant Loans on < 5 Family Dwellings (A B C & D)
G) Loans On Manufactured Home Dwelling (A B C & D)
Number
Average Value
Number
Average Value
Number
Average Value
Number
Average Value
Number
Average Value
Number
Average Value
LOANS ORIGINATED
76
$128,957
85
$145,055
137
$149,565
36
$41,881
35
$172,964
10
$59,055
APPLICATIONS APPROVED, NOT ACCEPTED
2
$115,205
3
$171,170
12
$168,184
4
$29,482
3
$179,410
1
$58,290
APPLICATIONS DENIED
14
$134,284
21
$128,410
76
$156,019
9
$29,510
9
$107,641
3
$82,740
APPLICATIONS WITHDRAWN
6
$130,855
8
$141,391
31
$158,795
2
$61,690
2
$124,265
1
$74,440
FILES CLOSED FOR INCOMPLETENESS
2
$90,520
2
$178,955
9
$175,769
0
$0
1
$179,400
0
$0
Aggregated Statistics For Year 2007 (Based on 8 partial tracts)
A) FHA, FSA/RHS & VA Home Purchase Loans
B) Conventional Home Purchase Loans
C) Refinancings
D) Home Improvement Loans
E) Loans on Dwellings For 5+ Families
F) Non-occupant Loans on < 5 Family Dwellings (A B C & D)
G) Loans On Manufactured Home Dwelling (A B C & D)
Number
Average Value
Number
Average Value
Number
Average Value
Number
Average Value
Number
Average Value
Number
Average Value
Number
Average Value
LOANS ORIGINATED
35
$129,274
185
$142,633
188
$139,611
54
$42,408
1
$1,323,250
81
$158,590
13
$72,635
APPLICATIONS APPROVED, NOT ACCEPTED
1
$64,870
16
$129,449
27
$161,066
4
$42,282
0
$0
3
$134,843
3
$76,493
APPLICATIONS DENIED
8
$113,272
51
$140,761
111
$156,635
22
$40,674
0
$0
37
$168,752
7
$80,641
APPLICATIONS WITHDRAWN
4
$126,975
14
$147,221
43
$141,878
5
$50,376
0
$0
11
$130,293
0
$0
FILES CLOSED FOR INCOMPLETENESS
1
$133,110
5
$158,826
16
$141,657
1
$74,360
0
$0
2
$185,580
0
$0
Aggregated Statistics For Year 2006 (Based on 8 partial tracts)
A) FHA, FSA/RHS & VA Home Purchase Loans
B) Conventional Home Purchase Loans
C) Refinancings
D) Home Improvement Loans
E) Loans on Dwellings For 5+ Families
F) Non-occupant Loans on < 5 Family Dwellings (A B C & D)
G) Loans On Manufactured Home Dwelling (A B C & D)
Number
Average Value
Number
Average Value
Number
Average Value
Number
Average Value
Number
Average Value
Number
Average Value
Number
Average Value
LOANS ORIGINATED
35
$123,203
233
$129,035
172
$144,734
51
$38,935
1
$279,150
91
$167,257
12
$67,139
APPLICATIONS APPROVED, NOT ACCEPTED
1
$127,250
18
$113,726
17
$138,729
4
$42,220
0
$0
4
$179,560
5
$59,428
APPLICATIONS DENIED
6
$105,153
65
$101,349
75
$125,678
20
$41,446
0
$0
23
$108,423
13
$67,892
APPLICATIONS WITHDRAWN
2
$187,870
24
$143,069
61
$142,936
3
$78,060
0
$0
12
$139,628
2
$81,030
FILES CLOSED FOR INCOMPLETENESS
1
$99,080
5
$141,856
19
$142,985
1
$136,830
0
$0
1
$139,900
0
$0
Aggregated Statistics For Year 2005 (Based on 8 partial tracts)
A) FHA, FSA/RHS & VA Home Purchase Loans
B) Conventional Home Purchase Loans
C) Refinancings
D) Home Improvement Loans
E) Loans on Dwellings For 5+ Families
F) Non-occupant Loans on < 5 Family Dwellings (A B C & D)
G) Loans On Manufactured Home Dwelling (A B C & D)
Number
Average Value
Number
Average Value
Number
Average Value
Number
Average Value
Number
Average Value
Number
Average Value
Number
Average Value
LOANS ORIGINATED
36
$124,527
250
$112,088
201
$109,621
56
$42,761
2
$1,647,085
59
$97,068
15
$48,601
APPLICATIONS APPROVED, NOT ACCEPTED
1
$106,370
22
$94,090
22
$111,291
4
$33,865
0
$0
2
$81,345
4
$56,672
APPLICATIONS DENIED
8
$98,529
55
$92,765
83
$119,042
20
$52,118
0
$0
7
$118,129
18
$53,337
APPLICATIONS WITHDRAWN
2
$85,180
27
$99,937
53
$120,472
8
$60,742
0
$0
5
$109,596
2
$72,945
FILES CLOSED FOR INCOMPLETENESS
3
$102,210
9
$139,837
12
$107,772
1
$138,790
0
$0
3
$159,063
0
$0
Aggregated Statistics For Year 2004 (Based on 8 partial tracts)
A) FHA, FSA/RHS & VA Home Purchase Loans
B) Conventional Home Purchase Loans
C) Refinancings
D) Home Improvement Loans
E) Loans on Dwellings For 5+ Families
F) Non-occupant Loans on < 5 Family Dwellings (A B C & D)
G) Loans On Manufactured Home Dwelling (A B C & D)
Number
Average Value
Number
Average Value
Number
Average Value
Number
Average Value
Number
Average Value
Number
Average Value
Number
Average Value
LOANS ORIGINATED
41
$108,222
213
$109,236
180
$109,557
53
$37,439
1
$867,250
61
$102,180
20
$49,002
APPLICATIONS APPROVED, NOT ACCEPTED
2
$93,590
16
$96,236
23
$97,103
2
$30,975
0
$0
4
$63,342
6
$57,418
APPLICATIONS DENIED
6
$105,240
49
$75,593
64
$101,797
15
$31,529
1
$34,600
7
$92,493
19
$49,295
APPLICATIONS WITHDRAWN
2
$115,365
16
$96,039
48
$100,819
2
$49,985
0
$0
4
$91,152
1
$100,440
FILES CLOSED FOR INCOMPLETENESS
2
$73,335
6
$98,462
7
$101,926
1
$96,040
0
$0
1
$86,040
0
$0
Aggregated Statistics For Year 2003 (Based on 8 partial tracts)
A) FHA, FSA/RHS & VA Home Purchase Loans
B) Conventional Home Purchase Loans
C) Refinancings
D) Home Improvement Loans
E) Loans on Dwellings For 5+ Families
F) Non-occupant Loans on < 5 Family Dwellings (A B C & D)
Number
Average Value
Number
Average Value
Number
Average Value
Number
Average Value
Number
Average Value
Number
Average Value
LOANS ORIGINATED
55
$97,171
138
$98,695
259
$95,816
29
$48,398
1
$586,110
42
$73,478
APPLICATIONS APPROVED, NOT ACCEPTED
1
$60,090
10
$71,892
21
$96,655
1
$13,590
0
$0
1
$71,690
APPLICATIONS DENIED
8
$82,530
39
$72,135
64
$86,652
7
$31,396
0
$0
6
$62,385
APPLICATIONS WITHDRAWN
3
$76,523
12
$76,333
37
$92,172
1
$21,960
0
$0
3
$65,083
FILES CLOSED FOR INCOMPLETENESS
3
$93,017
2
$133,115
13
$95,358
1
$51,840
0
$0
0
$0
Aggregated Statistics For Year 2002 (Based on 8 partial tracts)
A) FHA, FSA/RHS & VA Home Purchase Loans
B) Conventional Home Purchase Loans
C) Refinancings
D) Home Improvement Loans
F) Non-occupant Loans on < 5 Family Dwellings (A B C & D)
Number
Average Value
Number
Average Value
Number
Average Value
Number
Average Value
Number
Average Value
LOANS ORIGINATED
37
$86,080
115
$86,276
197
$89,869
38
$33,077
44
$76,281
APPLICATIONS APPROVED, NOT ACCEPTED
1
$58,530
11
$48,899
15
$88,702
3
$24,783
1
$45,300
APPLICATIONS DENIED
7
$70,751
38
$64,998
57
$83,278
9
$18,097
4
$109,198
APPLICATIONS WITHDRAWN
3
$66,293
11
$77,726
33
$87,145
1
$25,930
4
$73,022
FILES CLOSED FOR INCOMPLETENESS
1
$91,560
2
$71,180
11
$78,457
0
$0
0
$0
Aggregated Statistics For Year 2001 (Based on 8 partial tracts)
A) FHA, FSA/RHS & VA Home Purchase Loans
B) Conventional Home Purchase Loans
C) Refinancings
D) Home Improvement Loans
F) Non-occupant Loans on < 5 Family Dwellings (A B C & D)
Number
Average Value
Number
Average Value
Number
Average Value
Number
Average Value
Number
Average Value
LOANS ORIGINATED
42
$81,795
101
$78,028
161
$94,176
23
$44,380
36
$67,469
APPLICATIONS APPROVED, NOT ACCEPTED
0
$0
13
$45,584
11
$83,649
4
$56,778
3
$40,097
APPLICATIONS DENIED
4
$89,195
44
$63,934
55
$73,288
13
$23,608
6
$81,090
APPLICATIONS WITHDRAWN
3
$52,433
8
$69,074
27
$82,744
2
$11,005
3
$61,963
FILES CLOSED FOR INCOMPLETENESS
0
$0
2
$65,790
5
$86,860
0
$0
0
$0
Aggregated Statistics For Year 2000 (Based on 8 partial tracts)
A) FHA, FSA/RHS & VA Home Purchase Loans
B) Conventional Home Purchase Loans
C) Refinancings
D) Home Improvement Loans
F) Non-occupant Loans on < 5 Family Dwellings (A B C & D)
Number
Average Value
Number
Average Value
Number
Average Value
Number
Average Value
Number
Average Value
LOANS ORIGINATED
43
$79,066
86
$79,626
85
$75,041
30
$13,263
21
$49,674
APPLICATIONS APPROVED, NOT ACCEPTED
3
$44,503
14
$43,206
11
$76,787
4
$19,868
1
$21,890
APPLICATIONS DENIED
8
$70,064
53
$48,870
52
$58,031
14
$19,461
4
$38,298
APPLICATIONS WITHDRAWN
5
$57,132
5
$81,624
23
$68,847
4
$26,418
0
$0
FILES CLOSED FOR INCOMPLETENESS
1
$78,630
1
$30,470
7
$56,283
0
$0
0
$0
Aggregated Statistics For Year 1999 (Based on 4 partial tracts)
A) FHA, FSA/RHS & VA Home Purchase Loans
B) Conventional Home Purchase Loans
C) Refinancings
D) Home Improvement Loans
F) Non-occupant Loans on < 5 Family Dwellings (A B C & D)
2002 - 2018 National Fire Incident Reporting System (NFIRS) incidents
Based on the data from the years 2002 - 2018 the average number of fires per year is 8. The highest number of reported fire incidents - 33 took place in 2014, and the least - 1 in 2012. The data has a rising trend.
When looking into fire subcategories, the most reports belonged to: Structure Fires (58.3%), and Outside Fires (31.2%).
Fire incident types reported to NFIRS in Zip Code 72722


 Nearest zip codes: 72736, 72734, 72747, 72768, 72739, 72761.


 Based on the data from the years 2002 - 2018 the average number of fires per year is 8. The highest number of reported fire incidents - 33 took place in 2014, and the least - 1 in 2012. The data has a rising trend.
 When looking into fire subcategories, the most reports belonged to: Structure Fires (58.3%), and Outside Fires (31.2%).