Estimated zip code population in 2022: 5,905 Zip code population in 2010: 5,207 Zip code population in 2000: 4,567
Houses and condos: 2,362 Renter-occupied apartments: 570
% of renters here:
27%
State:
34%
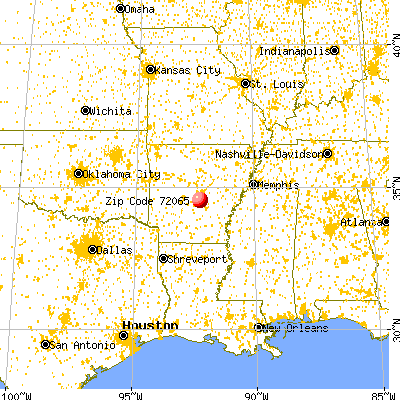
March 2022 cost of living index in zip code 72065: 79.4 (low, U.S. average is 100)
Land area: 57.2 sq. mi. Water area: 1.5 sq. mi.
Population density: 103 people per square mile
(very low).
OSM Map
General Map
Google Map
MSN Map
OSM Map
General Map
Google Map
MSN Map
OSM Map
General Map
Google Map
MSN Map
OSM Map
General Map
Google Map
MSN Map
Please wait while loading the map...
Real estate property taxes paid for housing units in 2022:
This zip code:
0.6% ($1,173)
Arkansas:
0.5% ($977)
Median real estate property taxes paid for housing units with mortgages in 2022: $1,348 (0.6%) Median real estate property taxes paid for housing units with no mortgage in 2022: $647 (0.4%)
Estimated median house/condo value in 2022: $182,900
72065:
$182,900
Arkansas:
$179,800
According to our research of Arkansas and other state lists, there were 9 registered sex offenders living in 72065 zip code as of May 31, 2024. The ratio of all residents to sex offenders in zip code 72065 is 578 to 1. The ratio of registered sex offenders to all residents in this zip code is near the state average.
Median resident age:
This zip code:
37.8 years
Arkansas median age:
38.9 years
Average household size:
This zip code:
2.8 people
Arkansas:
2.4 people
Averages for the 2020 tax year for zip code 72065, filed in 2021:
Average Adjusted Gross Income (AGI) in 2020: $63,005 (Individual Income Tax Returns)
Here:
$63,005
State:
$64,872
Salary/wage: $57,719 (reported on 83.8% of returns)
Here:
$57,719
State:
$50,644
(% of AGI for various income ranges: 1043.0% for AGIs below $25k, 3639.3% for AGIs $25k-50k, 6538.1% for AGIs $50k-75k, 9145.3% for AGIs $75k-100k, 18039.6% for AGIs $100k-200k, 61120.0% for AGIs over 200k)
Taxable interest for individuals: $751 (reported on 24.3% of returns)
This zip code:
$751
Arkansas:
$1,857
(% of AGI for various income ranges: 10.0% for AGIs below $25k, 15.8% for AGIs $25k-50k, 14.6% for AGIs $50k-75k, 18.4% for AGIs $75k-100k, 59.2% for AGIs $100k-200k, 410.0% for AGIs over 200k)
Ordinary dividends: $2,197 (reported on 12.8% of returns)
Here:
$2,197
State:
$21,681
(% of AGI for various income ranges: 9.4% for AGIs below $25k, 6.2% for AGIs $25k-50k, 37.3% for AGIs $50k-75k, 51.6% for AGIs $75k-100k, 66.4% for AGIs $100k-200k, 1095.0% for AGIs over 200k)
Net capital gain/loss in AGI: +$9,630 (reported on 11.5% of returns)
Here:
+$9,630
State:
+$22,815
(% of AGI for various income ranges: 4.1% for AGIs below $25k, 17.1% for AGIs $25k-50k, 92.3% for AGIs $50k-75k, 68.4% for AGIs $75k-100k, 252.0% for AGIs $100k-200k, 7505.0% for AGIs over 200k)
Profit/loss from business: +$7,814 (reported on 14.9% of returns)
Here:
+$7,814
State:
+$9,743
(% of AGI for various income ranges: 110.6% for AGIs below $25k, 102.4% for AGIs $25k-50k, 268.1% for AGIs $50k-75k, 252.1% for AGIs $75k-100k, 200.4% for AGIs $100k-200k)
Taxable individual retirement arrangement distribution: $15,379 (reported on 8.1% of returns)
72065:
$15,379
Arkansas:
$18,502
(% of AGI for various income ranges: 45.6% for AGIs below $25k, 116.7% for AGIs $25k-50k, 155.8% for AGIs $50k-75k, 350.5% for AGIs $75k-100k, 432.0% for AGIs $100k-200k)
Total itemized deductions: $26,969 (reported on 6.8% of returns)
Here:
$26,969
State:
$52,840
(% of AGI for various income ranges: 131.8% for AGIs $25k-50k, 223.8% for AGIs $50k-75k, 273.7% for AGIs $75k-100k, 682.0% for AGIs $100k-200k, 4575.0% for AGIs over 200k)
Charity contributions: $12,825 (reported on 5.1% of returns)
Here:
$12,825
State:
$35,735
(% of AGI for various income ranges: 151.5% for AGIs $50k-75k, 280.4% for AGIs $100k-200k, 2220.0% for AGIs over 200k)
Taxes paid: $6,467 (reported on 6.4% of returns)
72065:
$6,467
State:
$7,196
(% of AGI for various income ranges: 10.9% for AGIs $25k-50k, 40.4% for AGIs $50k-75k, 65.3% for AGIs $75k-100k, 194.8% for AGIs $100k-200k, 1025.0% for AGIs over 200k)
Earned income credit: $2,297 (reported on 16.2% of returns)
Here:
$2,297
State:
$2,546
(% of AGI for various income ranges: 102.8% for AGIs below $25k, 70.7% for AGIs $25k-50k)
Percentage of individuals using paid preparers for their 2020 taxes: 93.6%
Here:
94%
State:
94%
(% for various income ranges: 92.6% for AGIs below $25k, 93.0% for AGIs $25k-50k, 94.6% for AGIs $50k-75k, 92.3% for AGIs $75k-100k, 95.1% for AGIs $100k-200k, 100.0% for AGIs over 200k)
Averages for the 2012 tax year for zip code 72065, filed in 2013:
Average Adjusted Gross Income (AGI) in 2012: $52,830 (Individual Income Tax Returns)
Here:
$52,830
State:
$52,148
Salary/wage: $48,851 (reported on 89.2% of returns)
Here:
$48,851
State:
$41,669
(% of AGI for various income ranges: 77.2% for AGIs below $25k, 83.3% for AGIs $25k-50k, 81.9% for AGIs $50k-75k, 86.7% for AGIs $75k-100k, 85.2% for AGIs $100k-200k, 63.7% for AGIs over 200k)
Taxable interest for individuals: $792 (reported on 24.5% of returns)
This zip code:
$792
Arkansas:
$1,648
(% of AGI for various income ranges: 0.9% for AGIs below $25k, 0.3% for AGIs $25k-50k, 0.2% for AGIs $50k-75k, 0.7% for AGIs $75k-100k, 0.2% for AGIs $100k-200k, 0.2% for AGIs over 200k)
Ordinary dividends: $1,213 (reported on 10.8% of returns)
Here:
$1,213
State:
$20,675
(% of AGI for various income ranges: 0.3% for AGIs below $25k, 0.3% for AGIs $25k-50k, 0.2% for AGIs $50k-75k, 0.2% for AGIs $75k-100k, 0.3% for AGIs $100k-200k)
Net capital gain/loss in AGI: +$153 (reported on 8.0% of returns)
Here:
+$153
State:
+$15,222
(% of AGI for various income ranges: 0.2% for AGIs $100k-200k)
Profit/loss from business: +$6,316 (reported on 14.6% of returns)
Here:
+$6,316
State:
+$9,665
(% of AGI for various income ranges: 6.3% for AGIs below $25k, 1.8% for AGIs $25k-50k, 2.0% for AGIs $50k-75k, 0.6% for AGIs $75k-100k, 1.4% for AGIs $100k-200k)
Taxable individual retirement arrangement distribution: $12,447 (reported on 8.0% of returns)
72065:
$12,447
Arkansas:
$13,644
(% of AGI for various income ranges: 3.2% for AGIs below $25k, 1.7% for AGIs $25k-50k, 2.4% for AGIs $50k-75k, 2.9% for AGIs $100k-200k)
Total itemized deductions: $18,685 (20% of AGI, reported on 31.1% of returns)
Here:
$18,685
State:
$23,276
Here:
20.3% of AGI
State:
19.1% of AGI
(% of AGI for various income ranges: 5.7% for AGIs below $25k, 7.7% for AGIs $25k-50k, 10.2% for AGIs $50k-75k, 11.2% for AGIs $75k-100k, 14.4% for AGIs $100k-200k, 12.8% for AGIs over 200k)
Charity contributions: $4,467 (reported on 24.5% of returns)
Here:
$4,467
State:
$5,996
(% of AGI for various income ranges: 1.4% for AGIs $25k-50k, 1.9% for AGIs $50k-75k, 2.1% for AGIs $75k-100k, 2.8% for AGIs $100k-200k, 3.3% for AGIs over 200k)
Taxes paid: $6,183 (reported on 31.1% of returns)
72065:
$6,183
State:
$7,941
(% of AGI for various income ranges: 0.7% for AGIs below $25k, 1.5% for AGIs $25k-50k, 2.5% for AGIs $50k-75k, 3.8% for AGIs $75k-100k, 5.7% for AGIs $100k-200k, 6.2% for AGIs over 200k)
Earned income credit: $2,174 (reported on 17.9% of returns)
Here:
$2,174
State:
$2,455
(% of AGI for various income ranges: 6.7% for AGIs below $25k, 1.3% for AGIs $25k-50k)
Percentage of individuals using paid preparers for their 2012 taxes: 54.7%
Here:
55%
State:
61%
(% for various income ranges: 51.5% for AGIs below $25k, 53.6% for AGIs $25k-50k, 54.3% for AGIs $50k-75k, 62.5% for AGIs $75k-100k, 57.7% for AGIs $100k-200k, 66.7% for AGIs over 200k)
Averages for the 2004 tax year for zip code 72065, filed in 2005:
Average Adjusted Gross Income (AGI) in 2004: $43,348 (Individual Income Tax Returns)
Here:
$43,348
State:
$39,270
Salary/wage: $41,403 (reported on 90.5% of returns)
Here:
$41,403
State:
$34,079
(% of AGI for various income ranges: 96.1% for AGIs below $10k, 80.9% for AGIs $10k-25k, 86.4% for AGIs $25k-50k, 87.7% for AGIs $50k-75k, 88.9% for AGIs $75k-100k, 83.7% for AGIs over 100k)
Taxable interest for individuals: $832 (reported on 36.2% of returns)
This zip code:
$832
Arkansas:
$1,904
(% of AGI for various income ranges: 2.4% for AGIs below $10k, 1.0% for AGIs $10k-25k, 1.0% for AGIs $25k-50k, 0.6% for AGIs $50k-75k, 0.3% for AGIs $75k-100k, 0.6% for AGIs over 100k)
Taxable dividends: $861 (reported on 13.2% of returns)
Here:
$861
State:
$5,995
(% of AGI for various income ranges: 0.2% for AGIs below $10k, 0.5% for AGIs $10k-25k, 0.3% for AGIs $25k-50k, 0.2% for AGIs $50k-75k, 0.1% for AGIs $75k-100k, 0.4% for AGIs over 100k)
Net capital gain/loss: +$3,455 (reported on 10.8% of returns)
Here:
+$3,455
State:
+$10,430
(% of AGI for various income ranges: -0.3% for AGIs below $10k, -0.2% for AGIs $10k-25k, 0.2% for AGIs $25k-50k, 0.0% for AGIs $50k-75k, 0.7% for AGIs $75k-100k, 3.5% for AGIs over 100k)
Profit/loss from business: +$6,749 (reported on 15.0% of returns)
Here:
+$6,749
State:
+$7,823
(% of AGI for various income ranges: 8.7% for AGIs below $10k, 4.5% for AGIs $10k-25k, 3.7% for AGIs $25k-50k, 2.2% for AGIs $50k-75k, 0.1% for AGIs $75k-100k, 1.9% for AGIs over 100k)
IRA payment deduction: $3,295 (reported on 2.4% of returns)
72065:
$3,295
Arkansas:
$3,204
Total itemized deductions: $15,356 (21% of AGI, reported on 33.4% of returns)
Here:
$15,356
State:
$18,389
Here:
21.0% of AGI
State:
21.0% of AGI
(% of AGI for various income ranges: 7.0% for AGIs $10k-25k, 9.3% for AGIs $25k-50k, 12.6% for AGIs $50k-75k, 14.9% for AGIs $75k-100k, 13.7% for AGIs over 100k)
Charity contributions deductions: $3,327 (4% of AGI, reported on 28.3% of returns)
Here:
$3,327
State:
$4,725
Here:
4.4% of AGI
State:
5.1% of AGI
(% of AGI for various income ranges: 1.3% for AGIs $10k-25k, 1.6% for AGIs $25k-50k, 2.0% for AGIs $50k-75k, 3.0% for AGIs $75k-100k, 2.9% for AGIs over 100k)
Total tax: $5,034 (reported on 78.2% of returns)
72065:
$5,034
State:
$6,047
(% of AGI for various income ranges: 3.0% for AGIs below $10k, 4.1% for AGIs $10k-25k, 6.3% for AGIs $25k-50k, 8.3% for AGIs $50k-75k, 9.9% for AGIs $75k-100k, 15.2% for AGIs over 100k)
Earned income credit: $1,645 (reported on 17.4% of returns)
Here:
$1,645
State:
$1,909
Percentage of individuals using paid preparers for their 2004 taxes: 60.2%
Here:
60%
State:
67%
(% for various income ranges: 55.5% for AGIs below $10k, 63.7% for AGIs $10k-25k, 61.0% for AGIs $25k-50k, 59.7% for AGIs $50k-75k, 60.1% for AGIs $75k-100k, 58.0% for AGIs over 100k)
Household received Food Stamps/SNAP in the past 12 months: 229 Household did not receive Food Stamps/SNAP in the past 12 months: 1,845
Women who had a birth in the past 12 months: 173 (142 now married, 33 unmarried) Women who did not have a birth in the past 12 months: 1,339 (551 now married, 786 unmarried)
Housing units in zip code 72065 with a mortgage: 952 (32 second mortgage, 31 both second mortgage and home equity loan) Houses without a mortgage: 22
Median monthly owner costs for units with a mortgage: $1,213 Median monthly owner costs for units without a mortgage: $376
Residents with income below the poverty level in 2022:
This zip code:
16.1%
Whole state:
16.8%
Residents with income below 50% of the poverty level in 2022:
This zip code:
3.1%
Whole state:
8.5%
Median number of rooms in houses and condos:
Here:
6.0
State:
6.1
Median number of rooms in apartments:
Here:
4.1
State:
4.3
Notable locations in this zip code not listed on our city pages
Notable locations in zip code 72065: Lakeside Country Club (A), Spring Lake Club (B), East End Volunteer Fire Department Station 3 (C), Metropolitan Emergency Medical Service - East Bend (D), Hensley Fire Department Station 1 (E), Hensley Fire Department Station 2 (F). Display/hide their locations on the map
Churches in zip code 72065 include: West Hensley Church (A), Carmelite Novitiate (B), Fairview Church (C), Forest Tower Church (D), East End Church (E), Spring Lake Church (F). Display/hide their locations on the map
Cemeteries: Birden Cemetery (1), Gum Springs Cemetery (2), Camp Cemeteries (3), Jay Cemetery (4), Harris Cemetery (5), Rest in Peace Memorial Gardens (6), Brown Cemetery (7). Display/hide their locations on the map
Lakes and reservoirs: Ferguson Lake (A), Spring Lake (B), Hester Lake (C), Gropper Lake (D), Waldron Lake (E), Mary Lake (F). Display/hide their locations on the map
Streams, rivers, and creeks: Moren Branch (A), Mill Branch (B), Kelly Branch (C), Jay Creek (D), Duck Creek (E), Thompson Branch (F), Potter Creek (G), Beard Branch (H), Barnes Creek (I). Display/hide their locations on the map
In group quarters: 4 (-1 institutionalized population)
Size of family households: 579 2-persons, 415 3-persons, 225 4-persons, 179 5-persons, 100 6-persons
Size of nonfamily households: 458 1-person, 98 2-persons
760 married couples with children.
212 single-parent households (133 men, 79 women).
95.2% of residents of 72065 zip code speak English at home.
3.5% of residents speak Spanish at home (44% very well, 26% well, 29% not well).
0.2% of residents speak other Indo-European language at home (100% very well).
0.6% of residents speak Asian or Pacific Island language at home (52% very well, 48% well).
Foreign born population: 147 (2.5%) (29.8% of them are naturalized citizens)
This zip code:
2.5%
Whole state:
5.1%
74%Honduras
12%Malaysia
10%Indonesia
22%American
15%English
9%Irish
9%German
8%African
3%European
3%Scottish
Year of entry for the foreign-born population
512010 or later
02000 to 2009
01990 to 1999
128Before 1990
Facilities with environmental interests located in this zip code:
#123 PHILLIPS 66 EAST (20708 ARCH STREET PIKE in HENSLEY, AR)
(Integrated Compliance Information System) - ICIS-06-1998-0715, FORMAL ENFORCEMENT ACTION Business SIC classification: GASOLINE SERVICE STATIONS
FOREST TOWER FOOD MARTS (13487 HIGHWAY 167 in HENSLEY, AR)
National Pollutant Discharge Elimination System NON-MAJOR (Tracking pollutant discharge elimination systems) - permit Business SIC classification: GASOLINE SERVICE STATIONS Alternative names: GENE GRAVES ENTERPRISES
LONESOME OAKS SUBDIVISION (EAST FAIRVIEW ROAD in HENSLEY, AR)
National Pollutant Discharge Elimination System NON-MAJOR (Tracking pollutant discharge elimination systems) - permit Business SIC classification: GENERAL CONTRACTORS-SINGLE-FAMILY HOUSES Alternative names: MW PROPERTIES, LLC
SHERIDAN SCHOOL DIST-EAST END (HWY 367 S, NEAR SARDIS RD in EAST END, AR)
National Pollutant Discharge Elimination System NON-MAJOR (Tracking pollutant discharge elimination systems) - permit Business SIC classification: ELEMENTARY AND SECONDARY SCHOOLS Alternative names: SHERIDAN SCHOOL DISTRICT
Housing units lacking complete plumbing facilities: 5.6% Housing units lacking complete kitchen facilities: 5.2%
89.8%Electricity
4.9%Utility gas
3.0%Bottled, tank, or LP gas
1.4%Wood
1.0%No fuel used
Population in 1990: 3,696. Population change in the 1990s: +871 (+23.6%).
Place of birth for U.S.-born residents:
This state: 4,560
Northeast: 9
Midwest: 397
South: 532
West: 179
60% of the 72065 zip code residents lived in the same house 5 years ago. Out of people who lived in different houses, 32% lived in this county. Out of people who lived in different counties, 50% lived in Arkansas.
79% of the 72065 zip code residents lived in the same house 1 year ago. Out of people who lived in different houses, 31% moved from this county. Out of people who lived in different houses, 58% moved from different county within same state. Out of people who lived in different houses, 11% moved from different state.
Private vs. public school enrollment:
Students in private schools in grades 1 to 8 (elementary and middle school): 62
Here:
10.5%
Arkansas:
10.5%
Students in private schools in grades 9 to 12 (high school): 26
Here:
12.3%
Arkansas:
8.7%
Students in private undergraduate colleges: 16
Here:
9.1%
Arkansas:
19.4%
Occupation by median earnings in the past 12 months ($)
91,347Computer and mathematical occupations
77,175Health diagnosing and treating practitioners and other technical occupations
66,340Transportation occupations
54,768Management occupations
49,553Business and financial operations occupations
49,159Education, training, and library occupations
Companies with federal contracts located in this zip code:
POWER PARTS INC (21925 MOUNTAIN MAPLE in HENSLEY, AR; small business) : $521,619 in 30 contractsfrom 2004 to 2006
Contracts for Miscellaneous Engine Accessories, Nonaircraft, Engine Cooling System Components, Nonaircraft, Miscellaneous Items, Hose and Flexible Tubing, and moreby Defense Logistics Agency Signed by year:2000: $0; 2001: $0; 2002: $0; 2003: $0; 2004: $117,193; 2005: $245,879; 2006: $158,547.
Biggest contracts:
$77,720 with Defense Logistics Agency for Miscellaneous Engine Accessories, Nonaircraft. Signed on 2006-03-01. Completion date: 2006-03-21.
$49,640, same as above.Signed on 2005-11-30. Completion date: 2006-02-28.
$44,950 with Defense Logistics Agency for Engine Cooling System Components, Nonaircraft. Signed on 2005-09-14. Completion date: 2005-12-13.
$44,375, same as above.Signed on 2004-09-09. Completion date: 2004-09-14.
SISCO PAINTING COMPANY (6616 DALTON RD in HENSLEY, AR; small business) : $208,470 in 15 contractsfrom 2002 to 2005
Contracts for Maintenance, Repair or Alteration of Real Property -- Family Housing Facilities, Maintenance, Repair or Alteration of Real Property -- Other Non-Building Facilities, Maintenance, Repair or Alteration of Real Property -- Maintenance Buildings, Construction of Structures and Facilities -- Dining Facilities, and moreby Army Signed by year:2000: $0; 2001: $0; 2002: $60,510; 2003: $94,960; 2004: $14,600; 2005: $38,400; 2006: $0.
Biggest contracts:
$63,400 with Army for Maintenance, Repair or Alteration of Real Property -- Family Housing Facilities. Signed on 2003-09-23. Completion date: 2003-12-31.
$24,985 with Army for Maintenance, Repair or Alteration of Real Property -- Other Non-Building Facilities. Signed on 2002-09-11. Completion date: 2002-11-08.
$23,675 with Army for Maintenance, Repair or Alteration of Real Property -- Maintenance Buildings. Signed on 2002-09-28. Completion date: 2002-10-31.
$15,340 with Army for Construction of Structures and Facilities -- Dining Facilities. Signed on 2003-09-17. Completion date: 2003-10-23.
Top industries in this zip code by the number of employees in 2005:
Other Services (except Public Administration): Commercial and Industrial Machinery and Equipment (except Automotive and Electronic) Repair and Maintenance (10-19 employees: 1 establishment, 1-4 employees: 1 establishment)
Construction: Masonry Contractors (10-19: 1)
Accommodation and Food Services: Snack and Nonalcoholic Beverage Bars (10-19: 1)
Professional, Scientific, and Technical Services: Surveying and Mapping (except Geophysical) Services (10-19: 1)
Other Services (except Public Administration): Religious Organizations (5-9: 2)
Health Care and Social Assistance: Child Day Care Services (5-9: 1, 1-4: 3)
Construction: Plumbing, Heating, and Air-Conditioning Contractors (5-9: 1, 1-4: 2)
Other Services (except Public Administration): Civic and Social Organizations (5-9: 1)
Construction: Electrical Contractors (5-9: 1)
People in group quarters in 2010:
4 people in other noninstitutional facilities
People in group quarters in 2000:
8 people in religious group quarters
Fatal accident statistics in 2014:
Fatal accident count: 3
Vehicles involved in fatal accidents: 4
Fatal accidents caused by drunken drivers: 0
Fatalities: 3
Persons involved in fatal accidents: 6
Pedestrians involved in fatal accidents: 0
Fatal accident statistics in 2013:
Fatal accident count: 2
Vehicles involved in fatal accidents: 2
Fatal accidents caused by drunken drivers: 0
Fatalities: 2
Persons involved in fatal accidents: 3
Pedestrians involved in fatal accidents: 0
Home Mortgage Disclosure Act Aggregated Statistics For Year 2009 (Based on 6 partial tracts)
A) FHA, FSA/RHS & VA Home Purchase Loans
B) Conventional Home Purchase Loans
C) Refinancings
D) Home Improvement Loans
E) Loans on Dwellings For 5+ Families
F) Non-occupant Loans on < 5 Family Dwellings (A B C & D)
G) Loans On Manufactured Home Dwelling (A B C & D)
Number
Average Value
Number
Average Value
Number
Average Value
Number
Average Value
Number
Average Value
Number
Average Value
Number
Average Value
LOANS ORIGINATED
74
$126,643
35
$113,993
217
$135,914
22
$51,395
2
$1,876,000
15
$94,741
25
$59,488
APPLICATIONS APPROVED, NOT ACCEPTED
2
$115,005
11
$112,040
8
$95,038
3
$50,527
0
$0
0
$0
5
$77,132
APPLICATIONS DENIED
13
$130,986
26
$70,968
82
$133,636
19
$29,473
0
$0
3
$62,277
25
$54,103
APPLICATIONS WITHDRAWN
5
$118,834
1
$154,700
62
$154,415
2
$13,130
0
$0
1
$105,460
3
$85,100
FILES CLOSED FOR INCOMPLETENESS
3
$134,220
2
$96,615
11
$237,338
2
$9,380
0
$0
0
$0
3
$86,347
Aggregated Statistics For Year 2008 (Based on 6 partial tracts)
A) FHA, FSA/RHS & VA Home Purchase Loans
B) Conventional Home Purchase Loans
C) Refinancings
D) Home Improvement Loans
F) Non-occupant Loans on < 5 Family Dwellings (A B C & D)
G) Loans On Manufactured Home Dwelling (A B C & D)
Number
Average Value
Number
Average Value
Number
Average Value
Number
Average Value
Number
Average Value
Number
Average Value
LOANS ORIGINATED
74
$125,916
54
$147,766
154
$119,388
37
$29,306
23
$89,870
34
$63,058
APPLICATIONS APPROVED, NOT ACCEPTED
5
$89,012
18
$87,359
12
$105,623
5
$20,788
3
$92,743
14
$47,969
APPLICATIONS DENIED
11
$113,935
34
$94,136
89
$127,842
25
$37,206
8
$56,000
33
$48,781
APPLICATIONS WITHDRAWN
7
$116,227
7
$145,933
43
$135,925
3
$79,083
3
$46,650
6
$46,788
FILES CLOSED FOR INCOMPLETENESS
0
$0
3
$211,500
12
$95,621
2
$28,140
2
$80,250
0
$0
Aggregated Statistics For Year 2007 (Based on 6 partial tracts)
A) FHA, FSA/RHS & VA Home Purchase Loans
B) Conventional Home Purchase Loans
C) Refinancings
D) Home Improvement Loans
E) Loans on Dwellings For 5+ Families
F) Non-occupant Loans on < 5 Family Dwellings (A B C & D)
G) Loans On Manufactured Home Dwelling (A B C & D)
Number
Average Value
Number
Average Value
Number
Average Value
Number
Average Value
Number
Average Value
Number
Average Value
Number
Average Value
LOANS ORIGINATED
52
$114,115
156
$117,025
143
$112,768
36
$30,458
0
$0
19
$91,341
46
$51,729
APPLICATIONS APPROVED, NOT ACCEPTED
1
$96,990
27
$76,020
22
$109,135
4
$33,085
0
$0
4
$105,622
17
$45,270
APPLICATIONS DENIED
7
$85,249
40
$78,189
88
$152,275
39
$23,520
1
$1,930
8
$87,208
38
$59,662
APPLICATIONS WITHDRAWN
6
$151,930
13
$159,088
30
$129,985
3
$79,357
0
$0
1
$35,390
2
$56,115
FILES CLOSED FOR INCOMPLETENESS
0
$0
3
$83,707
18
$110,571
1
$32,170
0
$0
2
$30,015
4
$84,420
Aggregated Statistics For Year 2006 (Based on 6 partial tracts)
A) FHA, FSA/RHS & VA Home Purchase Loans
B) Conventional Home Purchase Loans
C) Refinancings
D) Home Improvement Loans
E) Loans on Dwellings For 5+ Families
F) Non-occupant Loans on < 5 Family Dwellings (A B C & D)
G) Loans On Manufactured Home Dwelling (A B C & D)
Number
Average Value
Number
Average Value
Number
Average Value
Number
Average Value
Number
Average Value
Number
Average Value
Number
Average Value
LOANS ORIGINATED
44
$108,922
185
$115,243
163
$128,166
29
$42,658
2
$1,151,865
27
$74,515
41
$62,558
APPLICATIONS APPROVED, NOT ACCEPTED
3
$136,190
42
$87,548
30
$143,874
9
$46,664
0
$0
0
$0
25
$52,283
APPLICATIONS DENIED
8
$123,405
56
$85,537
70
$104,606
42
$28,213
0
$0
5
$38,508
45
$48,206
APPLICATIONS WITHDRAWN
5
$62,762
22
$106,760
65
$115,686
4
$33,152
0
$0
4
$94,242
8
$65,062
FILES CLOSED FOR INCOMPLETENESS
0
$0
4
$286,920
15
$173,448
1
$28,950
0
$0
0
$0
2
$84,420
Aggregated Statistics For Year 2005 (Based on 6 partial tracts)
A) FHA, FSA/RHS & VA Home Purchase Loans
B) Conventional Home Purchase Loans
C) Refinancings
D) Home Improvement Loans
E) Loans on Dwellings For 5+ Families
F) Non-occupant Loans on < 5 Family Dwellings (A B C & D)
G) Loans On Manufactured Home Dwelling (A B C & D)
Number
Average Value
Number
Average Value
Number
Average Value
Number
Average Value
Number
Average Value
Number
Average Value
Number
Average Value
LOANS ORIGINATED
47
$107,230
183
$107,458
156
$112,030
49
$50,119
0
$0
13
$104,162
52
$50,736
APPLICATIONS APPROVED, NOT ACCEPTED
3
$51,770
30
$74,260
45
$145,470
8
$69,681
1
$2,080
0
$0
21
$47,191
APPLICATIONS DENIED
9
$54,800
79
$65,629
119
$112,924
42
$17,866
0
$0
5
$72,932
75
$44,329
APPLICATIONS WITHDRAWN
3
$94,267
21
$98,398
78
$140,329
7
$172,736
0
$0
1
$22,860
8
$51,014
FILES CLOSED FOR INCOMPLETENESS
0
$0
4
$102,895
11
$122,577
1
$34,640
0
$0
0
$0
1
$34,640
Aggregated Statistics For Year 2004 (Based on 6 partial tracts)
A) FHA, FSA/RHS & VA Home Purchase Loans
B) Conventional Home Purchase Loans
C) Refinancings
D) Home Improvement Loans
F) Non-occupant Loans on < 5 Family Dwellings (A B C & D)
G) Loans On Manufactured Home Dwelling (A B C & D)
Number
Average Value
Number
Average Value
Number
Average Value
Number
Average Value
Number
Average Value
Number
Average Value
LOANS ORIGINATED
39
$96,596
165
$103,019
204
$104,405
30
$33,504
29
$64,268
55
$47,590
APPLICATIONS APPROVED, NOT ACCEPTED
4
$91,568
18
$63,869
57
$84,668
3
$37,477
1
$41,570
16
$44,559
APPLICATIONS DENIED
6
$131,473
57
$62,157
101
$90,530
27
$34,371
9
$46,800
65
$46,836
APPLICATIONS WITHDRAWN
7
$108,211
18
$160,121
86
$103,344
6
$60,830
3
$58,957
4
$90,238
FILES CLOSED FOR INCOMPLETENESS
2
$140,700
1
$92,010
14
$133,902
0
$0
1
$77,590
2
$80,670
Aggregated Statistics For Year 2003 (Based on 6 partial tracts)
A) FHA, FSA/RHS & VA Home Purchase Loans
B) Conventional Home Purchase Loans
C) Refinancings
D) Home Improvement Loans
F) Non-occupant Loans on < 5 Family Dwellings (A B C & D)
Number
Average Value
Number
Average Value
Number
Average Value
Number
Average Value
Number
Average Value
LOANS ORIGINATED
58
$101,266
119
$103,536
371
$96,800
37
$20,505
9
$80,893
APPLICATIONS APPROVED, NOT ACCEPTED
1
$103,080
34
$66,612
56
$101,726
0
$0
6
$62,433
APPLICATIONS DENIED
3
$110,623
44
$43,884
105
$80,111
31
$24,201
3
$74,240
APPLICATIONS WITHDRAWN
12
$73,017
9
$63,811
64
$88,838
1
$23,710
4
$69,880
FILES CLOSED FOR INCOMPLETENESS
3
$60,123
3
$72,707
14
$94,041
0
$0
2
$77,855
Aggregated Statistics For Year 2002 (Based on 2 partial tracts)
A) FHA, FSA/RHS & VA Home Purchase Loans
B) Conventional Home Purchase Loans
C) Refinancings
D) Home Improvement Loans
F) Non-occupant Loans on < 5 Family Dwellings (A B C & D)
Number
Average Value
Number
Average Value
Number
Average Value
Number
Average Value
Number
Average Value
LOANS ORIGINATED
3
$52,973
5
$64,726
7
$80,793
0
$0
0
$0
APPLICATIONS APPROVED, NOT ACCEPTED
0
$0
3
$37,103
9
$41,964
1
$5,150
1
$28,310
APPLICATIONS DENIED
1
$36,670
14
$40,534
12
$67,503
1
$5,790
0
$0
APPLICATIONS WITHDRAWN
0
$0
0
$0
7
$60,111
0
$0
0
$0
FILES CLOSED FOR INCOMPLETENESS
0
$0
0
$0
5
$87,116
0
$0
0
$0
Aggregated Statistics For Year 2001 (Based on 2 partial tracts)
A) FHA, FSA/RHS & VA Home Purchase Loans
B) Conventional Home Purchase Loans
C) Refinancings
D) Home Improvement Loans
F) Non-occupant Loans on < 5 Family Dwellings (A B C & D)
Number
Average Value
Number
Average Value
Number
Average Value
Number
Average Value
Number
Average Value
LOANS ORIGINATED
3
$40,533
5
$88,018
15
$60,137
5
$16,472
1
$21,880
APPLICATIONS APPROVED, NOT ACCEPTED
0
$0
5
$37,704
3
$54,260
0
$0
1
$55,980
APPLICATIONS DENIED
1
$64,340
14
$45,130
23
$47,360
5
$20,202
0
$0
APPLICATIONS WITHDRAWN
0
$0
1
$46,970
12
$43,429
0
$0
0
$0
FILES CLOSED FOR INCOMPLETENESS
0
$0
1
$48,900
2
$55,330
0
$0
0
$0
Aggregated Statistics For Year 2000 (Based on 2 partial tracts)
A) FHA, FSA/RHS & VA Home Purchase Loans
B) Conventional Home Purchase Loans
C) Refinancings
D) Home Improvement Loans
F) Non-occupant Loans on < 5 Family Dwellings (A B C & D)
Number
Average Value
Number
Average Value
Number
Average Value
Number
Average Value
Number
Average Value
LOANS ORIGINATED
3
$62,410
15
$57,691
5
$57,778
3
$11,153
1
$59,840
APPLICATIONS APPROVED, NOT ACCEPTED
1
$59,190
3
$47,827
1
$45,040
0
$0
1
$19,300
APPLICATIONS DENIED
1
$32,170
13
$43,008
11
$37,902
3
$15,657
1
$50,190
APPLICATIONS WITHDRAWN
0
$0
2
$53,725
8
$39,650
1
$12,870
1
$20,590
FILES CLOSED FOR INCOMPLETENESS
0
$0
1
$37,960
3
$36,887
0
$0
0
$0
Aggregated Statistics For Year 1999 (Based on 2 partial tracts)
A) FHA, FSA/RHS & VA Home Purchase Loans
B) Conventional Home Purchase Loans
C) Refinancings
D) Home Improvement Loans
F) Non-occupant Loans on < 5 Family Dwellings (A B C & D)
2002 - 2018 National Fire Incident Reporting System (NFIRS) incidents
According to the data from the years 2002 - 2018 the average number of fires per year is 50. The highest number of reported fire incidents - 64 took place in 2017, and the least - 5 in 2002. The data has an increasing trend.
When looking into fire subcategories, the most reports belonged to: Outside Fires (50.9%), and Structure Fires (32.7%).
Fire incident types reported to NFIRS in Zip Code 72065


 Nearest zip codes: 72132, 72206, 72103, 72209, 72079, 72011.


 According to the data from the years 2002 - 2018 the average number of fires per year is 50. The highest number of reported fire incidents - 64 took place in 2017, and the least - 5 in 2002. The data has an increasing trend.
 When looking into fire subcategories, the most reports belonged to: Outside Fires (50.9%), and Structure Fires (32.7%).