Estimated zip code population in 2022: 13,214
Zip code population in 2010: 13,676
Zip code population in 2000: 12,463
Houses and condos: 5,120
Renter-occupied apartments: 1,759
% of renters here:
38%State:
32%
March 2022 cost of living index in zip code 70811: 89.7
(less than average, U.S. average is 100)
Land area: 11.7
sq. mi.
Water area: 0.0
sq. mi.
Population density: 1,133 people per square mile (low).
OSM Map
General Map
Google Map
MSN Map
OSM Map
General Map
Google Map
MSN Map
OSM Map
General Map
Google Map
MSN Map
OSM Map
General Map
Google Map
MSN Map
Please wait while loading the map...
Real estate property taxes paid for housing units in 2022:
This zip code:
0.4% ($579)Louisiana:
0.5% ($1,127)
Median real estate property taxes paid for housing units with mortgages in 2022: $849 (0.5%)
Median real estate property taxes paid for housing units with no mortgage in 2022: $429 (0.3%)
Profiles of local businesses
Business Search - 14 Million verified businesses
Males: 5,467 Females: 7,748
For population 25 years and over in 70811:
High school or higher: 84.7%Bachelor's degree or higher: 18.3%Graduate or professional degree: 8.7%Unemployed: 8.2%Mean travel time to work (commute): 27.0 minutes
For population 15 years and over in 70811:
Never married: 42.7%Now married: 32.2%Separated: 2.7%Widowed: 8.1%Divorced: 14.3%
Zip code 70811 compared to state average:
Black race population percentage above state average. Hispanic race population percentage below state average. Foreign-born population percentage significantly below state average. Length of stay since moving in significantly above state average. 11,509 87.1% Black 1,299 9.8% White 271 2.1% Hispanic or Latino 79 0.6% Two or more races 47 0.4% Asian 6 0.05% American Indian
Data:
Median household income ($)
Median household income (% change since 2000)
Household income diversity
Ratio of average income to average house value (%)
Ratio of average income to average rent
Median household income ($) - White
Median household income ($) - Black or African American
Median household income ($) - Asian
Median household income ($) - Hispanic or Latino
Median household income ($) - American Indian and Alaska Native
Median household income ($) - Multirace
Median household income ($) - Other Race
Median household income for houses/condos with a mortgage ($)
Median household income for apartments without a mortgage ($)
Races - White alone (%)
Races - White alone (% change since 2000)
Races - Black alone (%)
Races - Black alone (% change since 2000)
Races - American Indian alone (%)
Races - American Indian alone (% change since 2000)
Races - Asian alone (%)
Races - Asian alone (% change since 2000)
Races - Hispanic (%)
Races - Hispanic (% change since 2000)
Races - Native Hawaiian and Other Pacific Islander alone (%)
Races - Native Hawaiian and Other Pacific Islander alone (% change since 2000)
Races - Two or more races (%)
Races - Two or more races (% change since 2000)
Races - Other race alone (%)
Races - Other race alone (% change since 2000)
Racial diversity
Unemployment (%)
Unemployment (% change since 2000)
Unemployment (%) - White
Unemployment (%) - Black or African American
Unemployment (%) - Asian
Unemployment (%) - Hispanic or Latino
Unemployment (%) - American Indian and Alaska Native
Unemployment (%) - Multirace
Unemployment (%) - Other Race
Population density (people per square mile)
Population - Males (%)
Population - Females (%)
Population - Males (%) - White
Population - Males (%) - Black or African American
Population - Males (%) - Asian
Population - Males (%) - Hispanic or Latino
Population - Males (%) - American Indian and Alaska Native
Population - Males (%) - Multirace
Population - Males (%) - Other Race
Population - Females (%) - White
Population - Females (%) - Black or African American
Population - Females (%) - Asian
Population - Females (%) - Hispanic or Latino
Population - Females (%) - American Indian and Alaska Native
Population - Females (%) - Multirace
Population - Females (%) - Other Race
Coronavirus confirmed cases (Jun 05, 2024)
Deaths caused by coronavirus (Jun 05, 2024)
Coronavirus confirmed cases (per 100k population) (Jun 05, 2024)
Deaths caused by coronavirus (per 100k population) (Jun 05, 2024)
Daily increase in number of cases (Jun 05, 2024)
Weekly increase in number of cases (Jun 05, 2024)
Cases doubled (in days) (Jun 05, 2024)
Hospitalized patients (Apr 18, 2022)
Negative test results (Apr 18, 2022)
Total test results (Apr 18, 2022)
COVID Vaccine doses distributed (per 100k population) (Sep 19, 2023)
COVID Vaccine doses administered (per 100k population) (Sep 19, 2023)
COVID Vaccine doses distributed (Sep 19, 2023)
COVID Vaccine doses administered (Sep 19, 2023)
Likely homosexual households (%)
Likely homosexual households (% change since 2000)
Likely homosexual households - Lesbian couples (%)
Likely homosexual households - Lesbian couples (% change since 2000)
Likely homosexual households - Gay men (%)
Likely homosexual households - Gay men (% change since 2000)
Cost of living index
Median gross rent ($)
Median contract rent ($)
Median monthly housing costs ($)
Median house or condo value ($)
Median house or condo value ($ change since 2000)
Mean house or condo value by units in structure - 1, detached ($)
Mean house or condo value by units in structure - 1, attached ($)
Mean house or condo value by units in structure - 2 ($)
Mean house or condo value by units in structure by units in structure - 3 or 4 ($)
Mean house or condo value by units in structure - 5 or more ($)
Mean house or condo value by units in structure - Boat, RV, van, etc. ($)
Mean house or condo value by units in structure - Mobile home ($)
Median house or condo value ($) - White
Median house or condo value ($) - Black or African American
Median house or condo value ($) - Asian
Median house or condo value ($) - Hispanic or Latino
Median house or condo value ($) - American Indian and Alaska Native
Median house or condo value ($) - Multirace
Median house or condo value ($) - Other Race
Median resident age
Resident age diversity
Median resident age - Males
Median resident age - Females
Median resident age - White
Median resident age - Black or African American
Median resident age - Asian
Median resident age - Hispanic or Latino
Median resident age - American Indian and Alaska Native
Median resident age - Multirace
Median resident age - Other Race
Median resident age - Males - White
Median resident age - Males - Black or African American
Median resident age - Males - Asian
Median resident age - Males - Hispanic or Latino
Median resident age - Males - American Indian and Alaska Native
Median resident age - Males - Multirace
Median resident age - Males - Other Race
Median resident age - Females - White
Median resident age - Females - Black or African American
Median resident age - Females - Asian
Median resident age - Females - Hispanic or Latino
Median resident age - Females - American Indian and Alaska Native
Median resident age - Females - Multirace
Median resident age - Females - Other Race
Commute - mean travel time to work (minutes)
Travel time to work - Less than 5 minutes (%)
Travel time to work - Less than 5 minutes (% change since 2000)
Travel time to work - 5 to 9 minutes (%)
Travel time to work - 5 to 9 minutes (% change since 2000)
Travel time to work - 10 to 19 minutes (%)
Travel time to work - 10 to 19 minutes (% change since 2000)
Travel time to work - 20 to 29 minutes (%)
Travel time to work - 20 to 29 minutes (% change since 2000)
Travel time to work - 30 to 39 minutes (%)
Travel time to work - 30 to 39 minutes (% change since 2000)
Travel time to work - 40 to 59 minutes (%)
Travel time to work - 40 to 59 minutes (% change since 2000)
Travel time to work - 60 to 89 minutes (%)
Travel time to work - 60 to 89 minutes (% change since 2000)
Travel time to work - 90 or more minutes (%)
Travel time to work - 90 or more minutes (% change since 2000)
Marital status - Never married (%)
Marital status - Now married (%)
Marital status - Separated (%)
Marital status - Widowed (%)
Marital status - Divorced (%)
Median family income ($)
Median family income (% change since 2000)
Median non-family income ($)
Median non-family income (% change since 2000)
Median per capita income ($)
Median per capita income (% change since 2000)
Median family income ($) - White
Median family income ($) - Black or African American
Median family income ($) - Asian
Median family income ($) - Hispanic or Latino
Median family income ($) - American Indian and Alaska Native
Median family income ($) - Multirace
Median family income ($) - Other Race
Median year house/condo built
Median year apartment built
Year house built - Built 2005 or later (%)
Year house built - Built 2000 to 2004 (%)
Year house built - Built 1990 to 1999 (%)
Year house built - Built 1980 to 1989 (%)
Year house built - Built 1970 to 1979 (%)
Year house built - Built 1960 to 1969 (%)
Year house built - Built 1950 to 1959 (%)
Year house built - Built 1940 to 1949 (%)
Year house built - Built 1939 or earlier (%)
Average household size
Household density (households per square mile)
Average household size - White
Average household size - Black or African American
Average household size - Asian
Average household size - Hispanic or Latino
Average household size - American Indian and Alaska Native
Average household size - Multirace
Average household size - Other Race
Occupied housing units (%)
Vacant housing units (%)
Owner occupied housing units (%)
Renter occupied housing units (%)
Vacancy status - For rent (%)
Vacancy status - For sale only (%)
Vacancy status - Rented or sold, not occupied (%)
Vacancy status - For seasonal, recreational, or occasional use (%)
Vacancy status - For migrant workers (%)
Vacancy status - Other vacant (%)
Residents with income below the poverty level (%)
Residents with income below 50% of the poverty level (%)
Children below poverty level (%)
Poor families by family type - Married-couple family (%)
Poor families by family type - Male, no wife present (%)
Poor families by family type - Female, no husband present (%)
Poverty status for native-born residents (%)
Poverty status for foreign-born residents (%)
Poverty among high school graduates not in families (%)
Poverty among people who did not graduate high school not in families (%)
Residents with income below the poverty level (%) - White
Residents with income below the poverty level (%) - Black or African American
Residents with income below the poverty level (%) - Asian
Residents with income below the poverty level (%) - Hispanic or Latino
Residents with income below the poverty level (%) - American Indian and Alaska Native
Residents with income below the poverty level (%) - Multirace
Residents with income below the poverty level (%) - Other Race
Air pollution - Air Quality Index (AQI)
Air pollution - CO
Air pollution - NO2
Air pollution - SO2
Air pollution - Ozone
Air pollution - PM10
Air pollution - PM25
Air pollution - Pb
Crime - Murders per 100,000 population
Crime - Rapes per 100,000 population
Crime - Robberies per 100,000 population
Crime - Assaults per 100,000 population
Crime - Burglaries per 100,000 population
Crime - Thefts per 100,000 population
Crime - Auto thefts per 100,000 population
Crime - Arson per 100,000 population
Crime - City-data.com crime index
Crime - Violent crime index
Crime - Property crime index
Crime - Murders per 100,000 population (5 year average)
Crime - Rapes per 100,000 population (5 year average)
Crime - Robberies per 100,000 population (5 year average)
Crime - Assaults per 100,000 population (5 year average)
Crime - Burglaries per 100,000 population (5 year average)
Crime - Thefts per 100,000 population (5 year average)
Crime - Auto thefts per 100,000 population (5 year average)
Crime - Arson per 100,000 population (5 year average)
Crime - City-data.com crime index (5 year average)
Crime - Violent crime index (5 year average)
Crime - Property crime index (5 year average)
1996 Presidential Elections Results (%) - Democratic Party (Clinton)
1996 Presidential Elections Results (%) - Republican Party (Dole)
1996 Presidential Elections Results (%) - Other
2000 Presidential Elections Results (%) - Democratic Party (Gore)
2000 Presidential Elections Results (%) - Republican Party (Bush)
2000 Presidential Elections Results (%) - Other
2004 Presidential Elections Results (%) - Democratic Party (Kerry)
2004 Presidential Elections Results (%) - Republican Party (Bush)
2004 Presidential Elections Results (%) - Other
2008 Presidential Elections Results (%) - Democratic Party (Obama)
2008 Presidential Elections Results (%) - Republican Party (McCain)
2008 Presidential Elections Results (%) - Other
2012 Presidential Elections Results (%) - Democratic Party (Obama)
2012 Presidential Elections Results (%) - Republican Party (Romney)
2012 Presidential Elections Results (%) - Other
2016 Presidential Elections Results (%) - Democratic Party (Clinton)
2016 Presidential Elections Results (%) - Republican Party (Trump)
2016 Presidential Elections Results (%) - Other
2020 Presidential Elections Results (%) - Democratic Party (Biden)
2020 Presidential Elections Results (%) - Republican Party (Trump)
2020 Presidential Elections Results (%) - Other
Ancestries Reported - Arab (%)
Ancestries Reported - Czech (%)
Ancestries Reported - Danish (%)
Ancestries Reported - Dutch (%)
Ancestries Reported - English (%)
Ancestries Reported - French (%)
Ancestries Reported - French Canadian (%)
Ancestries Reported - German (%)
Ancestries Reported - Greek (%)
Ancestries Reported - Hungarian (%)
Ancestries Reported - Irish (%)
Ancestries Reported - Italian (%)
Ancestries Reported - Lithuanian (%)
Ancestries Reported - Norwegian (%)
Ancestries Reported - Polish (%)
Ancestries Reported - Portuguese (%)
Ancestries Reported - Russian (%)
Ancestries Reported - Scotch-Irish (%)
Ancestries Reported - Scottish (%)
Ancestries Reported - Slovak (%)
Ancestries Reported - Subsaharan African (%)
Ancestries Reported - Swedish (%)
Ancestries Reported - Swiss (%)
Ancestries Reported - Ukrainian (%)
Ancestries Reported - United States (%)
Ancestries Reported - Welsh (%)
Ancestries Reported - West Indian (%)
Ancestries Reported - Other (%)
Educational Attainment - No schooling completed (%)
Educational Attainment - Less than high school (%)
Educational Attainment - High school or equivalent (%)
Educational Attainment - Less than 1 year of college (%)
Educational Attainment - 1 or more years of college (%)
Educational Attainment - Associate degree (%)
Educational Attainment - Bachelor's degree (%)
Educational Attainment - Master's degree (%)
Educational Attainment - Professional school degree (%)
Educational Attainment - Doctorate degree (%)
School Enrollment - Nursery, preschool (%)
School Enrollment - Kindergarten (%)
School Enrollment - Grade 1 to 4 (%)
School Enrollment - Grade 5 to 8 (%)
School Enrollment - Grade 9 to 12 (%)
School Enrollment - College undergrad (%)
School Enrollment - Graduate or professional (%)
School Enrollment - Not enrolled in school (%)
School enrollment - Public schools (%)
School enrollment - Private schools (%)
School enrollment - Not enrolled (%)
Median number of rooms in houses and condos
Median number of rooms in apartments
Housing units lacking complete plumbing facilities (%)
Housing units lacking complete kitchen facilities (%)
Density of houses
Urban houses (%)
Rural houses (%)
Households with people 60 years and over (%)
Households with people 65 years and over (%)
Households with people 75 years and over (%)
Households with one or more nonrelatives (%)
Households with no nonrelatives (%)
Population in households (%)
Family households (%)
Nonfamily households (%)
Population in families (%)
Family households with own children (%)
Median number of bedrooms in owner occupied houses
Mean number of bedrooms in owner occupied houses
Median number of bedrooms in renter occupied houses
Mean number of bedrooms in renter occupied houses
Median number of vehichles in owner occupied houses
Mean number of vehichles in owner occupied houses
Median number of vehichles in renter occupied houses
Mean number of vehichles in renter occupied houses
Mortgage status - with mortgage (%)
Mortgage status - with second mortgage (%)
Mortgage status - with home equity loan (%)
Mortgage status - with both second mortgage and home equity loan (%)
Mortgage status - without a mortgage (%)
Average family size
Average family size - White
Average family size - Black or African American
Average family size - Asian
Average family size - Hispanic or Latino
Average family size - American Indian and Alaska Native
Average family size - Multirace
Average family size - Other Race
Geographical mobility - Same house 1 year ago (%)
Geographical mobility - Moved within same county (%)
Geographical mobility - Moved from different county within same state (%)
Geographical mobility - Moved from different state (%)
Geographical mobility - Moved from abroad (%)
Place of birth - Born in state of residence (%)
Place of birth - Born in other state (%)
Place of birth - Native, outside of US (%)
Place of birth - Foreign born (%)
Housing units in structures - 1, detached (%)
Housing units in structures - 1, attached (%)
Housing units in structures - 2 (%)
Housing units in structures - 3 or 4 (%)
Housing units in structures - 5 to 9 (%)
Housing units in structures - 10 to 19 (%)
Housing units in structures - 20 to 49 (%)
Housing units in structures - 50 or more (%)
Housing units in structures - Mobile home (%)
Housing units in structures - Boat, RV, van, etc. (%)
House/condo owner moved in on average (years ago)
Renter moved in on average (years ago)
Year householder moved into unit - Moved in 1999 to March 2000 (%)
Year householder moved into unit - Moved in 1995 to 1998 (%)
Year householder moved into unit - Moved in 1990 to 1994 (%)
Year householder moved into unit - Moved in 1980 to 1989 (%)
Year householder moved into unit - Moved in 1970 to 1979 (%)
Year householder moved into unit - Moved in 1969 or earlier (%)
Means of transportation to work - Drove car alone (%)
Means of transportation to work - Carpooled (%)
Means of transportation to work - Public transportation (%)
Means of transportation to work - Bus or trolley bus (%)
Means of transportation to work - Streetcar or trolley car (%)
Means of transportation to work - Subway or elevated (%)
Means of transportation to work - Railroad (%)
Means of transportation to work - Ferryboat (%)
Means of transportation to work - Taxicab (%)
Means of transportation to work - Motorcycle (%)
Means of transportation to work - Bicycle (%)
Means of transportation to work - Walked (%)
Means of transportation to work - Other means (%)
Working at home (%)
Industry diversity
Most Common Industries - Agriculture, forestry, fishing and hunting, and mining (%)
Most Common Industries - Agriculture, forestry, fishing and hunting (%)
Most Common Industries - Mining, quarrying, and oil and gas extraction (%)
Most Common Industries - Construction (%)
Most Common Industries - Manufacturing (%)
Most Common Industries - Wholesale trade (%)
Most Common Industries - Retail trade (%)
Most Common Industries - Transportation and warehousing, and utilities (%)
Most Common Industries - Transportation and warehousing (%)
Most Common Industries - Utilities (%)
Most Common Industries - Information (%)
Most Common Industries - Finance and insurance, and real estate and rental and leasing (%)
Most Common Industries - Finance and insurance (%)
Most Common Industries - Real estate and rental and leasing (%)
Most Common Industries - Professional, scientific, and management, and administrative and waste management services (%)
Most Common Industries - Professional, scientific, and technical services (%)
Most Common Industries - Management of companies and enterprises (%)
Most Common Industries - Administrative and support and waste management services (%)
Most Common Industries - Educational services, and health care and social assistance (%)
Most Common Industries - Educational services (%)
Most Common Industries - Health care and social assistance (%)
Most Common Industries - Arts, entertainment, and recreation, and accommodation and food services (%)
Most Common Industries - Arts, entertainment, and recreation (%)
Most Common Industries - Accommodation and food services (%)
Most Common Industries - Other services, except public administration (%)
Most Common Industries - Public administration (%)
Occupation diversity
Most Common Occupations - Management, business, science, and arts occupations (%)
Most Common Occupations - Management, business, and financial occupations (%)
Most Common Occupations - Management occupations (%)
Most Common Occupations - Business and financial operations occupations (%)
Most Common Occupations - Computer, engineering, and science occupations (%)
Most Common Occupations - Computer and mathematical occupations (%)
Most Common Occupations - Architecture and engineering occupations (%)
Most Common Occupations - Life, physical, and social science occupations (%)
Most Common Occupations - Education, legal, community service, arts, and media occupations (%)
Most Common Occupations - Community and social service occupations (%)
Most Common Occupations - Legal occupations (%)
Most Common Occupations - Education, training, and library occupations (%)
Most Common Occupations - Arts, design, entertainment, sports, and media occupations (%)
Most Common Occupations - Healthcare practitioners and technical occupations (%)
Most Common Occupations - Health diagnosing and treating practitioners and other technical occupations (%)
Most Common Occupations - Health technologists and technicians (%)
Most Common Occupations - Service occupations (%)
Most Common Occupations - Healthcare support occupations (%)
Most Common Occupations - Protective service occupations (%)
Most Common Occupations - Fire fighting and prevention, and other protective service workers including supervisors (%)
Most Common Occupations - Law enforcement workers including supervisors (%)
Most Common Occupations - Food preparation and serving related occupations (%)
Most Common Occupations - Building and grounds cleaning and maintenance occupations (%)
Most Common Occupations - Personal care and service occupations (%)
Most Common Occupations - Sales and office occupations (%)
Most Common Occupations - Sales and related occupations (%)
Most Common Occupations - Office and administrative support occupations (%)
Most Common Occupations - Natural resources, construction, and maintenance occupations (%)
Most Common Occupations - Farming, fishing, and forestry occupations (%)
Most Common Occupations - Construction and extraction occupations (%)
Most Common Occupations - Installation, maintenance, and repair occupations (%)
Most Common Occupations - Production, transportation, and material moving occupations (%)
Most Common Occupations - Production occupations (%)
Most Common Occupations - Transportation occupations (%)
Most Common Occupations - Material moving occupations (%)
People in Group quarters - Institutionalized population (%)
People in Group quarters - Correctional institutions (%)
People in Group quarters - Federal prisons and detention centers (%)
People in Group quarters - Halfway houses (%)
People in Group quarters - Local jails and other confinement facilities (including police lockups) (%)
People in Group quarters - Military disciplinary barracks (%)
People in Group quarters - State prisons (%)
People in Group quarters - Other types of correctional institutions (%)
People in Group quarters - Nursing homes (%)
People in Group quarters - Hospitals/wards, hospices, and schools for the handicapped (%)
People in Group quarters - Hospitals/wards and hospices for chronically ill (%)
People in Group quarters - Hospices or homes for chronically ill (%)
People in Group quarters - Military hospitals or wards for chronically ill (%)
People in Group quarters - Other hospitals or wards for chronically ill (%)
People in Group quarters - Hospitals or wards for drug/alcohol abuse (%)
People in Group quarters - Mental (Psychiatric) hospitals or wards (%)
People in Group quarters - Schools, hospitals, or wards for the mentally retarded (%)
People in Group quarters - Schools, hospitals, or wards for the physically handicapped (%)
People in Group quarters - Institutions for the deaf (%)
People in Group quarters - Institutions for the blind (%)
People in Group quarters - Orthopedic wards and institutions for the physically handicapped (%)
People in Group quarters - Wards in general hospitals for patients who have no usual home elsewhere (%)
People in Group quarters - Wards in military hospitals for patients who have no usual home elsewhere (%)
People in Group quarters - Juvenile institutions (%)
People in Group quarters - Long-term care (%)
People in Group quarters - Homes for abused, dependent, and neglected children (%)
People in Group quarters - Residential treatment centers for emotionally disturbed children (%)
People in Group quarters - Training schools for juvenile delinquents (%)
People in Group quarters - Short-term care, detention or diagnostic centers for delinquent children (%)
People in Group quarters - Type of juvenile institution unknown (%)
People in Group quarters - Noninstitutionalized population (%)
People in Group quarters - College dormitories (includes college quarters off campus) (%)
People in Group quarters - Military quarters (%)
People in Group quarters - On base (%)
People in Group quarters - Barracks, unaccompanied personnel housing (UPH), (Enlisted/Officer), ;and similar group living quarters for military personnel (%)
People in Group quarters - Transient quarters for temporary residents (%)
People in Group quarters - Military ships (%)
People in Group quarters - Group homes (%)
People in Group quarters - Homes or halfway houses for drug/alcohol abuse (%)
People in Group quarters - Homes for the mentally ill (%)
People in Group quarters - Homes for the mentally retarded (%)
People in Group quarters - Homes for the physically handicapped (%)
People in Group quarters - Other group homes (%)
People in Group quarters - Religious group quarters (%)
People in Group quarters - Dormitories (%)
People in Group quarters - Agriculture workers' dormitories on farms (%)
People in Group quarters - Job Corps and vocational training facilities (%)
People in Group quarters - Other workers' dormitories (%)
People in Group quarters - Crews of maritime vessels (%)
People in Group quarters - Other nonhousehold living situations (%)
People in Group quarters - Other noninstitutional group quarters (%)
Residents speaking English at home (%)
Residents speaking English at home - Born in the United States (%)
Residents speaking English at home - Native, born elsewhere (%)
Residents speaking English at home - Foreign born (%)
Residents speaking Spanish at home (%)
Residents speaking Spanish at home - Born in the United States (%)
Residents speaking Spanish at home - Native, born elsewhere (%)
Residents speaking Spanish at home - Foreign born (%)
Residents speaking other language at home (%)
Residents speaking other language at home - Born in the United States (%)
Residents speaking other language at home - Native, born elsewhere (%)
Residents speaking other language at home - Foreign born (%)
Class of Workers - Employee of private company (%)
Class of Workers - Self-employed in own incorporated business (%)
Class of Workers - Private not-for-profit wage and salary workers (%)
Class of Workers - Local government workers (%)
Class of Workers - State government workers (%)
Class of Workers - Federal government workers (%)
Class of Workers - Self-employed workers in own not incorporated business and Unpaid family workers (%)
House heating fuel used in houses and condos - Utility gas (%)
House heating fuel used in houses and condos - Bottled, tank, or LP gas (%)
House heating fuel used in houses and condos - Electricity (%)
House heating fuel used in houses and condos - Fuel oil, kerosene, etc. (%)
House heating fuel used in houses and condos - Coal or coke (%)
House heating fuel used in houses and condos - Wood (%)
House heating fuel used in houses and condos - Solar energy (%)
House heating fuel used in houses and condos - Other fuel (%)
House heating fuel used in houses and condos - No fuel used (%)
House heating fuel used in apartments - Utility gas (%)
House heating fuel used in apartments - Bottled, tank, or LP gas (%)
House heating fuel used in apartments - Electricity (%)
House heating fuel used in apartments - Fuel oil, kerosene, etc. (%)
House heating fuel used in apartments - Coal or coke (%)
House heating fuel used in apartments - Wood (%)
House heating fuel used in apartments - Solar energy (%)
House heating fuel used in apartments - Other fuel (%)
House heating fuel used in apartments - No fuel used (%)
Armed forces status - In Armed Forces (%)
Armed forces status - Civilian (%)
Armed forces status - Civilian - Veteran (%)
Armed forces status - Civilian - Nonveteran (%)
Fatal accidents locations in years 2005-2021
Fatal accidents locations in 2005
Fatal accidents locations in 2006
Fatal accidents locations in 2007
Fatal accidents locations in 2008
Fatal accidents locations in 2009
Fatal accidents locations in 2010
Fatal accidents locations in 2011
Fatal accidents locations in 2012
Fatal accidents locations in 2013
Fatal accidents locations in 2014
Fatal accidents locations in 2015
Fatal accidents locations in 2016
Fatal accidents locations in 2017
Fatal accidents locations in 2018
Fatal accidents locations in 2019
Fatal accidents locations in 2020
Fatal accidents locations in 2021
Alcohol use - People drinking some alcohol every month (%)
Alcohol use - People not drinking at all (%)
Alcohol use - Average days/month drinking alcohol
Alcohol use - Average drinks/week
Alcohol use - Average days/year people drink much
Audiometry - Average condition of hearing (%)
Audiometry - People that can hear a whisper from across a quiet room (%)
Audiometry - People that can hear normal voice from across a quiet room (%)
Audiometry - Ears ringing, roaring, buzzing (%)
Audiometry - Had a job exposure to loud noise (%)
Audiometry - Had off-work exposure to loud noise (%)
Blood Pressure & Cholesterol - Has high blood pressure (%)
Blood Pressure & Cholesterol - Checking blood pressure at home (%)
Blood Pressure & Cholesterol - Frequently checking blood cholesterol (%)
Blood Pressure & Cholesterol - Has high cholesterol level (%)
Consumer Behavior - Money monthly spent on food at supermarket/grocery store
Consumer Behavior - Money monthly spent on food at other stores
Consumer Behavior - Money monthly spent on eating out
Consumer Behavior - Money monthly spent on carryout/delivered foods
Consumer Behavior - Income spent on food at supermarket/grocery store (%)
Consumer Behavior - Income spent on food at other stores (%)
Consumer Behavior - Income spent on eating out (%)
Consumer Behavior - Income spent on carryout/delivered foods (%)
Current Health Status - General health condition (%)
Current Health Status - Blood donors (%)
Current Health Status - Has blood ever tested for HIV virus (%)
Current Health Status - Left-handed people (%)
Dermatology - People using sunscreen (%)
Diabetes - Diabetics (%)
Diabetes - Had a blood test for high blood sugar (%)
Diabetes - People taking insulin (%)
Diet Behavior & Nutrition - Diet health (%)
Diet Behavior & Nutrition - Milk product consumption (# of products/month)
Diet Behavior & Nutrition - Meals not home prepared (#/week)
Diet Behavior & Nutrition - Meals from fast food or pizza place (#/week)
Diet Behavior & Nutrition - Ready-to-eat foods (#/month)
Diet Behavior & Nutrition - Frozen meals/pizza (#/month)
Drug Use - People that ever used marijuana or hashish (%)
Drug Use - Ever used hard drugs (%)
Drug Use - Ever used any form of cocaine (%)
Drug Use - Ever used heroin (%)
Drug Use - Ever used methamphetamine (%)
Health Insurance - People covered by health insurance (%)
Kidney Conditions-Urology - Avg. # of times urinating at night
Medical Conditions - People with asthma (%)
Medical Conditions - People with anemia (%)
Medical Conditions - People with psoriasis (%)
Medical Conditions - People with overweight (%)
Medical Conditions - Elderly people having difficulties in thinking or remembering (%)
Medical Conditions - People who ever received blood transfusion (%)
Medical Conditions - People having trouble seeing even with glass/contacts (%)
Medical Conditions - People with arthritis (%)
Medical Conditions - People with gout (%)
Medical Conditions - People with congestive heart failure (%)
Medical Conditions - People with coronary heart disease (%)
Medical Conditions - People with angina pectoris (%)
Medical Conditions - People who ever had heart attack (%)
Medical Conditions - People who ever had stroke (%)
Medical Conditions - People with emphysema (%)
Medical Conditions - People with thyroid problem (%)
Medical Conditions - People with chronic bronchitis (%)
Medical Conditions - People with any liver condition (%)
Medical Conditions - People who ever had cancer or malignancy (%)
Mental Health - People who have little interest in doing things (%)
Mental Health - People feeling down, depressed, or hopeless (%)
Mental Health - People who have trouble sleeping or sleeping too much (%)
Mental Health - People feeling tired or having little energy (%)
Mental Health - People with poor appetite or overeating (%)
Mental Health - People feeling bad about themself (%)
Mental Health - People who have trouble concentrating on things (%)
Mental Health - People moving or speaking slowly or too fast (%)
Mental Health - People having thoughts they would be better off dead (%)
Oral Health - Average years since last visit a dentist
Oral Health - People embarrassed because of mouth (%)
Oral Health - People with gum disease (%)
Oral Health - General health of teeth and gums (%)
Oral Health - Average days a week using dental floss/device
Oral Health - Average days a week using mouthwash for dental problem
Oral Health - Average number of teeth
Pesticide Use - Households using pesticides to control insects (%)
Pesticide Use - Households using pesticides to kill weeds (%)
Physical Activity - People doing vigorous-intensity work activities (%)
Physical Activity - People doing moderate-intensity work activities (%)
Physical Activity - People walking or bicycling (%)
Physical Activity - People doing vigorous-intensity recreational activities (%)
Physical Activity - People doing moderate-intensity recreational activities (%)
Physical Activity - Average hours a day doing sedentary activities
Physical Activity - Average hours a day watching TV or videos
Physical Activity - Average hours a day using computer
Physical Functioning - People having limitations keeping them from working (%)
Physical Functioning - People limited in amount of work they can do (%)
Physical Functioning - People that need special equipment to walk (%)
Physical Functioning - People experiencing confusion/memory problems (%)
Physical Functioning - People requiring special healthcare equipment (%)
Prescription Medications - Average number of prescription medicines taking
Preventive Aspirin Use - Adults 40+ taking low-dose aspirin (%)
Reproductive Health - Vaginal deliveries (%)
Reproductive Health - Cesarean deliveries (%)
Reproductive Health - Deliveries resulted in a live birth (%)
Reproductive Health - Pregnancies resulted in a delivery (%)
Reproductive Health - Women breastfeeding newborns (%)
Reproductive Health - Women that had a hysterectomy (%)
Reproductive Health - Women that had both ovaries removed (%)
Reproductive Health - Women that have ever taken birth control pills (%)
Reproductive Health - Women taking birth control pills (%)
Reproductive Health - Women that have ever used Depo-Provera or injectables (%)
Reproductive Health - Women that have ever used female hormones (%)
Sexual Behavior - People 18+ that ever had sex (vaginal, anal, or oral) (%)
Sexual Behavior - Males 18+ that ever had vaginal sex with a woman (%)
Sexual Behavior - Males 18+ that ever performed oral sex on a woman (%)
Sexual Behavior - Males 18+ that ever had anal sex with a woman (%)
Sexual Behavior - Males 18+ that ever had any sex with a man (%)
Sexual Behavior - Females 18+ that ever had vaginal sex with a man (%)
Sexual Behavior - Females 18+ that ever performed oral sex on a man (%)
Sexual Behavior - Females 18+ that ever had anal sex with a man (%)
Sexual Behavior - Females 18+ that ever had any kind of sex with a woman (%)
Sexual Behavior - Average age people first had sex
Sexual Behavior - Average number of female sex partners in lifetime (males 18+)
Sexual Behavior - Average number of female vaginal sex partners in lifetime (males 18+)
Sexual Behavior - Average age people first performed oral sex on a woman (18+)
Sexual Behavior - Average number of woman performed oral sex on in lifetime (18+)
Sexual Behavior - Average number of male sex partners in lifetime (males 18+)
Sexual Behavior - Average number of male anal sex partners in lifetime (males 18+)
Sexual Behavior - Average age people first performed oral sex on a man (18+)
Sexual Behavior - Average number of male oral sex partners in lifetime (18+)
Sexual Behavior - People using protection when performing oral sex (%)
Sexual Behavior - Average number of times people have vaginal or anal sex a year
Sexual Behavior - People having sex without condom (%)
Sexual Behavior - Average number of male sex partners in lifetime (females 18+)
Sexual Behavior - Average number of male vaginal sex partners in lifetime (females 18+)
Sexual Behavior - Average number of female sex partners in lifetime (females 18+)
Sexual Behavior - Circumcised males 18+ (%)
Sleep Disorders - Average hours sleeping at night
Sleep Disorders - People that has trouble sleeping (%)
Smoking-Cigarette Use - People smoking cigarettes (%)
Taste & Smell - People 40+ having problems with smell (%)
Taste & Smell - People 40+ having problems with taste (%)
Taste & Smell - People 40+ that ever had wisdom teeth removed (%)
Taste & Smell - People 40+ that ever had tonsils teeth removed (%)
Taste & Smell - People 40+ that ever had a loss of consciousness because of a head injury (%)
Taste & Smell - People 40+ that ever had a broken nose or other serious injury to face or skull (%)
Taste & Smell - People 40+ that ever had two or more sinus infections (%)
Weight - Average height (inches)
Weight - Average weight (pounds)
Weight - Average BMI
Weight - People that are obese (%)
Weight - People that ever were obese (%)
Weight - People trying to lose weight (%)
Urban population: 13,043
Rural population: 170
Estimated median house/condo value in 2022: $153,603
70811:
$153,603Louisiana:
$209,200
Median resident age: This zip code:
39.7 yearsLouisiana median age:
38.2 years
Average household size: This zip code:
2.8 peopleLouisiana:
2.5 people
Averages for the 2020 tax year for zip code 70811, filed in 2021:
Average Adjusted Gross Income (AGI) in 2020: $35,073 (Individual Income Tax Returns) Here:
$35,073State:
$60,757
Salary/wage: $31,939 (reported on 80.1% of returns )Here:
$31,939State:
$50,882
(% of AGI for various income ranges: 1143.9% for AGIs below $25k , 3482.7% for AGIs $25k-50k , 7099.3% for AGIs $50k-75k , 9907.1% for AGIs $75k-100k , 18954.6% for AGIs $100k-200k ) Taxable interest for individuals: $403 (reported on 12.5% of returns )This zip code:
$403Louisiana:
$1,576
(% of AGI for various income ranges: 2.2% for AGIs below $25k , 5.3% for AGIs $25k-50k , 11.6% for AGIs $50k-75k , 34.7% for AGIs $75k-100k , 43.1% for AGIs $100k-200k ) Ordinary dividends: $2,338 (reported on 4.1% of returns )(% of AGI for various income ranges: 2.5% for AGIs below $25k , 5.2% for AGIs $25k-50k , 18.8% for AGIs $50k-75k , 65.3% for AGIs $75k-100k , 180.8% for AGIs $100k-200k ) Net capital gain/loss in AGI: +$2,584 (reported on 3.3% of returns )Here:
+$2,584State:
+$16,917
(% of AGI for various income ranges: 2.8% for AGIs $25k-50k , 15.8% for AGIs $50k-75k , 52.4% for AGIs $75k-100k , 230.0% for AGIs $100k-200k ) Profit/loss from business: +$20 (reported on 24.7% of returns )(% of AGI for various income ranges: 53.8% for AGIs below $25k , 436.9% for AGIs $100k-200k ) Taxable individual retirement arrangement distribution: $17,032 (reported on 4.8% of returns )70811:
$17,032Louisiana:
$20,716
(% of AGI for various income ranges: 23.7% for AGIs below $25k , 46.7% for AGIs $25k-50k , 160.5% for AGIs $50k-75k , 482.4% for AGIs $75k-100k , 1560.0% for AGIs $100k-200k ) Total itemized deductions: $30,389 (reported on 6.3% of returns )Here:
$30,389State:
$36,265
(% of AGI for various income ranges: 26.3% for AGIs below $25k , 202.2% for AGIs $25k-50k , 677.0% for AGIs $50k-75k , 1351.8% for AGIs $75k-100k , 1926.2% for AGIs $100k-200k ) Charity contributions: $10,776 (reported on 5.7% of returns )Here:
$10,776State:
$13,106
(% of AGI for various income ranges: 4.6% for AGIs below $25k , 54.2% for AGIs $25k-50k , 210.7% for AGIs $50k-75k , 462.9% for AGIs $75k-100k , 748.5% for AGIs $100k-200k ) Taxes paid: $4,686 (reported on 6.0% of returns )(% of AGI for various income ranges: 2.6% for AGIs below $25k , 28.9% for AGIs $25k-50k , 94.2% for AGIs $50k-75k , 188.8% for AGIs $75k-100k , 335.4% for AGIs $100k-200k ) Earned income credit: $2,987 (reported on 36.0% of returns )(% of AGI for various income ranges: 197.9% for AGIs below $25k , 111.3% for AGIs $25k-50k ) Percentage of individuals using paid preparers for their 2020 taxes: 91.3%(% for various income ranges: 91.1% for AGIs below $25k , 92.3% for AGIs $25k-50k , 89.2% for AGIs $50k-75k , 89.7% for AGIs $75k-100k , 100.0% for AGIs $100k-200k , 0.0% for AGIs over 200k )
Averages for the 2012 tax year for zip code 70811, filed in 2013:
Average Adjusted Gross Income (AGI) in 2012: $33,422 (Individual Income Tax Returns) Here:
$33,422State:
$56,730
Salary/wage: $30,640 (reported on 86.5% of returns )Here:
$30,640State:
$45,545
(% of AGI for various income ranges: 82.9% for AGIs below $25k , 84.1% for AGIs $25k-50k , 78.1% for AGIs $50k-75k , 73.2% for AGIs $75k-100k , 72.6% for AGIs $100k-200k ) Taxable interest for individuals: $799 (reported on 14.8% of returns )This zip code:
$799Louisiana:
$1,804
(% of AGI for various income ranges: 0.3% for AGIs below $25k , 0.5% for AGIs $25k-50k , 0.5% for AGIs $50k-75k , 0.2% for AGIs $75k-100k , 0.3% for AGIs $100k-200k ) Ordinary dividends: $2,441 (reported on 5.5% of returns )(% of AGI for various income ranges: 0.2% for AGIs below $25k , 0.2% for AGIs $25k-50k , 0.5% for AGIs $50k-75k , 0.4% for AGIs $75k-100k , 0.9% for AGIs $100k-200k ) Net capital gain/loss in AGI: +$6,100 (reported on 2.8% of returns )Here:
+$6,100State:
+$17,096
(% of AGI for various income ranges: 0.2% for AGIs $25k-50k , 0.1% for AGIs $50k-75k , 1.2% for AGIs $75k-100k , 1.6% for AGIs $100k-200k ) Profit/loss from business: +$2,104 (reported on 21.5% of returns )Here:
+$2,104State:
+$12,088
(% of AGI for various income ranges: 6.8% for AGIs below $25k , 0.2% for AGIs $75k-100k , 0.4% for AGIs $100k-200k ) Taxable individual retirement arrangement distribution: $11,703 (reported on 5.4% of returns )70811:
$11,703Louisiana:
$16,085
(% of AGI for various income ranges: 1.0% for AGIs below $25k , 1.5% for AGIs $25k-50k , 2.1% for AGIs $50k-75k , 3.4% for AGIs $75k-100k , 2.3% for AGIs $100k-200k ) Total itemized deductions: $19,020 (31% of AGI, reported on 23.3% of returns )Here:
$19,020State:
$23,585
Here:
31.3% of AGIState:
18.1% of AGI
(% of AGI for various income ranges: 6.0% for AGIs below $25k , 14.6% for AGIs $25k-50k , 17.1% for AGIs $50k-75k , 15.3% for AGIs $75k-100k , 14.3% for AGIs $100k-200k ) Charity contributions: $5,721 (reported on 20.1% of returns )(% of AGI for various income ranges: 1.1% for AGIs below $25k , 3.3% for AGIs $25k-50k , 4.2% for AGIs $50k-75k , 4.6% for AGIs $75k-100k , 4.8% for AGIs $100k-200k ) Taxes paid: $2,769 (reported on 23.2% of returns )(% of AGI for various income ranges: 0.7% for AGIs below $25k , 1.6% for AGIs $25k-50k , 2.4% for AGIs $50k-75k , 2.5% for AGIs $75k-100k , 3.0% for AGIs $100k-200k ) Earned income credit: $2,844 (reported on 40.9% of returns )(% of AGI for various income ranges: 14.0% for AGIs below $25k , 1.7% for AGIs $25k-50k ) Percentage of individuals using paid preparers for their 2012 taxes: 49.1%(% for various income ranges: 48.3% for AGIs below $25k , 47.0% for AGIs $25k-50k , 52.3% for AGIs $50k-75k , 56.7% for AGIs $75k-100k , 55.6% for AGIs $100k-200k )
Averages for the 2004 tax year for zip code 70811, filed in 2005:
Average Adjusted Gross Income (AGI) in 2004: $28,715 (Individual Income Tax Returns) Here:
$28,715State:
$39,411
Salary/wage: $26,841 (reported on 89.7% of returns )Here:
$26,841State:
$34,434
(% of AGI for various income ranges: 88.7% for AGIs below $10k , 85.1% for AGIs $10k-25k , 87.1% for AGIs $25k-50k , 83.7% for AGIs $50k-75k , 83.2% for AGIs $75k-100k , 72.0% for AGIs over 100k ) Taxable interest for individuals: $834 (reported on 22.5% of returns )This zip code:
$834Louisiana:
$1,606
(% of AGI for various income ranges: 1.2% for AGIs below $10k , 0.7% for AGIs $10k-25k , 0.6% for AGIs $25k-50k , 0.5% for AGIs $50k-75k , 0.8% for AGIs $75k-100k , 0.8% for AGIs over 100k ) Taxable dividends: $1,840 (reported on 7.9% of returns )(% of AGI for various income ranges: 0.4% for AGIs below $10k , 0.3% for AGIs $10k-25k , 0.2% for AGIs $25k-50k , 0.4% for AGIs $50k-75k , 0.6% for AGIs $75k-100k , 1.7% for AGIs over 100k ) Net capital gain/loss: +$2,176 (reported on 5.3% of returns )Here:
+$2,176State:
+$8,531
(% of AGI for various income ranges: -0.2% for AGIs below $10k , -0.0% for AGIs $10k-25k , 0.1% for AGIs $25k-50k , 0.2% for AGIs $50k-75k , -0.0% for AGIs $75k-100k , 3.1% for AGIs over 100k ) Profit/loss from business: +$1,723 (reported on 13.0% of returns )Here:
+$1,723State:
+$9,128
(% of AGI for various income ranges: 6.7% for AGIs below $10k , 2.3% for AGIs $10k-25k , -0.1% for AGIs $25k-50k , -0.7% for AGIs $50k-75k , 0.0% for AGIs $75k-100k , 1.6% for AGIs over 100k ) IRA payment deduction: $2,356 (reported on 1.1% of returns )70811:
$2,356Louisiana:
$3,055
Total itemized deductions: $16,407 (30% of AGI, reported on 21.7% of returns )Here:
$16,407State:
$18,222
Here:
30.1% of AGIState:
20.3% of AGI
(% of AGI for various income ranges: 2.6% for AGIs below $10k , 5.2% for AGIs $10k-25k , 14.9% for AGIs $25k-50k , 14.6% for AGIs $50k-75k , 14.4% for AGIs $75k-100k , 16.7% for AGIs over 100k ) Charity contributions deductions: $4,967 (9% of AGI, reported on 20.1% of returns )Here:
8.9% of AGIState:
4.4% of AGI
(% of AGI for various income ranges: 0.2% for AGIs below $10k , 1.0% for AGIs $10k-25k , 3.7% for AGIs $25k-50k , 4.3% for AGIs $50k-75k , 4.8% for AGIs $75k-100k , 5.8% for AGIs over 100k ) Total tax: $3,312 (reported on 59.1% of returns )(% of AGI for various income ranges: 1.9% for AGIs below $10k , 2.5% for AGIs $10k-25k , 5.4% for AGIs $25k-50k , 8.2% for AGIs $50k-75k , 10.3% for AGIs $75k-100k , 14.3% for AGIs over 100k ) Earned income credit: $2,268 (reported on 39.0% of returns )Percentage of individuals using paid preparers for their 2004 taxes: 58.2%(% for various income ranges: 55.0% for AGIs below $10k , 64.3% for AGIs $10k-25k , 54.1% for AGIs $25k-50k , 54.1% for AGIs $50k-75k , 55.6% for AGIs $75k-100k , 63.0% for AGIs over 100k )
Estimated median household income in 2022: This zip code:
$37,162Louisiana:
$55,416
Nearest zip codes: 70812 ,
70714 ,
70805 ,
70814 ,
70818 ,
70807 .
Merrydale Zip Code Map
Percentage of family households: This zip code:
35.7%Louisiana:
44.4%
Percentage of households with unmarried partners: This zip code:
5.9%Louisiana:
41.5%
Likely homosexual households (counted as self-reported same-sex unmarried-partner households)
Lesbian couples: 0.8% of all households Gay men: 0.0% of all households
Household received Food Stamps/SNAP in the past 12 months: 1,495Household did not receive Food Stamps/SNAP in the past 12 months: 3,287
Women who had a birth in the past 12 months: 68 (22 now married , 46 unmarried) Women who did not have a birth in the past 12 months: 2,975 (545 now married , 2,450 unmarried)
Housing units in zip code 70811 with a mortgage: 1,617 (83
second mortgage , 43
both second mortgage and home equity loan )
Houses without a mortgage: 18
Median monthly owner costs for units with a mortgage: $1,166
Median monthly owner costs for units without a mortgage: $391
Residents with income below the poverty level in 2022:
This zip code:
22.3%Whole state:
18.6%
Residents with income below 50% of the poverty level in 2022:
This zip code:
15.1%Whole state:
10.1%
Median number of rooms in houses and condos: Median number of rooms in apartments: Notable locations in this zip code not listed on our city pages
Click to draw/clear zip code borders Notable locations in zip code 70811: (A) , East Baton Rouge Fire District 6 Station 52 (B) , Brownsfield Volunteer Fire Department Station 21 (C) , Baton Rouge Fire Department Station 14 (D) , Baton Rouge Health Care Center (E) . Display/hide their locations on the map
Shopping Centers: (1) , Plank Plaza Shopping Center (2) . Display/hide their locations on the map
Churches in zip code 70811 include: (A) , Ministry of Love (B) , Mary's House of Bread Church (C) , Life Tabernacle Church (D) , Little Zion Baptist Church (E) , Jordan United Methodist Church (F) , Full Gospel United Pentecostal Church (G) , Foster Road Baptist Church (H) , House of Prayer (I) . Display/hide their locations on the map
Streams, rivers, and creeks: (A) , Blackwater Bayou (B) , White Bayou (C) . Display/hide their locations on the map
Parks in zip code 70811 include: (1) , Samuel D'Agostino Park (2) , Comite River Park (3) , Hooper Park (4) , James Watson Park (5) . Display/hide their locations on the map
Tourist attractions (not listed on the city page) : (1) , East Baton Rouge Parish School System - Schools- Baton Rouge Preparatory Academy- Lib (Cultural Attractions- Events- & Facilities; 5959 Cadillac Street) (2) , East Baton Rouge Parish - Brec-Recreation and Park Commission- Other Programs & Facili (Cultural Attractions- Events- & Facilities; 12206 Foster Road) (3) , East Baton Rouge Parish School System - Schools- Sharon Hills Elementary School- Lib (Cultural Attractions- Events- & Facilities; 6450 Guynell Drive) (4) , Allens Play Land (Arcades & Amusements; 6437 Mickens Rd) (5) . Display/hide their approximate locations on the map
Year house built (houses)
0 2020 or later778 2010 to 2019280 2000 to 2009421 1990 to 1999691 1980 to 19891,484 1970 to 1979858 1960 to 1969444 1950 to 195949 1940 to 194949 1939 or earlier
Zip code 70811 household income distribution in 2022 427 Less than $10,000314 $10,000 to $14,999304 $15,000 to $19,999417 $20,000 to $24,999370 $25,000 to $29,999371 $30,000 to $34,999253 $35,000 to $39,999256 $40,000 to $44,999102 $45,000 to $49,999198 $50,000 to $59,999388 $60,000 to $74,999591 $75,000 to $99,999247 $100,000 to $124,999130 $125,000 to $149,999233 $150,000 to $199,999121 $200,000 or moreEstimate of home value of owner-occupied houses/condos in 2022 in zip code 70811 203 Less than $10,00041 $10,000 to $14,99924 $15,000 to $19,9999 $30,000 to $34,99953 $35,000 to $39,99913 $50,000 to $59,999165 $60,000 to $69,99968 $70,000 to $79,999127 $80,000 to $89,999139 $90,000 to $99,999175 $100,000 to $124,999376 $125,000 to $149,999513 $150,000 to $174,999292 $175,000 to $199,999257 $200,000 to $249,999131 $250,000 to $299,99983 $300,000 to $399,99911 $400,000 to $499,99966 $500,000 to $749,9995 $1,000,000 to $1,499,999Rent paid by renters in 2022 in zip code 70811 66 $150 to $19987 $200 to $24971 $300 to $34946 $350 to $39911 $400 to $449113 $450 to $49998 $500 to $54966 $550 to $599121 $600 to $64967 $650 to $699194 $700 to $74943 $750 to $799109 $800 to $899104 $900 to $999173 $1,000 to $1,24996 $1,250 to $1,499181 $1,500 to $1,9994 $2,000 to $2,499111 No cash rent
Median gross rent in 2022: $911.
Median price asked for vacant for-sale houses and condos in 2022: $211,636.
Estimated median house (or condo) value in 2022 for: White Non-Hispanic householders: $154,665Black or African American householders: $155,940Asian householders: $138,094Two or more races householders: $98,153Hispanic or Latino householders: $187,170Estimated median house or condo value in 2022: $153,603
70811:
$153,603Louisiana:
$209,200
Lower value quartile - upper value quartile: $96,339 - $197,896
Mean price in 2022: Detached houses: $181,420Here:
$181,420State:
$273,555
Mobile homes: $13,789Here:
$13,789State:
$89,857
Housing units in structures:
One, detached: 3,953One, attached: 50Two: 153 or 4: 23910 to 19: 10820 to 49: 14150 or more: 386Mobile homes: 173Boats, RVs, vans, etc.: 20Unemployment : 8.2%
Means of transportation to work in zip code 70811 79.8% 4,267 Drove a car alone12.9% 692 Carpooled1.5% 78 Bus or trolley bus1.0% 51 Walked2.5% 133 Other means0.0% 1 Worked at homeTravel time to work (commute) in zip code 70811 152 Less than 5 minutes180 5 to 9 minutes655 10 to 14 minutes1,019 15 to 19 minutes592 20 to 24 minutes502 25 to 29 minutes1,096 30 to 34 minutes90 35 to 39 minutes148 40 to 44 minutes442 45 to 59 minutes158 60 to 89 minutes196 90 or more minutes
Percentage of zip code residents living and working in this county: 85.1%
Household type by relationship:
Households: 13,214
Male householders: 1,603 (360 living alone ), Female householders: 3,097 (1,407 living alone )1,322 spouses (1,322 opposite-sex spouses ), 274 unmarried partners , (242 opposite-sex unmarried partners ), 3,866 children (3,687 natural , 0 adopted , 173 stepchildren ), 1,314 grandchildren , 226 brothers or sisters , 143 parents , 252 foster children , 613 other relatives , 281 non-relatives In group quarters: 126 (-1 institutionalized population )
Size of family households: 1,152 2-persons , 567 3-persons , 354 4-persons , 345 5-persons , 118 6-persons , 117 7-or-more-persons
Size of nonfamily households: 1,758 1-person , 191 2-persons , 24 3-persons , 41 5-persons
439 married couples with children. single-parent households (173 men , 1,120 women ).
97.3% of residents of 70811 zip code speak English at home. of residents speak Spanish at home (81% very well, 4% well, 9% not well, 7% not at all ).of residents speak other Indo-European language at home (100% very well ).
Foreign born population: 133 (1.0%)
(36.7%
of them are naturalized citizens )
This zip code:
1.0%Whole state:
4.2%
32% Taiwan 32% Costa Rica 14% Guatemala 9% Honduras 9% Chile 2% American 1% French 1% Irish 1% English 0% European 0% German 0% African
Year of entry for the foreign-born population
53 2010 or later 36 2000 to 2009 0 1990 to 1999 89 Before 1990
Major facilities with environmental interests located in this zip code:
HARVEY HILBURN TRACTOR INC (5407 HOOPER RD in BATON ROUGE, LA)
(Resource Conservation and Recovery Act (tracking hazardous waste)) Organizations: BETTY HILBURN (CONTACT/OWNER)
, BETTY ZANE (CONTACT/OWNER)
, DAREN S HILBURN (CONTACT/OWNER)
, HARVEY HILBURN JR (CONTACT/OWNER)
, JAMES L HILBURN (CONTACT/OWNER)
, RUSSELL R HILBURN (CONTACT/OWNER)
, VIRGINIA JARHAUR (CONTACT/OWNER)
, VALLARIE LOUPE (CONTACT/OWNER)
BROWNFIELDS ELEMENTARY SCHOOL (11615 ELLEN DRIVE in BATON ROUGE, LA)
(Geographic Names Information System) (National Center for Education Statistics) - STATE ID-017018 Organizations: EAST BATON ROUGE PARISH SCHOOL BOARD (SCHOOL DISTRICT)
GLEN OAKS JUNIOR HIGH SCHOOL (5300 MONARCH STREET in BATON ROUGE, LA)
(Geographic Names Information System) (National Center for Education Statistics) - STATE ID-017036 Organizations: EAST BATON ROUGE PARISH SCHOOL BOARD (SCHOOL DISTRICT)
Alternative names: GLEN OAKS MIDDLE SCHOOL
BATON ROUGE PREPARATORY ACADEMY (5959 CADILLAC STREET in BATON ROUGE, LA)
(National Center for Education Statistics) - STATE ID-017025 Organizations: EAST BATON ROUGE PARISH SCHOOL BOARD (SCHOOL DISTRICT)
QUALA SYSTEMS INC (5395 HOOPER RD in BATON ROUGE, LA)
HAZARDOUS WASTE BIENNIAL REPORTER (Resource Conservation and Recovery Act (tracking hazardous waste)) Large Quantity Generators, more that 1000 kg of hazardous waste/month (Resource Conservation and Recovery Act (tracking hazardous waste)) - notification Organizations: B.J. BUZBY (CONTACT/OWNER)
ADVANCED TRANSMISSION (8932A PLANK RD in BATON ROUGE, LA)
(Resource Conservation and Recovery Act (tracking hazardous waste)) Organizations: WILLIAM D BABSON (CONTACT/OWNER)
MULTI FONTS (9019 GOVENOR PLEASANT DR in BATON ROUGE, LA)
(Resource Conservation and Recovery Act (tracking hazardous waste)) Business NAICS classification: COMMERCIAL LITHOGRAPHIC PRINTING.Organizations: GLYNN FONTENOT (CONTACT/OWNER)
ONE HOUR MARTINIZING (12262 PLANK RD in BATON ROUGE, LA)
(Resource Conservation and Recovery Act (tracking hazardous waste)) Organizations: SUPERVISORY SERVICES (CONTACT/OWNER)
EXPRESS CONTAINER SVC (5395 HOOPER RD in BATON ROUGE, LA)
AIR MINOR (AIRS/AFS) Alternative names: JAMES BURNETT
PLANK RD CLNRS (7332 PLANK RD in BATON ROUGE, LA)
Conditionally Exempt Small Quantity Generators, less than 100 kg/month of hazardous waste (Resource Conservation and Recovery Act (tracking hazardous waste)) - notification Organizations: DOMINICK FRESINA (CONTACT/OWNER)
, VINCENT FRESINA (CONTACT/OWNER)
H & H TENT SPECIALTIES INC. (1530 COMMERCIAL DRIVE in BATON ROUGE, LA)
National Pollutant Discharge Elimination System NON-MAJOR (Tracking pollutant discharge elimination systems) - permit
CHEVRON SS 109056 (4716 HOOPER RD in BATON ROUGE, LA)
Conditionally Exempt Small Quantity Generators, less than 100 kg/month of hazardous waste (Resource Conservation and Recovery Act (tracking hazardous waste)) - notification Organizations: KATHY NORRIS (CONTACT/OPERATOR)
, CHEVRON PRODUCTS CO (CONTACT/OWNER)
FOUR SEASONS TP (7950 HOOPER RD in BATON ROUGE, LA)
National Pollutant Discharge Elimination System NON-MAJOR (Tracking pollutant discharge elimination systems) - permit Business SIC classification: SEWERAGE SYSTEMSAlternative names: MILEY'S MOBILE HOME-, MILEY'S MOBILE HOME/K&W TRAILE
Housing units lacking complete plumbing facilities: 4.7%
Housing units lacking complete kitchen facilities: 5.2%
71.9% Electricity 26.7% Utility gas 1.1% Wood
Population in 1990: 13,653.
Place of birth for U.S.-born residents:
This state: 11,730Northeast: 46Midwest: 166South: 862West: 211
67% of the 70811 zip code residents lived in the same house 5 years ago.
Out of people who lived in different houses, 78% lived in this county.
Out of people who lived in different counties, 50% lived in Louisiana.
92% of the 70811 zip code residents lived in the same house 1 year ago.
Out of people who lived in different houses, 64% moved from this county.
Out of people who lived in different houses, 31% moved from different county within same state.
Out of people who lived in different houses, 1% moved from different state.
Out of people who lived in different houses, 5% moved from abroad.
Private vs. public school enrollment:
Students in private schools in grades 1 to 8 (elementary and middle school): 337
Here:
25.1%Louisiana:
19.6%
Students in private schools in grades 9 to 12 (high school): 70
Here:
13.9%Louisiana:
18.3%
Students in private undergraduate colleges: 59
Here:
13.7%Louisiana:
17.4%
Occupation by median earnings in the past 12 months ($)
79,476 Health technologists and technicians 68,540 Construction and extraction occupations 52,341 Installation, maintenance, and repair occupations 49,223 Community and social service occupations 48,603 Education, training, and library occupations 43,959 Production occupations
Top industries in this zip code by the number of employees in 2005:
Accommodation and Food Services: Limited-Service Restaurants (20-49 employees: 4 establishments, 10-19 employees: 2 establishments, 5-9 employees: 3 establishments)Health Care and Social Assistance: Nursing Care Facilities (100-249: 1)Other Services (except Public Administration): Religious Organizations (10-19: 4, 5-9: 2, 1-4: 8)Other Services (except Public Administration): Human Rights Organizations (50-99: 1)Educational Services: Elementary and Secondary Schools (20-49: 2)Health Care and Social Assistance: Child Day Care Services (10-19: 3, 5-9: 2, 1-4: 2)Construction: Commercial and Institutional Building Construction (20-49: 1, 10-19: 1)Finance and Insurance: Commercial Banking (10-19: 1, 5-9: 3)
People in group quarters in 2010:
11 people in group homes intended for adults
People in group quarters in 2000:
146 people in nursing homes
6 people in homes for the mentally retarded
5 people in other noninstitutional group quarters
Fatal accident statistics in 2014:
Fatal accident count: 2Vehicles involved in fatal accidents: 5Fatal accidents caused by drunken drivers: 1Fatalities: 2Persons involved in fatal accidents: 5Pedestrians involved in fatal accidents: 0
Fatal accident statistics in 2013:
Fatal accident count: 1Vehicles involved in fatal accidents: 1Fatal accidents caused by drunken drivers: 0Fatalities: 1Persons involved in fatal accidents: 1Pedestrians involved in fatal accidents: 0
Home Mortgage Disclosure Act Aggregated Statistics For Year 2009(Based on 2 full and 8 partial tracts) A) FHA, FSA/RHS & VA B) Conventional C) Refinancings D) Home Improvement Loans F) Non-occupant Loans on Number Average Value Number Average Value Number Average Value Number Average Value Number Average Value
LOANS ORIGINATED 86 $120,283 19 $94,663 175 $91,845 43 $19,747 37 $61,475 APPLICATIONS APPROVED, NOT ACCEPTED 2 $168,685 0 $0 43 $103,302 4 $54,310 6 $62,592 APPLICATIONS DENIED 31 $114,156 19 $126,171 223 $100,243 54 $34,483 13 $90,865 APPLICATIONS WITHDRAWN 13 $97,535 10 $84,789 98 $102,796 8 $58,764 7 $68,709 FILES CLOSED FOR INCOMPLETENESS 8 $97,009 2 $53,860 40 $98,758 5 $54,672 2 $54,215
Aggregated Statistics For Year 2008(Based on 2 full and 8 partial tracts) A) FHA, FSA/RHS & VA B) Conventional C) Refinancings D) Home Improvement Loans F) Non-occupant Loans on G) Loans On Manufactured Number Average Value Number Average Value Number Average Value Number Average Value Number Average Value Number Average Value
LOANS ORIGINATED 87 $115,489 68 $99,196 204 $98,324 52 $43,102 53 $64,238 4 $18,018 APPLICATIONS APPROVED, NOT ACCEPTED 20 $111,428 5 $111,742 89 $90,847 10 $52,611 11 $53,583 2 $68,250 APPLICATIONS DENIED 47 $120,541 38 $91,688 334 $102,039 119 $54,819 33 $66,684 6 $15,535 APPLICATIONS WITHDRAWN 9 $124,854 8 $94,164 62 $103,734 7 $71,297 7 $81,144 2 $18,045 FILES CLOSED FOR INCOMPLETENESS 4 $90,645 5 $91,928 19 $100,535 5 $60,424 0 $0 0 $0
Aggregated Statistics For Year 2007(Based on 2 full and 8 partial tracts) A) FHA, FSA/RHS & VA B) Conventional C) Refinancings D) Home Improvement Loans F) Non-occupant Loans on G) Loans On Manufactured Number Average Value Number Average Value Number Average Value Number Average Value Number Average Value Number Average Value
LOANS ORIGINATED 63 $106,113 229 $103,324 348 $100,174 60 $33,464 98 $74,641 6 $31,198 APPLICATIONS APPROVED, NOT ACCEPTED 3 $119,380 55 $96,905 151 $92,844 32 $51,863 12 $72,842 4 $38,722 APPLICATIONS DENIED 18 $115,227 136 $93,616 541 $95,052 179 $63,008 60 $79,428 6 $46,103 APPLICATIONS WITHDRAWN 3 $111,037 39 $88,687 139 $87,369 28 $44,876 18 $72,962 1 $21,840 FILES CLOSED FOR INCOMPLETENESS 5 $142,468 15 $101,517 47 $97,703 4 $64,550 7 $60,426 0 $0
Aggregated Statistics For Year 2006(Based on 2 full and 8 partial tracts) A) FHA, FSA/RHS & VA B) Conventional C) Refinancings D) Home Improvement Loans E) Loans on Dwellings For 5+ Families F) Non-occupant Loans on G) Loans On Manufactured Number Average Value Number Average Value Number Average Value Number Average Value Number Average Value Number Average Value Number Average Value
LOANS ORIGINATED 35 $101,900 343 $82,531 392 $88,005 65 $40,852 1 $121,190 78 $68,215 7 $49,966 APPLICATIONS APPROVED, NOT ACCEPTED 4 $74,985 88 $87,286 155 $96,808 15 $43,119 0 $0 6 $85,682 0 $0 APPLICATIONS DENIED 5 $97,664 193 $81,128 582 $89,520 146 $48,850 1 $305,700 42 $64,937 6 $33,762 APPLICATIONS WITHDRAWN 1 $86,970 59 $91,771 209 $92,774 23 $68,870 0 $0 9 $68,651 0 $0 FILES CLOSED FOR INCOMPLETENESS 1 $86,550 30 $98,824 108 $91,387 0 $0 1 $349,380 12 $61,084 0 $0
Aggregated Statistics For Year 2005(Based on 2 full and 8 partial tracts) A) FHA, FSA/RHS & VA B) Conventional C) Refinancings D) Home Improvement Loans E) Loans on Dwellings For 5+ Families F) Non-occupant Loans on G) Loans On Manufactured Number Average Value Number Average Value Number Average Value Number Average Value Number Average Value Number Average Value Number Average Value
LOANS ORIGINATED 42 $83,615 314 $73,847 396 $78,289 65 $27,713 1 $218,360 89 $55,911 6 $27,563 APPLICATIONS APPROVED, NOT ACCEPTED 3 $71,313 77 $75,182 141 $78,883 13 $39,602 0 $0 11 $70,403 2 $35,480 APPLICATIONS DENIED 12 $79,004 219 $74,524 591 $82,384 116 $35,025 0 $0 40 $55,907 9 $31,223 APPLICATIONS WITHDRAWN 9 $86,338 46 $76,918 306 $89,636 31 $96,166 0 $0 17 $106,800 3 $60,797 FILES CLOSED FOR INCOMPLETENESS 2 $111,190 17 $82,323 69 $94,275 3 $51,687 0 $0 2 $71,540 0 $0
Aggregated Statistics For Year 2004(Based on 2 full and 8 partial tracts) A) FHA, FSA/RHS & VA B) Conventional C) Refinancings D) Home Improvement Loans E) Loans on Dwellings For 5+ Families F) Non-occupant Loans on G) Loans On Manufactured Number Average Value Number Average Value Number Average Value Number Average Value Number Average Value Number Average Value Number Average Value
LOANS ORIGINATED 60 $82,340 221 $71,330 510 $76,121 63 $26,513 2 $201,985 96 $52,728 5 $62,782 APPLICATIONS APPROVED, NOT ACCEPTED 2 $100,140 59 $69,531 192 $78,659 16 $25,671 0 $0 8 $59,041 3 $16,003 APPLICATIONS DENIED 10 $79,586 110 $71,698 703 $75,278 97 $31,605 2 $132,570 35 $48,534 10 $50,994 APPLICATIONS WITHDRAWN 12 $96,343 49 $65,290 410 $80,610 12 $48,662 0 $0 5 $52,382 0 $0 FILES CLOSED FOR INCOMPLETENESS 0 $0 26 $67,447 45 $78,918 0 $0 0 $0 3 $55,140 2 $84,985
Aggregated Statistics For Year 2003(Based on 2 full and 8 partial tracts) A) FHA, FSA/RHS & VA B) Conventional C) Refinancings D) Home Improvement Loans F) Non-occupant Loans on Number Average Value Number Average Value Number Average Value Number Average Value Number Average Value
LOANS ORIGINATED 109 $79,283 163 $72,549 516 $69,202 46 $23,253 75 $49,877 APPLICATIONS APPROVED, NOT ACCEPTED 4 $50,320 46 $87,617 191 $70,507 6 $25,915 8 $60,048 APPLICATIONS DENIED 16 $64,371 72 $60,401 502 $68,613 90 $25,221 43 $45,415 APPLICATIONS WITHDRAWN 4 $108,362 25 $84,776 312 $76,362 2 $30,990 6 $47,128 FILES CLOSED FOR INCOMPLETENESS 4 $60,712 13 $73,986 40 $69,610 0 $0 5 $48,822
Aggregated Statistics For Year 2002(Based on 2 full and 8 partial tracts) A) FHA, FSA/RHS & VA B) Conventional C) Refinancings D) Home Improvement Loans F) Non-occupant Loans on Number Average Value Number Average Value Number Average Value Number Average Value Number Average Value
LOANS ORIGINATED 120 $72,153 122 $70,700 409 $68,515 59 $17,907 48 $51,291 APPLICATIONS APPROVED, NOT ACCEPTED 8 $72,624 22 $71,427 148 $64,208 22 $23,088 6 $44,438 APPLICATIONS DENIED 22 $78,075 74 $53,603 415 $64,030 79 $19,606 16 $35,726 APPLICATIONS WITHDRAWN 15 $71,233 16 $66,312 176 $69,109 5 $22,378 11 $53,992 FILES CLOSED FOR INCOMPLETENESS 6 $81,612 11 $71,771 153 $80,887 0 $0 2 $43,570
Aggregated Statistics For Year 2001(Based on 2 full and 8 partial tracts) A) FHA, FSA/RHS & VA B) Conventional C) Refinancings D) Home Improvement Loans F) Non-occupant Loans on Number Average Value Number Average Value Number Average Value Number Average Value Number Average Value
LOANS ORIGINATED 118 $70,054 86 $63,349 458 $65,201 59 $16,267 68 $55,896 APPLICATIONS APPROVED, NOT ACCEPTED 4 $74,392 29 $73,881 102 $63,856 11 $20,229 13 $77,417 APPLICATIONS DENIED 19 $72,239 99 $56,427 657 $59,883 119 $14,183 22 $48,315 APPLICATIONS WITHDRAWN 8 $63,335 29 $78,638 238 $61,628 12 $22,338 3 $55,140 FILES CLOSED FOR INCOMPLETENESS 4 $81,885 11 $70,831 63 $68,197 0 $0 0 $0
Aggregated Statistics For Year 2000(Based on 2 full and 8 partial tracts) A) FHA, FSA/RHS & VA B) Conventional C) Refinancings D) Home Improvement Loans F) Non-occupant Loans on Number Average Value Number Average Value Number Average Value Number Average Value Number Average Value
LOANS ORIGINATED 156 $69,880 110 $67,344 323 $51,764 69 $20,745 29 $51,443 APPLICATIONS APPROVED, NOT ACCEPTED 7 $79,037 35 $50,516 165 $53,643 37 $19,339 17 $48,802 APPLICATIONS DENIED 50 $69,910 115 $52,409 618 $48,997 120 $11,600 31 $31,635 APPLICATIONS WITHDRAWN 15 $63,502 19 $57,757 292 $51,920 18 $24,776 4 $46,060 FILES CLOSED FOR INCOMPLETENESS 3 $78,863 13 $53,265 100 $62,051 2 $12,045 4 $98,915
Aggregated Statistics For Year 1999(Based on 1 full and 4 partial tracts) A) FHA, FSA/RHS & VA B) Conventional C) Refinancings D) Home Improvement Loans F) Non-occupant Loans on Number Average Value Number Average Value Number Average Value Number Average Value Number Average Value
LOANS ORIGINATED 83 $67,767 50 $60,992 212 $53,639 32 $17,379 24 $43,810 APPLICATIONS APPROVED, NOT ACCEPTED 2 $56,840 16 $59,882 81 $56,721 14 $27,812 7 $38,509 APPLICATIONS DENIED 13 $99,535 53 $52,288 211 $46,047 44 $10,898 17 $36,045 APPLICATIONS WITHDRAWN 14 $62,240 10 $74,162 128 $52,051 10 $30,672 4 $35,662 FILES CLOSED FOR INCOMPLETENESS 2 $66,955 3 $32,577 62 $52,715 3 $16,153 7 $52,513
Private Mortgage Insurance Companies Aggregated Statistics For Year 2009(Based on 2 full and 8 partial tracts) A) Conventional B) Refinancings Number Average Value Number Average Value
LOANS ORIGINATED 1 $171,300 3 $183,167 APPLICATIONS APPROVED, NOT ACCEPTED 2 $160,600 0 $0 APPLICATIONS DENIED 0 $0 0 $0 APPLICATIONS WITHDRAWN 0 $0 0 $0 FILES CLOSED FOR INCOMPLETENESS 0 $0 0 $0
Aggregated Statistics For Year 2008(Based on 2 full and 8 partial tracts) A) Conventional B) Refinancings C) Non-occupant Loans on Number Average Value Number Average Value Number Average Value
LOANS ORIGINATED 41 $114,822 26 $123,971 7 $99,761 APPLICATIONS APPROVED, NOT ACCEPTED 30 $133,132 11 $125,449 2 $42,990 APPLICATIONS DENIED 2 $65,045 1 $111,360 0 $0 APPLICATIONS WITHDRAWN 2 $70,225 0 $0 0 $0 FILES CLOSED FOR INCOMPLETENESS 4 $122,475 0 $0 0 $0
Aggregated Statistics For Year 2007(Based on 2 full and 8 partial tracts) A) Conventional B) Refinancings C) Non-occupant Loans on Number Average Value Number Average Value Number Average Value
LOANS ORIGINATED 170 $110,813 43 $105,827 17 $80,651 APPLICATIONS APPROVED, NOT ACCEPTED 23 $90,870 17 $96,126 2 $80,985 APPLICATIONS DENIED 8 $121,282 0 $0 0 $0 APPLICATIONS WITHDRAWN 5 $79,354 4 $102,232 2 $69,495 FILES CLOSED FOR INCOMPLETENESS 0 $0 0 $0 0 $0
Aggregated Statistics For Year 2006(Based on 2 full and 8 partial tracts) A) Conventional B) Refinancings C) Non-occupant Loans on Number Average Value Number Average Value Number Average Value
LOANS ORIGINATED 78 $101,351 26 $92,489 7 $81,960 APPLICATIONS APPROVED, NOT ACCEPTED 19 $89,046 5 $84,684 5 $66,138 APPLICATIONS DENIED 0 $0 0 $0 0 $0 APPLICATIONS WITHDRAWN 2 $151,140 3 $85,340 3 $79,153 FILES CLOSED FOR INCOMPLETENESS 0 $0 0 $0 0 $0
Aggregated Statistics For Year 2005(Based on 2 full and 8 partial tracts) A) Conventional B) Refinancings C) Non-occupant Loans on Number Average Value Number Average Value Number Average Value
LOANS ORIGINATED 66 $85,008 35 $86,618 18 $65,965 APPLICATIONS APPROVED, NOT ACCEPTED 7 $101,041 4 $67,270 1 $139,520 APPLICATIONS DENIED 0 $0 0 $0 0 $0 APPLICATIONS WITHDRAWN 4 $60,602 0 $0 2 $76,500 FILES CLOSED FOR INCOMPLETENESS 0 $0 2 $77,965 2 $77,965
Aggregated Statistics For Year 2004(Based on 2 full and 8 partial tracts) A) Conventional B) Refinancings C) Non-occupant Loans on Number Average Value Number Average Value Number Average Value
LOANS ORIGINATED 61 $78,375 47 $89,523 18 $58,724 APPLICATIONS APPROVED, NOT ACCEPTED 10 $109,624 10 $62,901 2 $44,240 APPLICATIONS DENIED 1 $72,850 1 $68,730 1 $68,730 APPLICATIONS WITHDRAWN 2 $122,975 8 $69,830 3 $72,270 FILES CLOSED FOR INCOMPLETENESS 0 $0 2 $83,510 0 $0
Aggregated Statistics For Year 2003(Based on 2 full and 8 partial tracts) A) Conventional B) Refinancings C) Non-occupant Loans on Number Average Value Number Average Value Number Average Value
LOANS ORIGINATED 63 $70,020 51 $84,471 14 $44,107 APPLICATIONS APPROVED, NOT ACCEPTED 11 $70,256 21 $77,164 2 $65,890 APPLICATIONS DENIED 4 $42,400 2 $68,165 3 $41,757 APPLICATIONS WITHDRAWN 9 $67,739 5 $104,826 2 $30,515 FILES CLOSED FOR INCOMPLETENESS 0 $0 4 $101,480 0 $0
Aggregated Statistics For Year 2002(Based on 2 full and 8 partial tracts) A) Conventional B) Refinancings C) Non-occupant Loans on Number Average Value Number Average Value Number Average Value
LOANS ORIGINATED 29 $71,381 37 $90,760 2 $55,015 APPLICATIONS APPROVED, NOT ACCEPTED 13 $66,911 21 $83,679 2 $55,990 APPLICATIONS DENIED 3 $99,660 2 $49,345 1 $34,940 APPLICATIONS WITHDRAWN 4 $87,090 7 $78,594 0 $0 FILES CLOSED FOR INCOMPLETENESS 0 $0 0 $0 0 $0
Aggregated Statistics For Year 2001(Based on 2 full and 8 partial tracts) A) Conventional B) Refinancings C) Non-occupant Loans on Number Average Value Number Average Value Number Average Value
LOANS ORIGINATED 29 $82,704 41 $88,797 8 $44,509 APPLICATIONS APPROVED, NOT ACCEPTED 5 $59,536 6 $71,628 0 $0 APPLICATIONS DENIED 2 $48,120 6 $63,015 0 $0 APPLICATIONS WITHDRAWN 2 $98,980 2 $52,075 0 $0 FILES CLOSED FOR INCOMPLETENESS 0 $0 3 $85,080 0 $0
Aggregated Statistics For Year 2000(Based on 2 full and 8 partial tracts) A) Conventional B) Refinancings C) Non-occupant Loans on Number Average Value Number Average Value Number Average Value
LOANS ORIGINATED 44 $78,701 22 $90,812 8 $67,594 APPLICATIONS APPROVED, NOT ACCEPTED 6 $92,370 0 $0 1 $82,980 APPLICATIONS DENIED 1 $65,330 2 $85,410 0 $0 APPLICATIONS WITHDRAWN 0 $0 2 $61,245 0 $0 FILES CLOSED FOR INCOMPLETENESS 0 $0 2 $67,985 0 $0
Aggregated Statistics For Year 1999(Based on 1 full and 4 partial tracts) A) Conventional B) Refinancings C) Non-occupant Loans on Number Average Value Number Average Value Number Average Value
LOANS ORIGINATED 16 $90,967 15 $65,383 1 $36,290 APPLICATIONS APPROVED, NOT ACCEPTED 0 $0 1 $51,220 0 $0 APPLICATIONS DENIED 1 $105,750 2 $43,130 1 $24,160 APPLICATIONS WITHDRAWN 1 $56,000 1 $66,170 1 $56,000 FILES CLOSED FOR INCOMPLETENESS 0 $0 0 $0 0 $0
2002 - 2018 National Fire Incident Reporting System (NFIRS) incidents See full 2006 National Fire Incident Reporting System statistics for zip code 70811, Louisiana
Most common first names in zip code 70811 among deceased individuals Name Count Lived (average)
Mary 70 75.7 years James 68 70.3 years John 63 73.6 years Joseph 55 69.7 years Willie 46 70.1 years George 33 72.7 years William 31 67.8 years Robert 29 65.2 years Charles 27 68.0 years Henry 26 72.0 years
Most common last names in zip code 70811 among deceased individuals Last name Count Lived (average)
Johnson 53 69.9 years Smith 52 73.0 years Williams 47 70.8 years Jackson 35 73.6 years Brown 27 72.1 years Jones 24 76.3 years Thomas 20 68.0 years Thompson 19 64.2 years Scott 19 61.2 years Davis 17 65.6 years
Businesses in zip code 70811
Name Count Name Count
Advance Auto Parts 1 McDonald's 1 Chevrolet 1 Nike 1 Circle K 2 Pizza Hut 1 Domino's Pizza 1 Popeyes 1 FedEx 1 Rite Aid 1 GNC 1 Subway 1
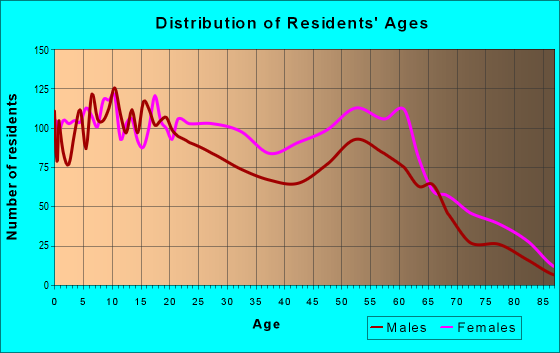
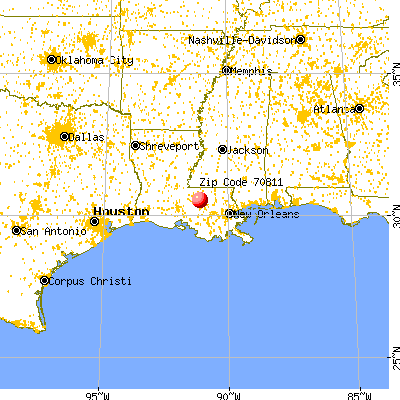


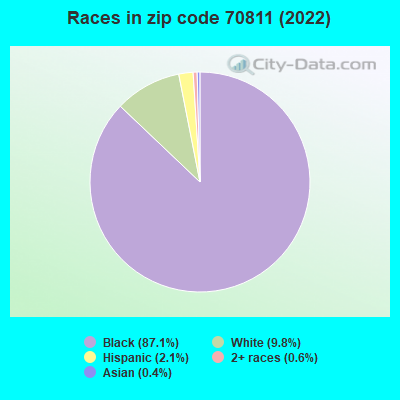


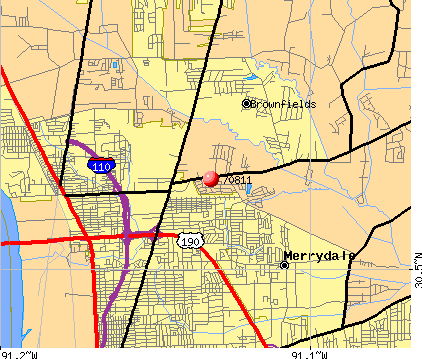 Nearest zip codes: 70812, 70714, 70805, 70814, 70818, 70807.
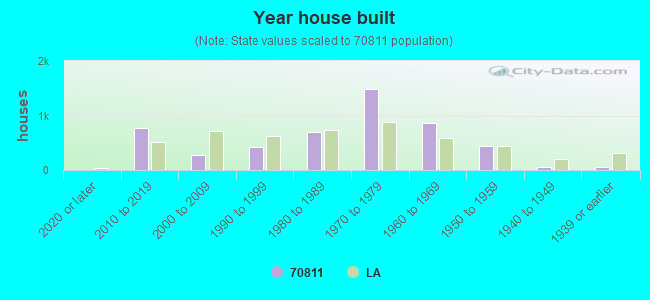
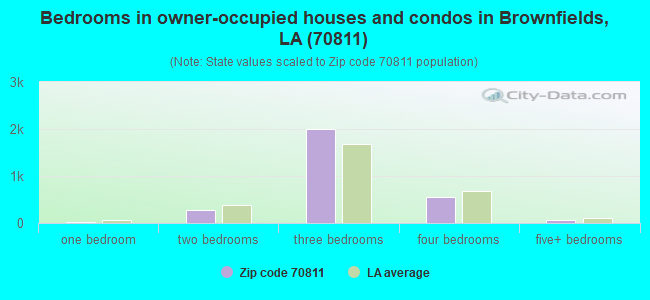
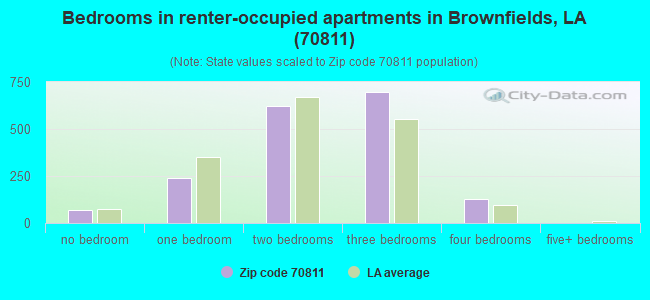
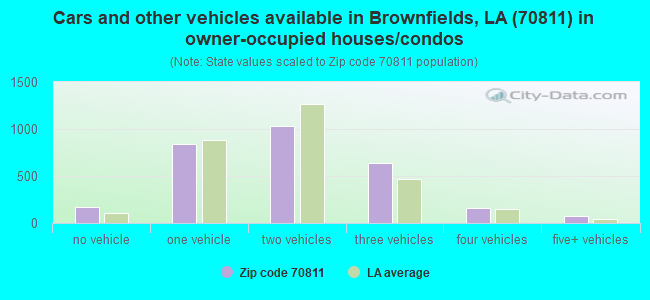
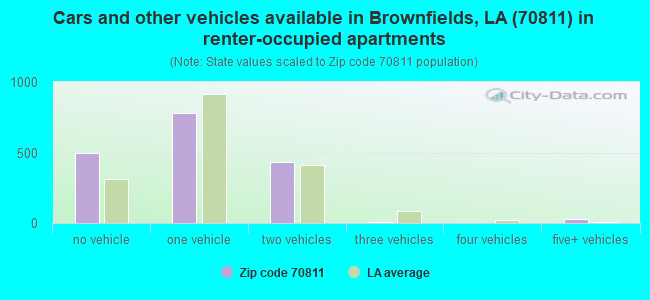


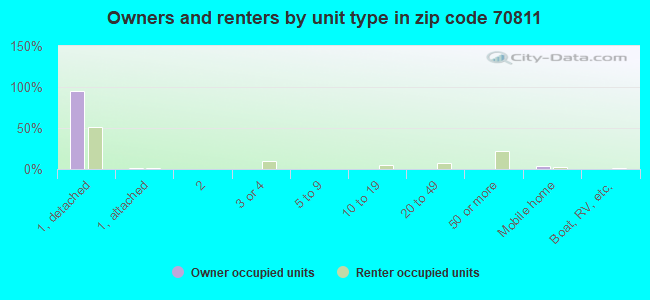
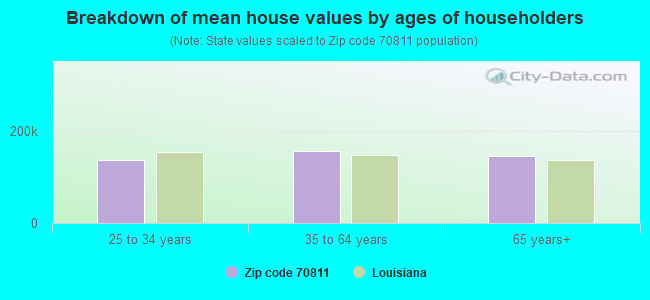


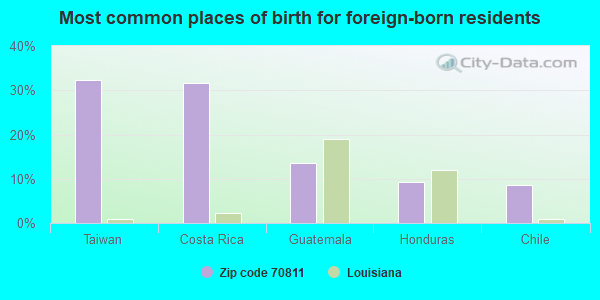
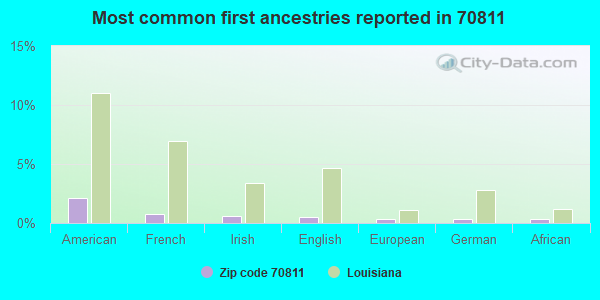
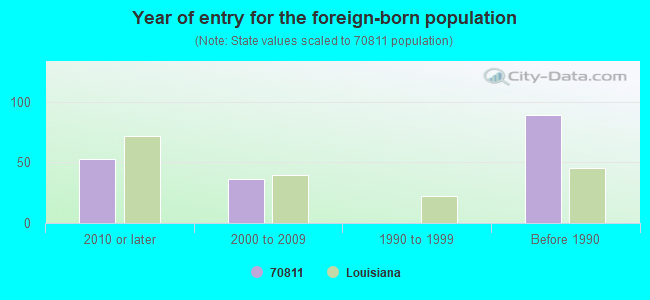
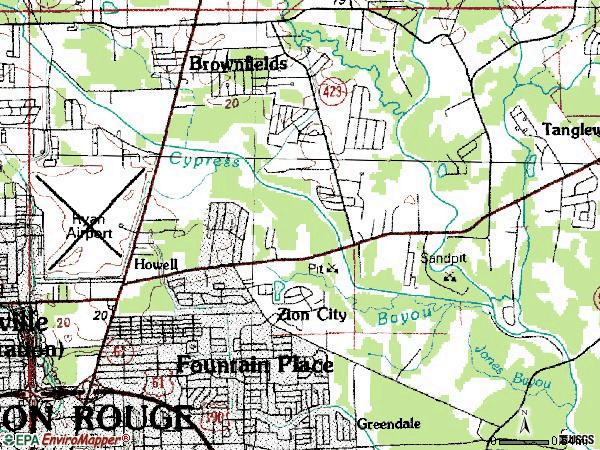

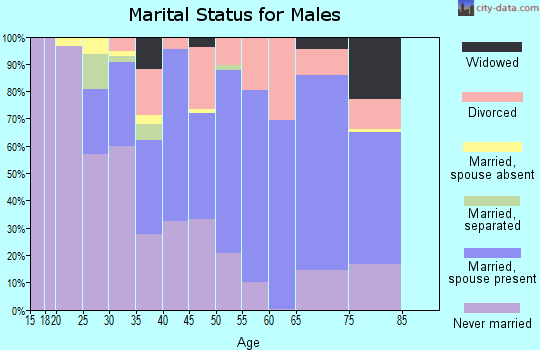
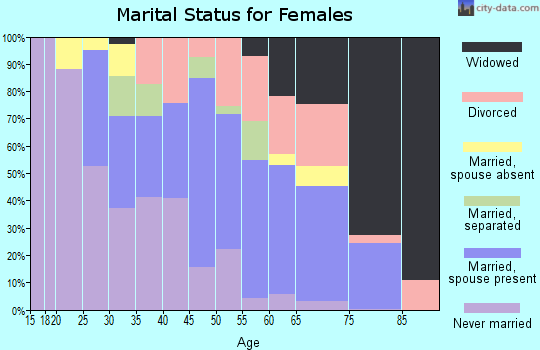
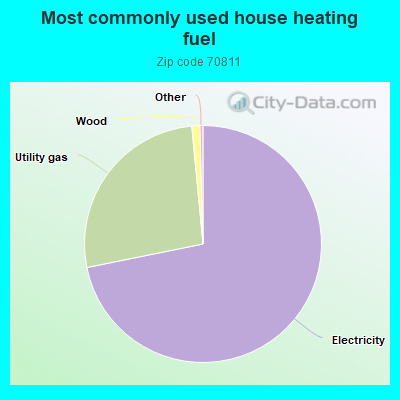
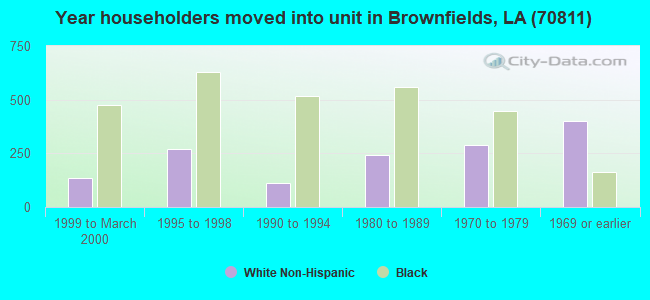
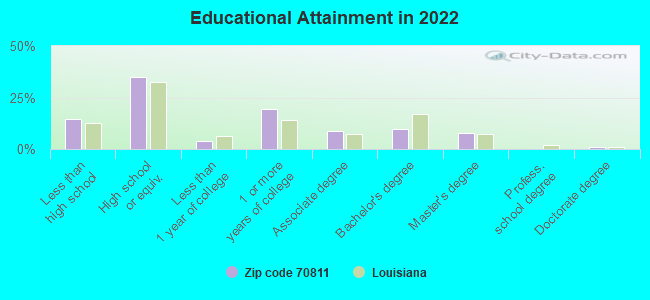
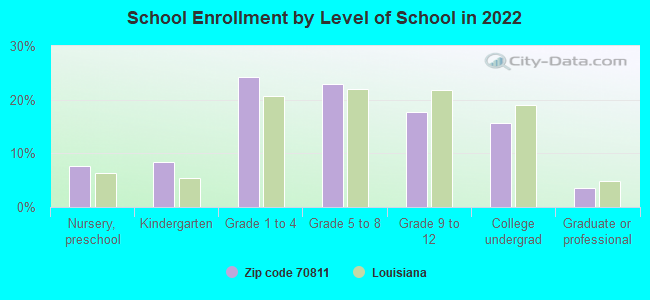
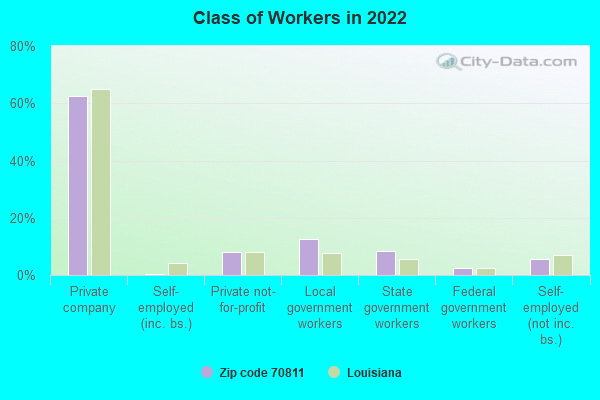
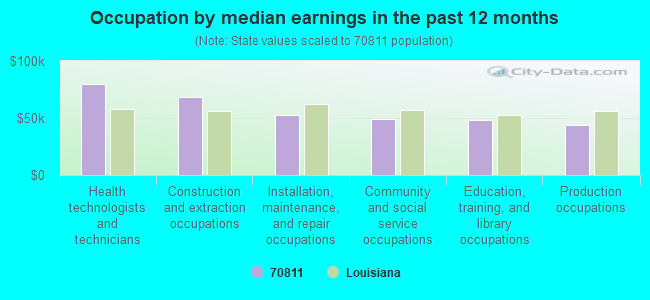
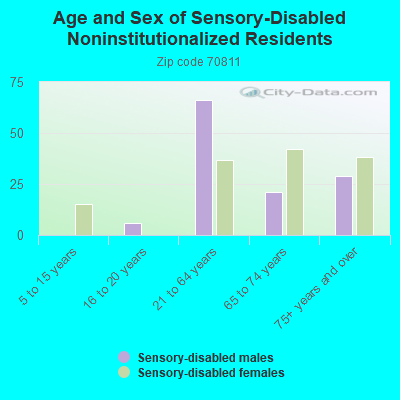
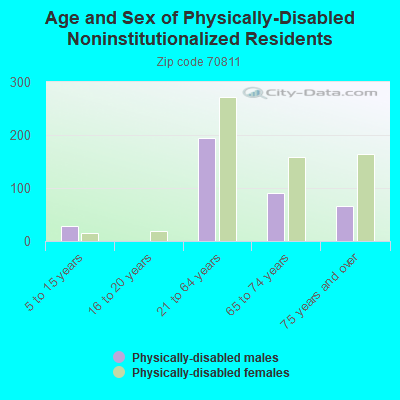
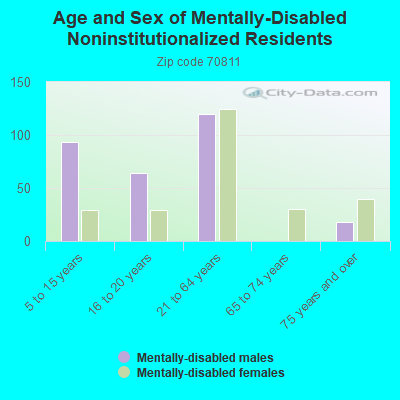
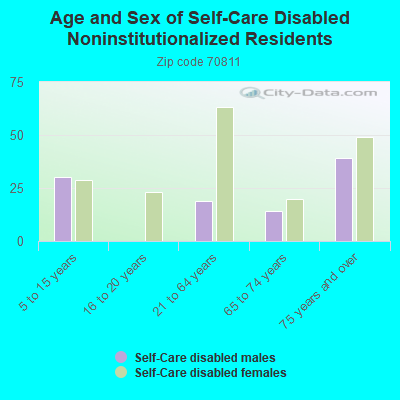
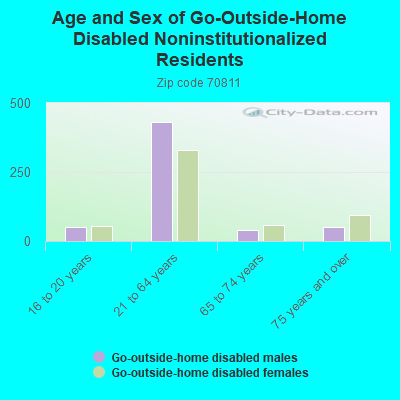
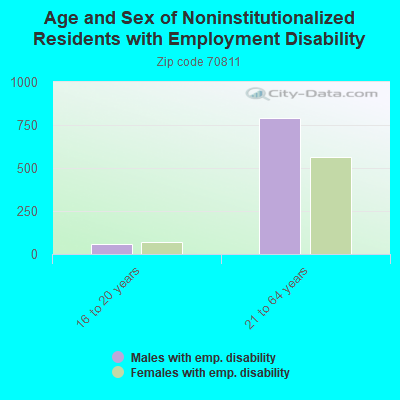
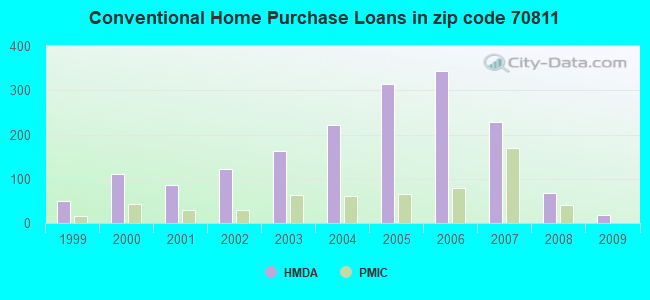
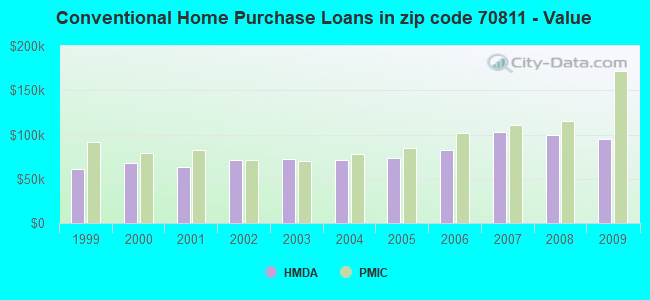
 Based on the data from the years 2002 - 2018 the average number of fires per year is 33. The highest number of fires - 50 took place in 2012, and the least - 5 in 2002. The data has a rising trend.
 When looking into fire subcategories, the most incidents belonged to: Structure Fires (43.8%), and Outside Fires (31.1%).