Estimated zip code population in 2022: 541 Zip code population in 2010: 538 Zip code population in 2000: 516
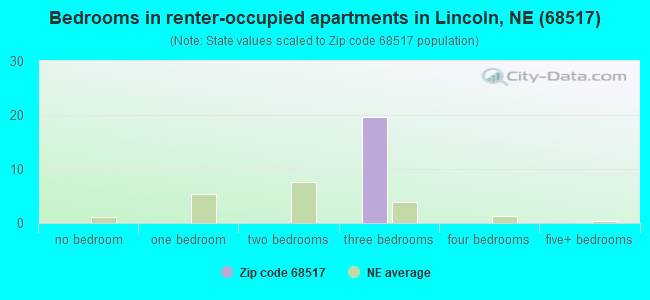
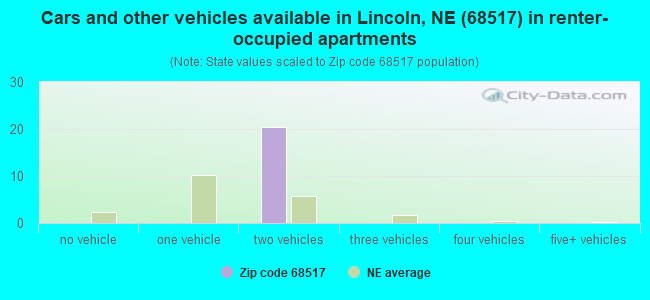
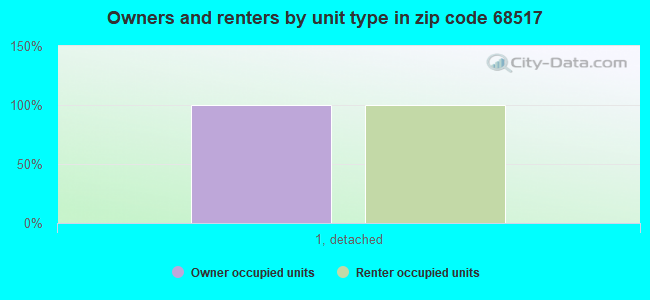
Houses and condos: 206 Renter-occupied apartments: 21
% of renters here:
10%
State:
34%
March 2022 cost of living index in zip code 68517: 75.2 (low, U.S. average is 100)
Land area: 26.8 sq. mi. Water area: 0.2 sq. mi.
Population density: 20 people per square mile
(very low).
OSM Map
General Map
Google Map
MSN Map
OSM Map
General Map
Google Map
MSN Map
OSM Map
General Map
Google Map
MSN Map
OSM Map
General Map
Google Map
MSN Map
Please wait while loading the map...
Real estate property taxes paid for housing units in 2022:
This zip code:
1.2% ($6,345)
Nebraska:
1.4% ($3,313)
Median real estate property taxes paid for housing units with mortgages in 2022: $6,549 (1.1%) Median real estate property taxes paid for housing units with no mortgage in 2022: $6,190 (1.3%)
Business Search- 14 Million verified businesses
Males: 293
(54.2%)
Females: 248
(45.8%)
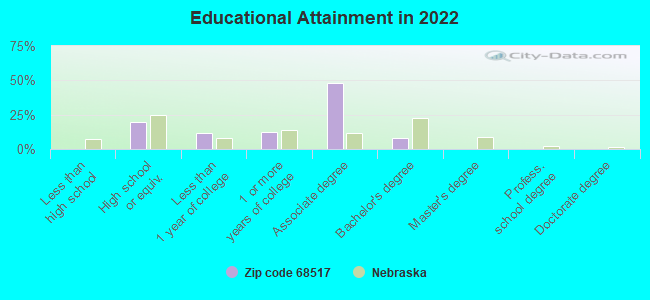
For population 25 years and over in 68517:
High school or higher: 102.4%
Bachelor's degree or higher: 8.6%
Graduate or professional degree: 0.0%
Mean travel time to work (commute): 26.4 minutes
For population 15 years and over in 68517:
Never married: 9.7%
Now married: 82.3%
Separated: 0.0%
Widowed: 4.3%
Divorced: 3.7%
Zip code 68517 compared to state average:
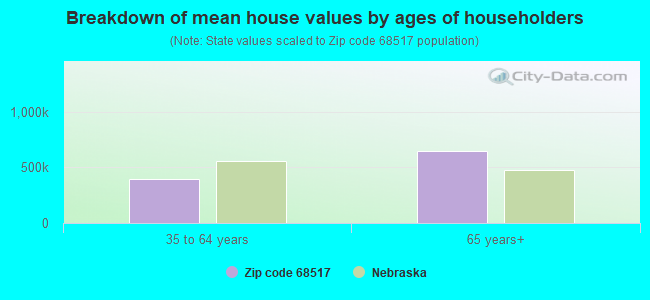
Median house value significantly above state average.
Unemployed percentage significantly below state average.
Black race population percentage significantly below state average.
Hispanic race population percentage significantly below state average.
Median age above state average.
Foreign-born population percentage significantly below state average.
Renting percentage significantly below state average.
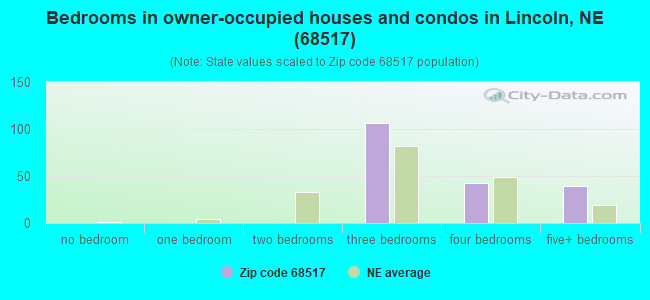
Number of rooms per house above state average.
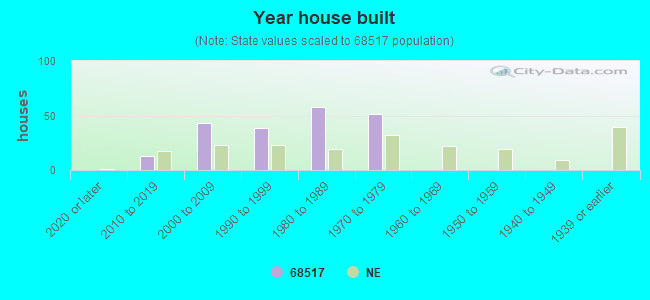
House age significantly below state average.
Number of college students significantly below state average.
Percentage of population with a bachelor's degree or higher significantly below state average.
Estimated median house/condo value in 2022: $527,195
68517:
$527,195
Nebraska:
$232,400
Median resident age:
This zip code:
44.8 years
Nebraska median age:
37.4 years
Average household size:
This zip code:
2.6 people
Nebraska:
2.4 people
Averages for the 2020 tax year for zip code 68517, filed in 2021:
Average Adjusted Gross Income (AGI) in 2020: $93,585 (Individual Income Tax Returns)
Here:
$93,585
State:
$73,874
Salary/wage: $73,738 (reported on 80.8% of returns)
Here:
$73,738
State:
$58,268
(% of AGI for various income ranges: 1014.0% for AGIs below $25k, 5800.0% for AGIs $25k-50k, 15468.0% for AGIs $100k-200k)
Taxable interest for individuals: $500 (reported on 50.0% of returns)
This zip code:
$500
Nebraska:
$1,748
(% of AGI for various income ranges: 18.0% for AGIs below $25k, 85.0% for AGIs $50k-75k, 78.0% for AGIs $100k-200k)
Ordinary dividends: $3,044 (reported on 34.6% of returns)
Here:
$3,044
State:
$7,841
(% of AGI for various income ranges: 243.3% for AGIs $25k-50k, 402.0% for AGIs $100k-200k)
Net capital gain/loss in AGI: +$4,288 (reported on 30.8% of returns)
Here:
+$4,288
State:
+$21,703
(% of AGI for various income ranges: 160.0% for AGIs $25k-50k, 590.0% for AGIs $100k-200k)
Profit/loss from business: +$13,775 (reported on 15.4% of returns)
Here:
+$13,775
State:
+$11,239
(% of AGI for various income ranges: 144.0% for AGIs below $25k, 958.0% for AGIs $100k-200k)
Taxable individual retirement arrangement distribution: $9,800 (reported on 7.7% of returns)
68517:
$9,800
Nebraska:
$18,251
(% of AGI for various income ranges: 653.3% for AGIs $25k-50k)
Percentage of individuals using paid preparers for their 2020 taxes: 96.2%
Here:
96%
State:
95%
(% for various income ranges: 85.7% for AGIs below $25k, 100.0% for AGIs $25k-50k, 100.0% for AGIs $50k-75k, 100.0% for AGIs $75k-100k, 100.0% for AGIs $100k-200k, 100.0% for AGIs over 200k)
Averages for the 2012 tax year for zip code 68517, filed in 2013:
Average Adjusted Gross Income (AGI) in 2012: $79,216 (Individual Income Tax Returns)
Here:
$79,216
State:
$60,572
Salary/wage: $61,864 (reported on 88.0% of returns)
Here:
$61,864
State:
$47,046
(% of AGI for various income ranges: 71.0% for AGIs below $25k, 75.2% for AGIs $25k-50k, 70.6% for AGIs $50k-75k, 79.2% for AGIs $75k-100k, 65.6% for AGIs $100k-200k)
Taxable interest for individuals: $415 (reported on 52.0% of returns)
This zip code:
$415
Nebraska:
$1,535
(% of AGI for various income ranges: 0.9% for AGIs below $25k, 1.2% for AGIs $25k-50k, 0.2% for AGIs $75k-100k, 0.2% for AGIs $100k-200k)
Ordinary dividends: $1,811 (reported on 36.0% of returns)
Here:
$1,811
State:
$5,776
Net capital gain/loss in AGI: +$2,971 (reported on 28.0% of returns)
Here:
+$2,971
State:
+$16,171
Profit/loss from business: +$7,275 (reported on 16.0% of returns)
Here:
+$7,275
State:
+$9,897
Taxable individual retirement arrangement distribution: $6,900 (reported on 12.0% of returns)
68517:
$6,900
Nebraska:
$12,804
Total itemized deductions: $23,615 (19% of AGI, reported on 52.0% of returns)
Here:
$23,615
State:
$23,343
Here:
19.3% of AGI
State:
18.7% of AGI
(% of AGI for various income ranges: 35.8% for AGIs $50k-75k, 16.4% for AGIs $75k-100k, 13.9% for AGIs $100k-200k)
Charity contributions: $3,464 (reported on 44.0% of returns)
Here:
$3,464
State:
$4,921
Taxes paid: $9,962 (reported on 52.0% of returns)
68517:
$9,962
State:
$9,758
(% of AGI for various income ranges: 10.4% for AGIs $50k-75k, 6.3% for AGIs $75k-100k, 6.9% for AGIs $100k-200k)
Percentage of individuals using paid preparers for their 2012 taxes: 64.0%
Here:
64%
State:
57%
(% for various income ranges: 75.0% for AGIs below $25k, 125.0% for AGIs $50k-75k, 71.4% for AGIs $100k-200k)
Averages for the 2004 tax year for zip code 68517, filed in 2005:
Average Adjusted Gross Income (AGI) in 2004: $53,344 (Individual Income Tax Returns)
Here:
$53,344
State:
$44,271
Salary/wage: $46,255 (reported on 85.1% of returns)
Here:
$46,255
State:
$38,230
(% of AGI for various income ranges: 131.4% for AGIs below $10k, 65.8% for AGIs $10k-25k, 76.6% for AGIs $25k-50k, 77.3% for AGIs $50k-75k, 85.7% for AGIs $75k-100k, 58.6% for AGIs over 100k)
Taxable interest for individuals: $518 (reported on 63.8% of returns)
This zip code:
$518
Nebraska:
$1,759
(% of AGI for various income ranges: 6.8% for AGIs below $10k, 1.0% for AGIs $10k-25k, 0.5% for AGIs $25k-50k, 0.8% for AGIs $50k-75k, 0.4% for AGIs $75k-100k, 0.5% for AGIs over 100k)
Taxable dividends: $1,073 (reported on 37.1% of returns)
Here:
$1,073
State:
$2,804
(% of AGI for various income ranges: 1.7% for AGIs below $10k, 0.1% for AGIs $25k-50k, 1.1% for AGIs $50k-75k, 0.2% for AGIs $75k-100k, 1.4% for AGIs over 100k)
Net capital gain/loss: +$1,305 (reported on 26.7% of returns)
Here:
+$1,305
State:
+$7,887
Profit/loss from business: +$1,925 (reported on 18.1% of returns)
Here:
+$1,925
State:
+$7,743
Total itemized deductions: $16,973 (22% of AGI, reported on 49.8% of returns)
Here:
$16,973
State:
$18,692
Here:
21.6% of AGI
State:
21.1% of AGI
(% of AGI for various income ranges: 24.0% for AGIs $25k-50k, 18.9% for AGIs $50k-75k, 14.7% for AGIs $75k-100k, 14.9% for AGIs over 100k)
Charity contributions deductions: $2,143 (3% of AGI, reported on 44.3% of returns)
Here:
$2,143
State:
$3,500
Here:
2.7% of AGI
State:
3.8% of AGI
(% of AGI for various income ranges: 2.4% for AGIs $25k-50k, 2.0% for AGIs $50k-75k, 1.5% for AGIs $75k-100k, 2.1% for AGIs over 100k)
Total tax: $6,726 (reported on 84.2% of returns)
68517:
$6,726
State:
$6,550
(% of AGI for various income ranges: 2.5% for AGIs below $10k, 6.8% for AGIs $10k-25k, 6.5% for AGIs $25k-50k, 9.6% for AGIs $50k-75k, 9.6% for AGIs $75k-100k, 15.2% for AGIs over 100k)
Percentage of individuals using paid preparers for their 2004 taxes: 65.2%
Here:
65%
State:
62%
(% for various income ranges: 58.8% for AGIs below $10k, 66.7% for AGIs $10k-25k, 65.1% for AGIs $25k-50k, 67.6% for AGIs $50k-75k, 66.7% for AGIs $75k-100k, 65.4% for AGIs over 100k)
Household received Food Stamps/SNAP in the past 12 months: 0 Household did not receive Food Stamps/SNAP in the past 12 months: 208
Women who did not have a birth in the past 12 months: 110 (81 now married, 28 unmarried)
Housing units in zip code 68517 with a mortgage: 118 (9 second mortgage, 10 both second mortgage and home equity loan) Median monthly owner costs for units with a mortgage: $3,219 Median monthly owner costs for units without a mortgage: $1,014
Median number of rooms in houses and condos:
Here:
8.1
State:
7.1
Notable locations in this zip code not listed on our city pages
Size of family households: 54 2-persons, 32 3-persons, 76 4-persons
Size of nonfamily households: 48 1-person
175 married couples with children.
0 single-parent households ().
100.4% of residents of 68517 zip code speak English at home.
Foreign born population: 0 (0.0%)
:
0.0%
Whole state:
7.2%
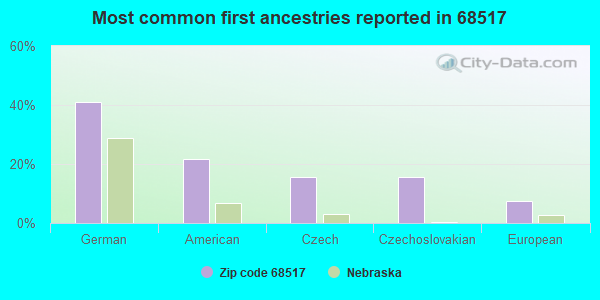
41%German
22%American
16%Czech
16%Czechoslovakian
7%European
Facilities with environmental interests located in this zip code:
BLUFF ROAD LANDFILL (6001 BLUFF RD in LINCOLN, NE)
AIR SYNTHETIC MINOR (AIRS/AFS) (Integrated Compliance Information System) - ICIS-07-2001-0205, FORMAL ENFORCEMENT ACTION, ICIS-07-2006-0074, ENFORCEMENT/COMPLIANCE ACTIVITY (Integrated Compliance Information System) - ICIS-07-2001-0205, FORMAL ENFORCEMENT ACTION, ICIS-07-2006-0074, ENFORCEMENT/COMPLIANCE ACTIVITY STATE MASTER (Nebraska tracking) - AIR PROGRAM, REFUSE DISPOSAL, HAZARDOUS WASTE PROGRAM Conditionally Exempt Small Quantity Generators, less than 100 kg/month of hazardous waste (Resource Conservation and Recovery Act (tracking hazardous waste)) - notification Business SIC classification: REFUSE SYSTEMS; NONCLASSIFIABLE ESTABLISHMENTS Organizations: CITY OF LINCOLN (CONTACT/OWNER)
Alternative names: CITY OF LINCOLN BLUFF ROAD LANDFILL, STEVE OWEN
CONSTRUCTORS INS (6500 NORTH 70TH STREET in LINCOLN, NE)
STATE MASTER (Nebraska tracking) - EPCRA STATE MASTER (Nebraska tracking) - National Pollutant Discharge Elimination System Permit CRITERIA AND HAZARDOUS AIR POLLUTANT INVENTORY (Inventory of air pollution sources) Small Quantity Generators, between 100 kg and 1000 kg of hazardous waste/month (Resource Conservation and Recovery Act (tracking hazardous waste)) - notification Business SIC classification: ASPHALT PAVING MIXTURES AND BLOCKS Business NAICS classification: ASPHALT PAVING MIXTURE AND BLOCK MANUFACTURING. Organizations: CONSTRUCTORS, INC (CONTACT/OWNER)
Alternative names: CONSTRUCTORS INC, CONSTRUCTORS INC SHOP
DORSEY LABORATORIES (10401 US HWY 6 in LINCOLN, NE)
COMPLIANCE ACTIVITY (Tracking inspections of insecticide, fungicide, and rodenticide, and toxic substances) Business SIC classification: PHARMACEUTICAL PREPARATIONS
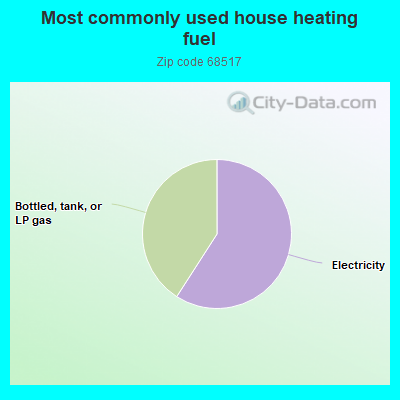
59.4%Electricity
41.1%Bottled, tank, or LP gas
Population in 1990: 485. Population change in the 1990s: +31 (+6.4%).
Place of birth for U.S.-born residents:
This state: 369
Midwest: 139
South: 17
West: 13
72% of the 68517 zip code residents lived in the same house 5 years ago. Out of people who lived in different houses, 78% lived in this county.
94% of the 68517 zip code residents lived in the same house 1 year ago. Out of people who lived in different houses, 100% moved from this county.
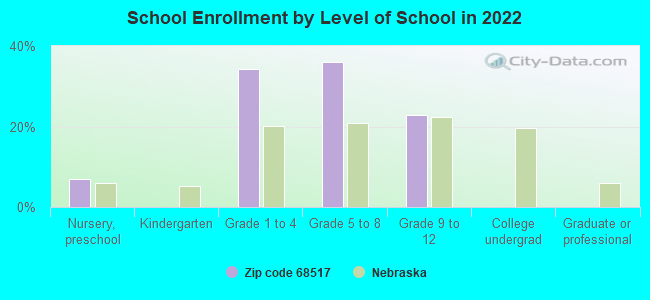
Private vs. public school enrollment:
Students in private schools in grades 1 to 8 (elementary and middle school):
Here:
0.0%
Nebraska:
14.1%
Students in private schools in grades 9 to 12 (high school):
Here:
0.0%
Nebraska:
12.5%
Companies with federal contracts located in this zip code:
TRAILER SALES, INC (5700 ARBOR ROAD in LINCOLN, NE; small business)
$4,490 with Army for Trailers. Signed on 2004-08-10. Completion date: 2004-09-30.
Top industries in this zip code by the number of employees in 2005:
Administrative and Support and Waste Management and Remediation Services: Temporary Help Services (50-99 employees: 1 establishment)
Professional, Scientific, and Technical Services: Environmental Consulting Services (20-49: 1)
Construction: Masonry Contractors (10-19: 1)
Arts, Entertainment, and Recreation: Fitness and Recreational Sports Centers (5-9: 1, 1-4: 1)
Construction: Residential Remodelers (1-4: 1)
Fatal accident statistics in 2014:
Fatal accident count: 1
Vehicles involved in fatal accidents: 2
Fatal accidents caused by drunken drivers: 0
Fatalities: 1
Persons involved in fatal accidents: 4
Pedestrians involved in fatal accidents: 0
Fatal accident statistics in 2012:
Fatal accident count: 1
Vehicles involved in fatal accidents: 2
Fatal accidents caused by drunken drivers: 2
Fatalities: 1
Persons involved in fatal accidents: 7
Pedestrians involved in fatal accidents: 0
Home Mortgage Disclosure Act Aggregated Statistics For Year 2009 (Based on 4 partial tracts)
A) FHA, FSA/RHS & VA Home Purchase Loans
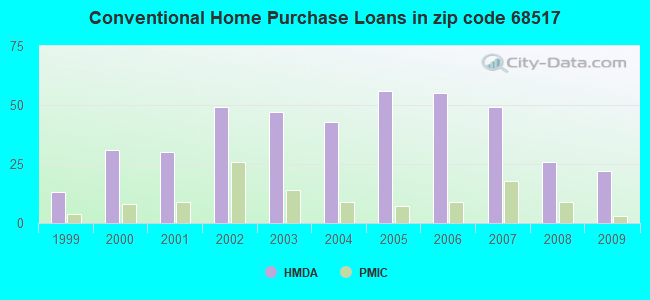
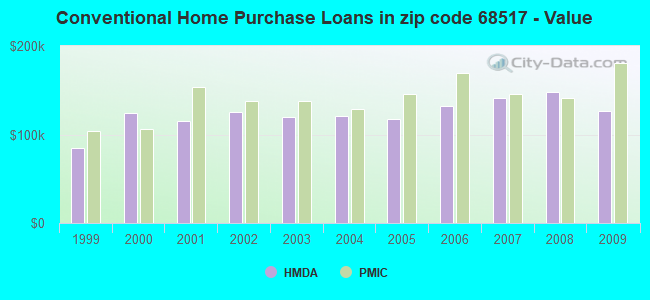
B) Conventional Home Purchase Loans
C) Refinancings
D) Home Improvement Loans
F) Non-occupant Loans on < 5 Family Dwellings (A B C & D)
G) Loans On Manufactured Home Dwelling (A B C & D)
Number
Average Value
Number
Average Value
Number
Average Value
Number
Average Value
Number
Average Value
Number
Average Value
LOANS ORIGINATED
17
$138,812
22
$126,123
120
$157,218
6
$30,623
5
$79,908
1
$10,210
APPLICATIONS APPROVED, NOT ACCEPTED
1
$156,100
1
$173,890
8
$146,044
1
$55,260
0
$0
0
$0
APPLICATIONS DENIED
1
$189,960
1
$28,090
17
$151,635
5
$28,272
1
$85,600
2
$34,670
APPLICATIONS WITHDRAWN
2
$122,550
4
$121,810
18
$165,650
0
$0
0
$0
1
$89,010
FILES CLOSED FOR INCOMPLETENESS
0
$0
0
$0
5
$176,474
0
$0
0
$0
0
$0
Aggregated Statistics For Year 2008 (Based on 4 partial tracts)
A) FHA, FSA/RHS & VA Home Purchase Loans
B) Conventional Home Purchase Loans
C) Refinancings
D) Home Improvement Loans
E) Loans on Dwellings For 5+ Families
F) Non-occupant Loans on < 5 Family Dwellings (A B C & D)
G) Loans On Manufactured Home Dwelling (A B C & D)
Number
Average Value
Number
Average Value
Number
Average Value
Number
Average Value
Number
Average Value
Number
Average Value
Number
Average Value
LOANS ORIGINATED
11
$166,328
26
$148,064
50
$158,360
7
$36,043
1
$436,960
6
$120,040
1
$94,160
APPLICATIONS APPROVED, NOT ACCEPTED
0
$0
2
$153,720
8
$183,611
3
$44,407
0
$0
0
$0
0
$0
APPLICATIONS DENIED
0
$0
3
$98,143
24
$159,914
6
$48,255
0
$0
0
$0
1
$45,010
APPLICATIONS WITHDRAWN
1
$202,640
2
$198,575
10
$165,671
2
$94,585
0
$0
0
$0
0
$0
FILES CLOSED FOR INCOMPLETENESS
0
$0
0
$0
1
$214,600
0
$0
0
$0
0
$0
0
$0
Aggregated Statistics For Year 2007 (Based on 4 partial tracts)
A) FHA, FSA/RHS & VA Home Purchase Loans
B) Conventional Home Purchase Loans
C) Refinancings
D) Home Improvement Loans
F) Non-occupant Loans on < 5 Family Dwellings (A B C & D)
G) Loans On Manufactured Home Dwelling (A B C & D)
Number
Average Value
Number
Average Value
Number
Average Value
Number
Average Value
Number
Average Value
Number
Average Value
LOANS ORIGINATED
5
$163,384
49
$141,441
42
$129,840
8
$33,916
7
$98,294
1
$16,920
APPLICATIONS APPROVED, NOT ACCEPTED
0
$0
4
$75,138
6
$158,045
2
$33,775
0
$0
1
$43,730
APPLICATIONS DENIED
0
$0
4
$134,755
25
$134,223
5
$43,232
1
$27,450
1
$68,700
APPLICATIONS WITHDRAWN
0
$0
6
$127,928
10
$160,683
2
$16,095
0
$0
0
$0
FILES CLOSED FOR INCOMPLETENESS
0
$0
0
$0
3
$129,687
0
$0
0
$0
0
$0
Aggregated Statistics For Year 2006 (Based on 4 partial tracts)
A) FHA, FSA/RHS & VA Home Purchase Loans
B) Conventional Home Purchase Loans
C) Refinancings
D) Home Improvement Loans
F) Non-occupant Loans on < 5 Family Dwellings (A B C & D)
G) Loans On Manufactured Home Dwelling (A B C & D)
Number
Average Value
Number
Average Value
Number
Average Value
Number
Average Value
Number
Average Value
Number
Average Value
LOANS ORIGINATED
5
$152,702
55
$131,700
53
$117,517
13
$36,541
7
$155,929
1
$73,840
APPLICATIONS APPROVED, NOT ACCEPTED
0
$0
2
$148,310
9
$143,258
2
$52,070
0
$0
1
$51,070
APPLICATIONS DENIED
1
$85,840
11
$93,926
27
$127,227
2
$31,525
3
$56,150
4
$40,220
APPLICATIONS WITHDRAWN
1
$160,420
6
$122,592
13
$126,820
1
$10,200
0
$0
0
$0
FILES CLOSED FOR INCOMPLETENESS
0
$0
1
$262,440
3
$139,090
1
$106,950
0
$0
0
$0
Aggregated Statistics For Year 2005 (Based on 4 partial tracts)
A) FHA, FSA/RHS & VA Home Purchase Loans
B) Conventional Home Purchase Loans
C) Refinancings
D) Home Improvement Loans
F) Non-occupant Loans on < 5 Family Dwellings (A B C & D)
G) Loans On Manufactured Home Dwelling (A B C & D)
Number
Average Value
Number
Average Value
Number
Average Value
Number
Average Value
Number
Average Value
Number
Average Value
LOANS ORIGINATED
5
$144,276
56
$117,470
68
$130,863
12
$30,271
6
$99,043
2
$38,725
APPLICATIONS APPROVED, NOT ACCEPTED
1
$106,240
2
$133,190
7
$122,949
1
$8,440
0
$0
1
$16,600
APPLICATIONS DENIED
1
$88,650
6
$96,220
41
$119,000
4
$25,948
1
$121,300
3
$20,640
APPLICATIONS WITHDRAWN
0
$0
5
$179,824
23
$122,706
2
$25,680
1
$67,900
0
$0
FILES CLOSED FOR INCOMPLETENESS
0
$0
0
$0
5
$128,258
1
$35,310
0
$0
0
$0
Aggregated Statistics For Year 2004 (Based on 4 partial tracts)
A) FHA, FSA/RHS & VA Home Purchase Loans
B) Conventional Home Purchase Loans
C) Refinancings
D) Home Improvement Loans
E) Loans on Dwellings For 5+ Families
F) Non-occupant Loans on < 5 Family Dwellings (A B C & D)
G) Loans On Manufactured Home Dwelling (A B C & D)
Number
Average Value
Number
Average Value
Number
Average Value
Number
Average Value
Number
Average Value
Number
Average Value
Number
Average Value
LOANS ORIGINATED
5
$131,098
43
$121,300
88
$130,460
11
$41,916
1
$347,930
6
$109,127
2
$53,420
APPLICATIONS APPROVED, NOT ACCEPTED
0
$0
4
$123,302
9
$142,946
0
$0
0
$0
1
$110,650
1
$26,170
APPLICATIONS DENIED
0
$0
4
$166,458
32
$112,810
4
$29,002
0
$0
1
$153,380
1
$38,620
APPLICATIONS WITHDRAWN
0
$0
3
$100,790
17
$131,448
1
$21,460
0
$0
0
$0
0
$0
FILES CLOSED FOR INCOMPLETENESS
0
$0
2
$79,930
8
$132,485
1
$181,530
0
$0
0
$0
0
$0
Aggregated Statistics For Year 2003 (Based on 4 partial tracts)
A) FHA, FSA/RHS & VA Home Purchase Loans
B) Conventional Home Purchase Loans
C) Refinancings
D) Home Improvement Loans
F) Non-occupant Loans on < 5 Family Dwellings (A B C & D)
Number
Average Value
Number
Average Value
Number
Average Value
Number
Average Value
Number
Average Value
LOANS ORIGINATED
8
$148,436
47
$119,944
184
$123,234
11
$19,019
9
$98,187
APPLICATIONS APPROVED, NOT ACCEPTED
0
$0
4
$114,825
10
$105,022
2
$24,055
0
$0
APPLICATIONS DENIED
1
$131,930
4
$203,158
39
$111,822
5
$14,484
1
$110,480
APPLICATIONS WITHDRAWN
1
$83,770
3
$115,857
21
$127,720
1
$17,860
1
$164,710
FILES CLOSED FOR INCOMPLETENESS
0
$0
0
$0
6
$110,958
0
$0
0
$0
Aggregated Statistics For Year 2002 (Based on 4 partial tracts)
A) FHA, FSA/RHS & VA Home Purchase Loans
B) Conventional Home Purchase Loans
C) Refinancings
D) Home Improvement Loans
F) Non-occupant Loans on < 5 Family Dwellings (A B C & D)
Number
Average Value
Number
Average Value
Number
Average Value
Number
Average Value
Number
Average Value
LOANS ORIGINATED
7
$127,160
49
$125,409
113
$122,302
8
$11,054
6
$71,245
APPLICATIONS APPROVED, NOT ACCEPTED
0
$0
5
$112,744
13
$119,582
0
$0
0
$0
APPLICATIONS DENIED
0
$0
9
$60,211
18
$95,692
2
$25,790
3
$84,020
APPLICATIONS WITHDRAWN
0
$0
3
$121,450
17
$112,073
0
$0
1
$59,570
FILES CLOSED FOR INCOMPLETENESS
0
$0
1
$134,060
3
$100,350
0
$0
0
$0
Aggregated Statistics For Year 2001 (Based on 4 partial tracts)
A) FHA, FSA/RHS & VA Home Purchase Loans
B) Conventional Home Purchase Loans
C) Refinancings
D) Home Improvement Loans
E) Loans on Dwellings For 5+ Families
F) Non-occupant Loans on < 5 Family Dwellings (A B C & D)
Number
Average Value
Number
Average Value
Number
Average Value
Number
Average Value
Number
Average Value
Number
Average Value
LOANS ORIGINATED
6
$104,893
30
$115,588
80
$104,183
13
$17,488
1
$1,825,820
10
$61,513
APPLICATIONS APPROVED, NOT ACCEPTED
0
$0
2
$128,655
8
$100,675
2
$29,905
0
$0
0
$0
APPLICATIONS DENIED
0
$0
9
$48,609
18
$90,101
3
$41,973
0
$0
0
$0
APPLICATIONS WITHDRAWN
0
$0
2
$67,430
14
$84,715
2
$26,140
0
$0
0
$0
FILES CLOSED FOR INCOMPLETENESS
0
$0
1
$80,630
5
$81,644
0
$0
0
$0
0
$0
Aggregated Statistics For Year 2000 (Based on 4 partial tracts)
A) FHA, FSA/RHS & VA Home Purchase Loans
B) Conventional Home Purchase Loans
C) Refinancings
D) Home Improvement Loans
E) Loans on Dwellings For 5+ Families
F) Non-occupant Loans on < 5 Family Dwellings (A B C & D)
Number
Average Value
Number
Average Value
Number
Average Value
Number
Average Value
Number
Average Value
Number
Average Value
LOANS ORIGINATED
5
$85,882
31
$124,560
26
$100,343
12
$8,992
1
$548,070
5
$102,114
APPLICATIONS APPROVED, NOT ACCEPTED
0
$0
5
$54,660
5
$58,096
1
$33,420
0
$0
0
$0
APPLICATIONS DENIED
1
$70,360
14
$44,454
10
$72,223
1
$56,200
0
$0
0
$0
APPLICATIONS WITHDRAWN
0
$0
2
$85,605
5
$70,106
0
$0
0
$0
0
$0
FILES CLOSED FOR INCOMPLETENESS
0
$0
0
$0
2
$95,160
0
$0
0
$0
0
$0
Aggregated Statistics For Year 1999 (Based on 2 partial tracts)
A) FHA, FSA/RHS & VA Home Purchase Loans
B) Conventional Home Purchase Loans
C) Refinancings
D) Home Improvement Loans
E) Loans on Dwellings For 5+ Families
F) Non-occupant Loans on < 5 Family Dwellings (A B C & D)


 Nearest zip codes: 68514, 68507, 68336, 68504, 68462, 68505.