Estimated zip code population in 2022: 1,872 Zip code population in 2010: 1,402 Zip code population in 2000: 1,163
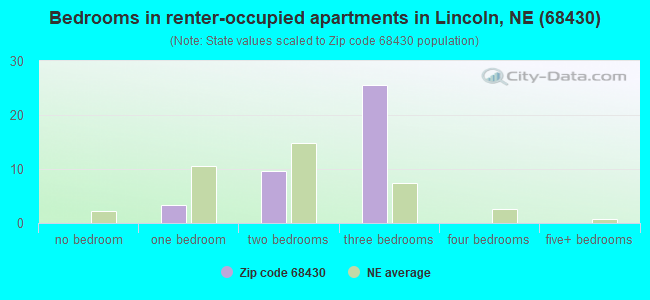
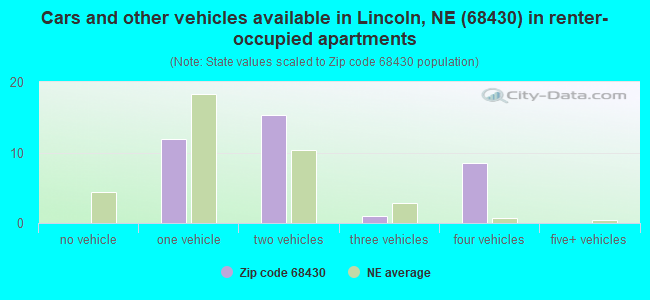
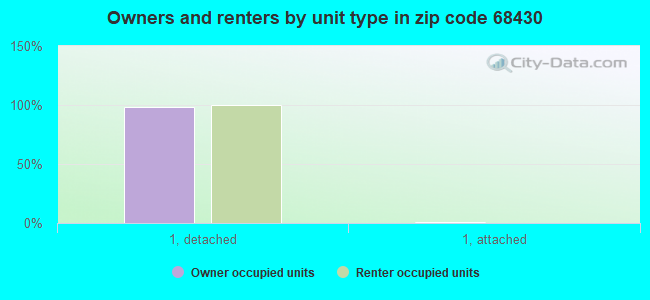
Houses and condos: 771 Renter-occupied apartments: 40
% of renters here:
5%
State:
34%
March 2022 cost of living index in zip code 68430: 77.1 (low, U.S. average is 100)
Land area: 44.1 sq. mi. Water area: 0.0 sq. mi.
Population density: 42 people per square mile
(very low).
OSM Map
General Map
Google Map
MSN Map
OSM Map
General Map
Google Map
MSN Map
OSM Map
General Map
Google Map
MSN Map
OSM Map
General Map
Google Map
MSN Map
Please wait while loading the map...
Real estate property taxes paid for housing units in 2022:
This zip code:
1.3% ($6,498)
Nebraska:
1.4% ($3,313)
Median real estate property taxes paid for housing units with mortgages in 2022: $6,102 (1.3%) Median real estate property taxes paid for housing units with no mortgage in 2022: $7,159 (1.4%)
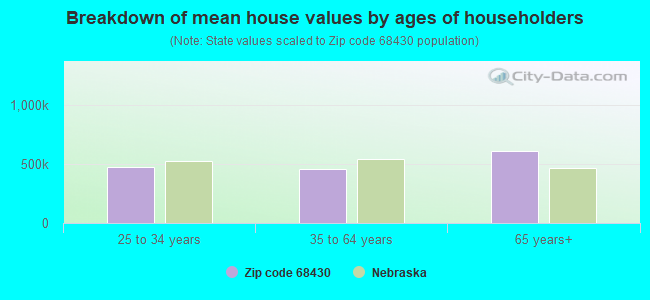
Estimated median house/condo value in 2022: $487,972
68430:
$487,972
Nebraska:
$232,400
According to our research of Nebraska and other state lists, there was 1 registered sex offender living in 68430 zip code as of June 05, 2024. The ratio of all residents to sex offenders in zip code 68430 is 1,591 to 1. The ratio of registered sex offenders to all residents in this zip code is much lower than the state average.
Median resident age:
This zip code:
54.8 years
Nebraska median age:
37.4 years
Average household size:
This zip code:
2.4 people
Nebraska:
2.4 people
Averages for the 2020 tax year for zip code 68430, filed in 2021:
Average Adjusted Gross Income (AGI) in 2020: $138,701 (Individual Income Tax Returns)
Here:
$138,701
State:
$73,874
Salary/wage: $98,216 (reported on 81.8% of returns)
Here:
$98,216
State:
$58,268
(% of AGI for various income ranges: 1372.1% for AGIs below $25k, 3555.0% for AGIs $25k-50k, 6402.9% for AGIs $50k-75k, 9156.7% for AGIs $75k-100k, 18764.3% for AGIs $100k-200k, 75666.0% for AGIs over 200k)
Taxable interest for individuals: $2,610 (reported on 51.5% of returns)
This zip code:
$2,610
Nebraska:
$1,748
(% of AGI for various income ranges: 29.3% for AGIs below $25k, 36.0% for AGIs $25k-50k, 72.9% for AGIs $50k-75k, 188.3% for AGIs $75k-100k, 280.7% for AGIs $100k-200k, 1394.0% for AGIs over 200k)
Ordinary dividends: $4,729 (reported on 38.4% of returns)
Here:
$4,729
State:
$7,841
(% of AGI for various income ranges: 37.1% for AGIs below $25k, 82.0% for AGIs $25k-50k, 138.6% for AGIs $50k-75k, 103.3% for AGIs $75k-100k, 262.9% for AGIs $100k-200k, 2272.0% for AGIs over 200k)
Net capital gain/loss in AGI: +$18,584 (reported on 38.4% of returns)
Here:
+$18,584
State:
+$21,703
(% of AGI for various income ranges: 42.1% for AGIs below $25k, 136.0% for AGIs $25k-50k, 297.1% for AGIs $50k-75k, 338.3% for AGIs $75k-100k, 921.4% for AGIs $100k-200k, 10332.0% for AGIs over 200k)
Profit/loss from business: +$8,082 (reported on 17.2% of returns)
Here:
+$8,082
State:
+$11,239
(% of AGI for various income ranges: 62.1% for AGIs below $25k, 82.0% for AGIs $25k-50k, 270.0% for AGIs $75k-100k, 327.1% for AGIs $100k-200k, 1170.0% for AGIs over 200k)
Taxable individual retirement arrangement distribution: $23,729 (reported on 14.1% of returns)
68430:
$23,729
Nebraska:
$18,251
(% of AGI for various income ranges: 527.0% for AGIs $25k-50k, 416.7% for AGIs $75k-100k, 748.6% for AGIs $100k-200k, 2994.0% for AGIs over 200k)
Total itemized deductions: $40,655 (reported on 20.2% of returns)
Here:
$40,655
State:
$37,704
(% of AGI for various income ranges: 1660.0% for AGIs $50k-75k, 1237.9% for AGIs $100k-200k, 10472.0% for AGIs over 200k)
Charity contributions: $19,494 (reported on 17.2% of returns)
Here:
$19,494
State:
$15,251
(% of AGI for various income ranges: 163.0% for AGIs $25k-50k, 253.6% for AGIs $100k-200k, 5592.0% for AGIs over 200k)
Taxes paid: $8,725 (reported on 20.2% of returns)
68430:
$8,725
State:
$8,015
(% of AGI for various income ranges: 390.0% for AGIs $50k-75k, 374.3% for AGIs $100k-200k, 1896.0% for AGIs over 200k)
Earned income credit: $2,000 (reported on 5.1% of returns)
Here:
$2,000
State:
$2,260
(% of AGI for various income ranges: 71.4% for AGIs below $25k)
Percentage of individuals using paid preparers for their 2020 taxes: 94.9%
Here:
95%
State:
95%
(% for various income ranges: 91.7% for AGIs below $25k, 92.3% for AGIs $25k-50k, 100.0% for AGIs $50k-75k, 100.0% for AGIs $75k-100k, 92.3% for AGIs $100k-200k, 100.0% for AGIs over 200k)
Averages for the 2012 tax year for zip code 68430, filed in 2013:
Average Adjusted Gross Income (AGI) in 2012: $88,097 (Individual Income Tax Returns)
Here:
$88,097
State:
$60,572
Salary/wage: $69,273 (reported on 84.6% of returns)
Here:
$69,273
State:
$47,046
(% of AGI for various income ranges: 77.5% for AGIs below $25k, 75.8% for AGIs $25k-50k, 79.0% for AGIs $50k-75k, 76.8% for AGIs $75k-100k, 72.3% for AGIs $100k-200k, 54.3% for AGIs over 200k)
Taxable interest for individuals: $1,721 (reported on 48.7% of returns)
This zip code:
$1,721
Nebraska:
$1,535
(% of AGI for various income ranges: 1.2% for AGIs below $25k, 1.2% for AGIs $25k-50k, 0.6% for AGIs $50k-75k, 0.3% for AGIs $75k-100k, 0.6% for AGIs $100k-200k, 1.4% for AGIs over 200k)
Ordinary dividends: $3,893 (reported on 34.6% of returns)
Here:
$3,893
State:
$5,776
(% of AGI for various income ranges: 2.8% for AGIs below $25k, 1.5% for AGIs $25k-50k, 0.7% for AGIs $50k-75k, 0.4% for AGIs $75k-100k, 0.8% for AGIs $100k-200k, 2.4% for AGIs over 200k)
Net capital gain/loss in AGI: +$13,929 (reported on 26.9% of returns)
Here:
+$13,929
State:
+$16,171
(% of AGI for various income ranges: 0.6% for AGIs $25k-50k, 1.2% for AGIs $50k-75k, 1.3% for AGIs $100k-200k, 9.1% for AGIs over 200k)
Profit/loss from business: +$10,156 (reported on 20.5% of returns)
Here:
+$10,156
State:
+$9,897
(% of AGI for various income ranges: 10.0% for AGIs below $25k, 5.8% for AGIs $25k-50k, 4.2% for AGIs $50k-75k, 4.6% for AGIs $100k-200k)
Taxable individual retirement arrangement distribution: $11,890 (reported on 12.8% of returns)
68430:
$11,890
Nebraska:
$12,804
(% of AGI for various income ranges: 5.1% for AGIs below $25k, 6.3% for AGIs $50k-75k, 3.3% for AGIs $100k-200k)
Total itemized deductions: $29,815 (18% of AGI, reported on 42.3% of returns)
Here:
$29,815
State:
$23,343
Here:
18.2% of AGI
State:
18.7% of AGI
(% of AGI for various income ranges: 18.3% for AGIs $25k-50k, 15.6% for AGIs $50k-75k, 14.8% for AGIs $75k-100k, 17.3% for AGIs $100k-200k, 12.6% for AGIs over 200k)
Charity contributions: $5,660 (reported on 38.5% of returns)
Here:
$5,660
State:
$4,921
(% of AGI for various income ranges: 2.3% for AGIs below $25k, 2.3% for AGIs $50k-75k, 2.0% for AGIs $75k-100k, 3.1% for AGIs $100k-200k, 2.6% for AGIs over 200k)
Taxes paid: $13,158 (reported on 42.3% of returns)
68430:
$13,158
State:
$9,758
(% of AGI for various income ranges: 4.4% for AGIs $25k-50k, 4.6% for AGIs $50k-75k, 5.7% for AGIs $75k-100k, 7.8% for AGIs $100k-200k, 6.8% for AGIs over 200k)
Earned income credit: $1,725 (reported on 5.1% of returns)
Here:
$1,725
State:
$2,188
(% of AGI for various income ranges: 2.8% for AGIs below $25k)
Percentage of individuals using paid preparers for their 2012 taxes: 60.3%
Here:
60%
State:
57%
(% for various income ranges: 50.0% for AGIs below $25k, 63.6% for AGIs $25k-50k, 58.3% for AGIs $50k-75k, 60.0% for AGIs $75k-100k, 64.3% for AGIs $100k-200k, 85.7% for AGIs over 200k)
Averages for the 2004 tax year for zip code 68430, filed in 2005:
Average Adjusted Gross Income (AGI) in 2004: $56,976 (Individual Income Tax Returns)
Here:
$56,976
State:
$44,271
Salary/wage: $47,580 (reported on 85.7% of returns)
Here:
$47,580
State:
$38,230
(% of AGI for various income ranges: 148.9% for AGIs below $10k, 63.4% for AGIs $10k-25k, 83.9% for AGIs $25k-50k, 89.8% for AGIs $50k-75k, 82.2% for AGIs $75k-100k, 55.7% for AGIs over 100k)
Taxable interest for individuals: $1,781 (reported on 61.9% of returns)
This zip code:
$1,781
Nebraska:
$1,759
(% of AGI for various income ranges: 7.4% for AGIs below $10k, 3.0% for AGIs $10k-25k, 1.1% for AGIs $25k-50k, 0.6% for AGIs $50k-75k, 1.3% for AGIs $75k-100k, 2.7% for AGIs over 100k)
Taxable dividends: $1,380 (reported on 36.5% of returns)
Here:
$1,380
State:
$2,804
(% of AGI for various income ranges: 6.3% for AGIs below $10k, 2.6% for AGIs $10k-25k, 1.0% for AGIs $25k-50k, 0.3% for AGIs $50k-75k, 0.6% for AGIs $75k-100k, 0.9% for AGIs over 100k)
Net capital gain/loss: +$13,525 (reported on 31.5% of returns)
Here:
+$13,525
State:
+$7,887
(% of AGI for various income ranges: -5.2% for AGIs below $10k, -0.2% for AGIs $10k-25k, 0.7% for AGIs $25k-50k, 0.5% for AGIs $50k-75k, 0.3% for AGIs $75k-100k, 16.4% for AGIs over 100k)
Profit/loss from business: +$9,522 (reported on 21.7% of returns)
Here:
+$9,522
State:
+$7,743
(% of AGI for various income ranges: 7.7% for AGIs below $10k, -1.3% for AGIs $10k-25k, 4.7% for AGIs $25k-50k, 4.4% for AGIs $50k-75k, -0.3% for AGIs $75k-100k, 5.2% for AGIs over 100k)
Profit/loss from farming: +$1,203 (reported on 10.2% of returns)
Here:
+$1,203
State:
-$1,077
(% of AGI for various income ranges: 1.6% for AGIs below $10k, 1.2% for AGIs $25k-50k, -0.5% for AGIs $50k-75k, 0.2% for AGIs over 100k)
IRA payment deduction: $3,560 (reported on 4.0% of returns)
68430:
$3,560
Nebraska:
$2,902
Total itemized deductions: $19,919 (22% of AGI, reported on 45.4% of returns)
Here:
$19,919
State:
$18,692
Here:
21.7% of AGI
State:
21.1% of AGI
(% of AGI for various income ranges: 18.7% for AGIs $10k-25k, 11.4% for AGIs $25k-50k, 18.8% for AGIs $50k-75k, 21.5% for AGIs $75k-100k, 13.9% for AGIs over 100k)
Charity contributions deductions: $3,561 (4% of AGI, reported on 41.7% of returns)
Here:
$3,561
State:
$3,500
Here:
3.8% of AGI
State:
3.8% of AGI
(% of AGI for various income ranges: 1.9% for AGIs $10k-25k, 1.6% for AGIs $25k-50k, 3.3% for AGIs $50k-75k, 3.2% for AGIs $75k-100k, 2.6% for AGIs over 100k)
Total tax: $8,084 (reported on 81.5% of returns)
68430:
$8,084
State:
$6,550
(% of AGI for various income ranges: 4.4% for AGIs below $10k, 4.8% for AGIs $10k-25k, 7.6% for AGIs $25k-50k, 7.9% for AGIs $50k-75k, 8.1% for AGIs $75k-100k, 16.6% for AGIs over 100k)
Earned income credit: $972 (reported on 5.7% of returns)
Here:
$972
State:
$1,643
Percentage of individuals using paid preparers for their 2004 taxes: 66.2%
Here:
66%
State:
62%
(% for various income ranges: 49.2% for AGIs below $10k, 68.6% for AGIs $10k-25k, 68.8% for AGIs $25k-50k, 75.0% for AGIs $50k-75k, 66.7% for AGIs $75k-100k, 75.0% for AGIs over 100k)
Household received Food Stamps/SNAP in the past 12 months: 1 Household did not receive Food Stamps/SNAP in the past 12 months: 773
Women who had a birth in the past 12 months: 1 (1 now married, 0 unmarried) Women who did not have a birth in the past 12 months: 323 (240 now married, 83 unmarried)
Housing units in zip code 68430 with a mortgage: 420 (7 second mortgage, 6 both second mortgage and home equity loan) Median monthly owner costs for units with a mortgage: $1,816 Median monthly owner costs for units without a mortgage: $1,048
Residents with income below the poverty level in 2022:
This zip code:
1.7%
Whole state:
11.2%
Residents with income below 50% of the poverty level in 2022:
This zip code:
1.2%
Whole state:
6.1%
Median number of rooms in houses and condos:
Here:
7.4
State:
7.1
Median number of rooms in apartments:
Here:
5.7
State:
4.2
Notable locations in this zip code not listed on our city pages
Notable locations in zip code 68430: Jamaica (A), Hanlon (B), Aldo Junction (C), Saltillo (D), Roca (E), Roca Elevator Company Elevator (F), Roca Volunteer Fire Department (G). Display/hide their locations on the map
Reservoirs: Herkimer Lake (A), Salt Creek Reservoir 9-A (B), Salt Creek Reservoir 9-3 (C), Salt Creek Reservoir 4-A (D), Upper Salt Creek Reservoir 36-1 (E), Block Reservoir (F). Display/hide their locations on the map
Size of family households: 374 2-persons, 78 3-persons, 82 4-persons, 47 5-persons, 7 6-persons
Size of nonfamily households: 114 1-person, 71 2-persons
296 married couples with children.
36 single-parent households (4 men, 32 women).
100.4% of residents of 68430 zip code speak English at home.
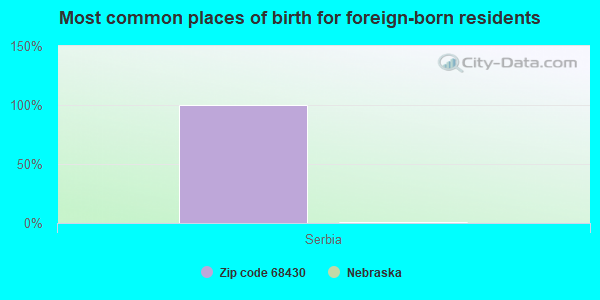
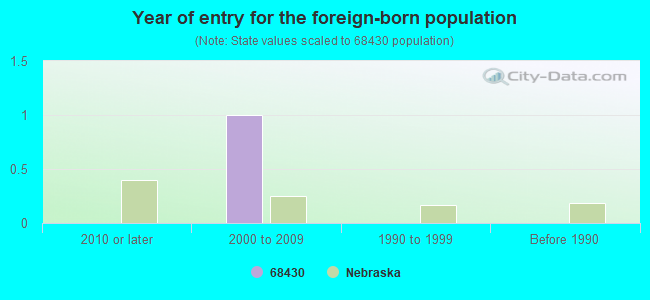
Foreign born population: 2 (0.1%) (100.0% of them are naturalized citizens)
This zip code:
0.1%
Whole state:
7.2%
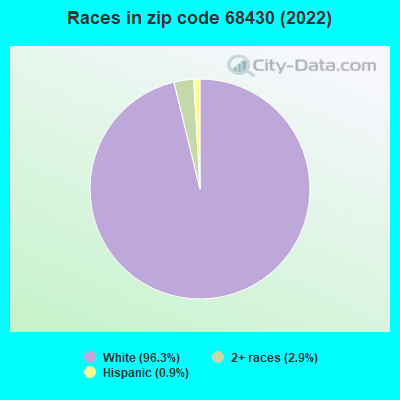
100%Serbia
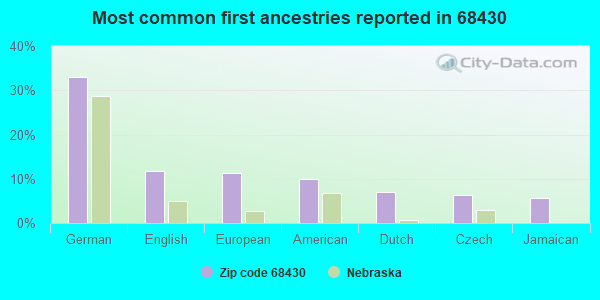
33%German
12%English
11%European
10%American
7%Dutch
6%Czech
6%Jamaican
Year of entry for the foreign-born population
02010 or later
12000 to 2009
01990 to 1999
0Before 1990
Facilities with environmental interests located in this zip code:
WILLIAMS PIPE LINE COMPANY (2000 SALTILLO ROAD in ROCA, NE)
AIR MAJOR (AIRS/AFS) STATE MASTER (Nebraska tracking) - AIR PROGRAM, LEGAL SERVICES, -06220-MAL-1200, LEAKING STORAGE TANK, -NE0123102, National Pollutant Discharge Elimination System Permit, -NER000553, -02268-BHI-0100, RELEASE ASSESSMENT, -02278-K---0216, -042792-KM-1640, -06028-M---1900, -NED000690313, HAZARDOUS WASTE PROGRAM, -0005500330, EPCRA CRITERIA AND HAZARDOUS AIR POLLUTANT INVENTORY (Inventory of air pollution sources) National Pollutant Discharge Elimination System NON-MAJOR (Tracking pollutant discharge elimination systems) - permit Conditionally Exempt Small Quantity Generators, less than 100 kg/month of hazardous waste (Resource Conservation and Recovery Act (tracking hazardous waste)) Business SIC classification: REFINED PETROLEUM PIPELINES; GRAIN AND FIELD BEANS; PETROLEUM BULK STATIONS AND TERMINALS Organizations: TOM DAUES, ENVIRONEMTNAL SPEC (CONTACT/OPERATOR)
, MAGELLAN PIPELINE COMPANY LLC (CONTACT/OPERATOR)
Alternative names: MAGELIAN PIPELINE CO. LLC, MAGELLAN PIPELINE LLC, WILLIAMS PIPELINE COMPANY - LINCOLN PARK, WILLIAMS PIPELINE/LINCOLN TERM
CONOCO PRODUCTS TERMINAL (1345 W SALTILLO ROAD in ROCA, NE)
AIR SYNTHETIC MINOR (AIRS/AFS) STATE MASTER (Nebraska tracking) - AIR PROGRAM, REFUSE DISPOSAL, EPCRA CRITERIA AND HAZARDOUS AIR POLLUTANT INVENTORY (Inventory of air pollution sources) Business SIC classification: PETROLEUM BULK STATIONS AND TERMINALS Alternative names: VIC HANNAN
DORCHESTER FARMER'S COOP ROCA BRANCH (MAIN ST in ROCA, NE)
AIR MINOR (AIRS/AFS) CRITERIA AND HAZARDOUS AIR POLLUTANT INVENTORY (Inventory of air pollution sources) Business SIC classification: GRAIN AND FIELD BEANS
MAGELLAN MIDSTREAM PARTNERS LP (11200 S 14TH in ROCA, NE)
(Resource Conservation and Recovery Act (tracking hazardous waste)) Alternative names: MAGELLAN MIDSREAM PARTNERS LP
VICRENE FARMS INC: TIM VOLKER-APPLICATOR (10301 FOCA ROAD BOX 126 in ROCA, NE)
COMPLIANCE ACTIVITY (Tracking inspections of insecticide, fungicide, and rodenticide, and toxic substances)
BEDIENT PIPE ORGAN COMPANY (1060 SALTILLO ROAD in ROCA, NE)
TRI REPORTER (Tracking of toxic chemicals releasing facilities) Business SIC classification: MUSICAL INSTRUMENTS Alternative names: BEDIENT PIPE ORGAN CO.
FARMERS COOPERATIVE - ROCA (15505 "A" STREET in ROCA, NE)
COMPLIANCE ACTIVITY (Tracking inspections of insecticide, fungicide, and rodenticide, and toxic substances) Alternative names: ROCA ELEVATOR CO INC
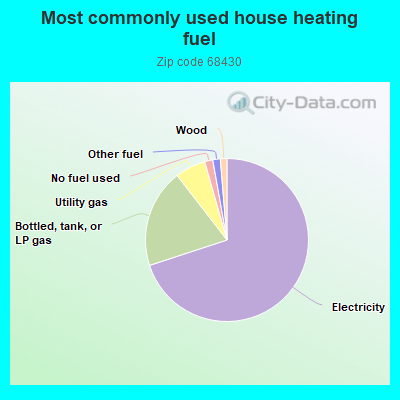
70.1%Electricity
19.6%Bottled, tank, or LP gas
6.1%Utility gas
1.6%No fuel used
1.5%Other fuel
1.3%Wood
Population in 1990: 517. Population change in the 1990s: +646 (+125.0%).
Place of birth for U.S.-born residents:
This state: 1,497
Northeast: 9
Midwest: 171
South: 104
West: 91
70% of the 68430 zip code residents lived in the same house 5 years ago. Out of people who lived in different houses, 72% lived in this county. Out of people who lived in different counties, 50% lived in Nebraska.
99% of the 68430 zip code residents lived in the same house 1 year ago. Out of people who lived in different houses, 182% moved from this county.
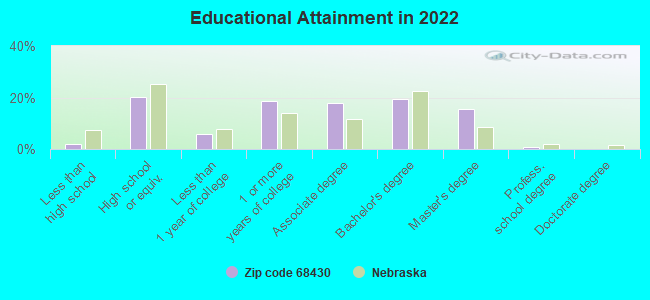
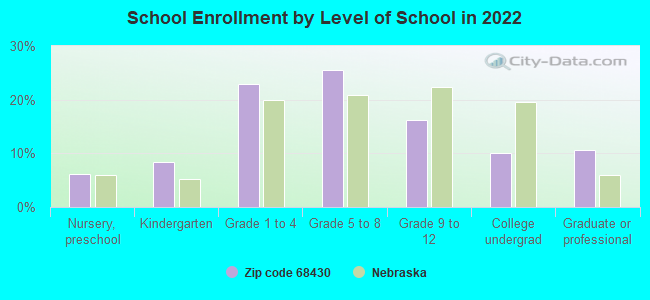
Private vs. public school enrollment:
Students in private schools in grades 1 to 8 (elementary and middle school): 32
Here:
19.0%
Nebraska:
14.1%
Students in private schools in grades 9 to 12 (high school): 17
Here:
29.8%
Nebraska:
12.5%
Students in private undergraduate colleges: 10
Here:
27.7%
Nebraska:
18.0%
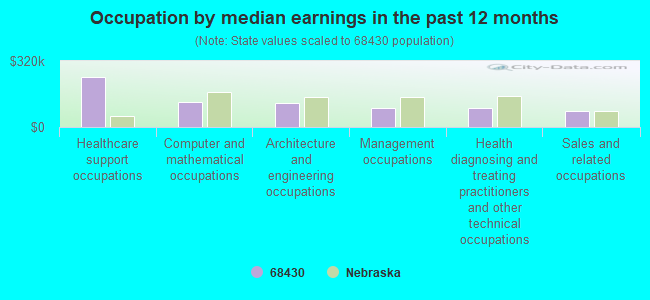
Occupation by median earnings in the past 12 months ($)
244,431Healthcare support occupations
119,387Computer and mathematical occupations
118,134Architecture and engineering occupations
92,100Management occupations
91,827Health diagnosing and treating practitioners and other technical occupations
76,799Sales and related occupations
Top industries in this zip code by the number of employees in 2005:
Health Care and Social Assistance: Child Day Care Services (10-19 employees: 1 establishment, 1-4 employees: 1 establishment)
Construction: Electrical Contractors (10-19: 1)
Construction: Masonry Contractors (10-19: 1)
Construction: New Single-Family Housing Construction (except Operative Builders) (5-9: 1, 1-4: 3)
Construction: Site Preparation Contractors (5-9: 1, 1-4: 2)
Fatal accident statistics in 2014:
Fatal accident count: 2
Vehicles involved in fatal accidents: 2
Fatal accidents caused by drunken drivers: 1
Fatalities: 2
Persons involved in fatal accidents: 2
Pedestrians involved in fatal accidents: 1
Fatal accident statistics in 2012:
Fatal accident count: 2
Vehicles involved in fatal accidents: 2
Fatal accidents caused by drunken drivers: 1
Fatalities: 2
Persons involved in fatal accidents: 3
Pedestrians involved in fatal accidents: 0
Home Mortgage Disclosure Act Aggregated Statistics For Year 2009 (Based on 2 partial tracts)
A) FHA, FSA/RHS & VA Home Purchase Loans
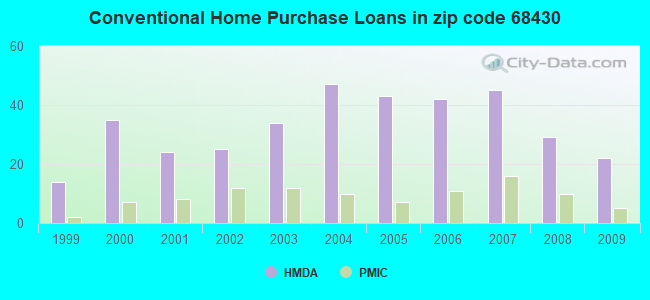
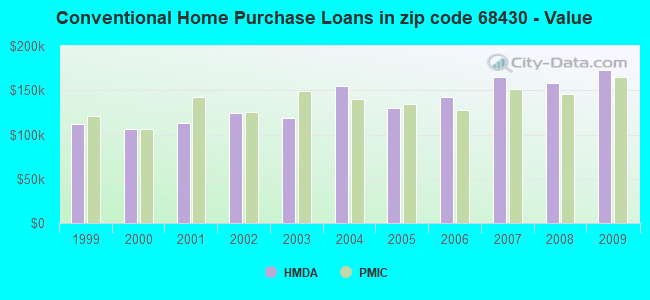
B) Conventional Home Purchase Loans
C) Refinancings
D) Home Improvement Loans
F) Non-occupant Loans on < 5 Family Dwellings (A B C & D)
G) Loans On Manufactured Home Dwelling (A B C & D)
Number
Average Value
Number
Average Value
Number
Average Value
Number
Average Value
Number
Average Value
Number
Average Value
LOANS ORIGINATED
16
$152,671
22
$172,907
143
$172,248
8
$47,770
6
$142,045
2
$104,195
APPLICATIONS APPROVED, NOT ACCEPTED
1
$180,840
1
$265,610
10
$143,081
1
$94,660
0
$0
0
$0
APPLICATIONS DENIED
5
$129,766
3
$179,427
22
$165,747
3
$39,440
1
$113,730
1
$121,150
APPLICATIONS WITHDRAWN
3
$103,487
3
$155,053
19
$153,735
0
$0
0
$0
0
$0
FILES CLOSED FOR INCOMPLETENESS
0
$0
1
$105,250
3
$149,050
0
$0
1
$76,640
0
$0
Aggregated Statistics For Year 2008 (Based on 2 partial tracts)
A) FHA, FSA/RHS & VA Home Purchase Loans
B) Conventional Home Purchase Loans
C) Refinancings
D) Home Improvement Loans
F) Non-occupant Loans on < 5 Family Dwellings (A B C & D)
G) Loans On Manufactured Home Dwelling (A B C & D)
Number
Average Value
Number
Average Value
Number
Average Value
Number
Average Value
Number
Average Value
Number
Average Value
LOANS ORIGINATED
12
$136,865
29
$158,124
68
$168,871
9
$71,621
7
$101,873
1
$174,830
APPLICATIONS APPROVED, NOT ACCEPTED
1
$157,170
4
$143,930
5
$135,416
1
$56,160
1
$50,510
0
$0
APPLICATIONS DENIED
0
$0
2
$214,570
19
$152,805
3
$30,963
2
$119,735
0
$0
APPLICATIONS WITHDRAWN
1
$145,170
2
$158,585
10
$162,083
1
$37,790
0
$0
0
$0
FILES CLOSED FOR INCOMPLETENESS
0
$0
0
$0
2
$189,845
0
$0
0
$0
0
$0
Aggregated Statistics For Year 2007 (Based on 2 partial tracts)
A) FHA, FSA/RHS & VA Home Purchase Loans
B) Conventional Home Purchase Loans
C) Refinancings
D) Home Improvement Loans
F) Non-occupant Loans on < 5 Family Dwellings (A B C & D)
G) Loans On Manufactured Home Dwelling (A B C & D)
Number
Average Value
Number
Average Value
Number
Average Value
Number
Average Value
Number
Average Value
Number
Average Value
LOANS ORIGINATED
3
$171,890
45
$164,787
66
$140,440
13
$33,554
6
$200,088
1
$127,150
APPLICATIONS APPROVED, NOT ACCEPTED
0
$0
5
$137,748
4
$123,798
2
$48,390
0
$0
0
$0
APPLICATIONS DENIED
1
$97,840
4
$96,600
32
$125,894
5
$74,314
1
$149,050
2
$64,990
APPLICATIONS WITHDRAWN
0
$0
5
$123,478
14
$157,451
0
$0
0
$0
0
$0
FILES CLOSED FOR INCOMPLETENESS
0
$0
0
$0
4
$136,865
0
$0
0
$0
0
$0
Aggregated Statistics For Year 2006 (Based on 2 partial tracts)
A) FHA, FSA/RHS & VA Home Purchase Loans
B) Conventional Home Purchase Loans
C) Refinancings
D) Home Improvement Loans
F) Non-occupant Loans on < 5 Family Dwellings (A B C & D)
G) Loans On Manufactured Home Dwelling (A B C & D)
Number
Average Value
Number
Average Value
Number
Average Value
Number
Average Value
Number
Average Value
Number
Average Value
LOANS ORIGINATED
5
$140,786
42
$142,020
70
$124,770
11
$26,618
10
$92,079
2
$52,805
APPLICATIONS APPROVED, NOT ACCEPTED
0
$0
5
$136,830
8
$159,205
2
$23,310
0
$0
0
$0
APPLICATIONS DENIED
2
$87,945
5
$129,696
20
$123,338
5
$67,814
0
$0
2
$76,290
APPLICATIONS WITHDRAWN
0
$0
5
$156,680
14
$135,730
1
$131,740
0
$0
0
$0
FILES CLOSED FOR INCOMPLETENESS
0
$0
1
$183,660
3
$134,803
0
$0
0
$0
0
$0
Aggregated Statistics For Year 2005 (Based on 2 partial tracts)
A) FHA, FSA/RHS & VA Home Purchase Loans
B) Conventional Home Purchase Loans
C) Refinancings
D) Home Improvement Loans
F) Non-occupant Loans on < 5 Family Dwellings (A B C & D)
G) Loans On Manufactured Home Dwelling (A B C & D)
Number
Average Value
Number
Average Value
Number
Average Value
Number
Average Value
Number
Average Value
Number
Average Value
LOANS ORIGINATED
3
$130,803
43
$129,600
89
$138,875
9
$23,154
9
$99,013
1
$64,280
APPLICATIONS APPROVED, NOT ACCEPTED
0
$0
2
$117,615
12
$135,776
1
$8,830
0
$0
1
$109,490
APPLICATIONS DENIED
0
$0
7
$109,441
28
$152,658
6
$41,913
1
$39,910
1
$87,240
APPLICATIONS WITHDRAWN
0
$0
5
$132,450
23
$123,052
2
$41,325
1
$90,070
0
$0
FILES CLOSED FOR INCOMPLETENESS
0
$0
1
$87,590
5
$129,624
1
$79,470
0
$0
0
$0
Aggregated Statistics For Year 2004 (Based on 2 partial tracts)
A) FHA, FSA/RHS & VA Home Purchase Loans
B) Conventional Home Purchase Loans
C) Refinancings
D) Home Improvement Loans
F) Non-occupant Loans on < 5 Family Dwellings (A B C & D)
G) Loans On Manufactured Home Dwelling (A B C & D)
Number
Average Value
Number
Average Value
Number
Average Value
Number
Average Value
Number
Average Value
Number
Average Value
LOANS ORIGINATED
6
$99,367
47
$155,167
100
$131,458
12
$50,743
10
$109,598
1
$84,060
APPLICATIONS APPROVED, NOT ACCEPTED
1
$81,590
4
$124,680
14
$135,251
2
$34,085
0
$0
1
$93,600
APPLICATIONS DENIED
1
$124,330
5
$105,678
27
$122,665
4
$51,302
1
$126,090
0
$0
APPLICATIONS WITHDRAWN
0
$0
1
$124,680
16
$129,757
2
$59,340
0
$0
1
$83,360
FILES CLOSED FOR INCOMPLETENESS
0
$0
0
$0
8
$127,372
0
$0
0
$0
0
$0
Aggregated Statistics For Year 2003 (Based on 2 partial tracts)
A) FHA, FSA/RHS & VA Home Purchase Loans
B) Conventional Home Purchase Loans
C) Refinancings
D) Home Improvement Loans
F) Non-occupant Loans on < 5 Family Dwellings (A B C & D)
Number
Average Value
Number
Average Value
Number
Average Value
Number
Average Value
Number
Average Value
LOANS ORIGINATED
7
$94,456
34
$118,374
201
$127,985
12
$22,958
10
$54,605
APPLICATIONS APPROVED, NOT ACCEPTED
0
$0
2
$102,605
14
$107,474
1
$19,430
0
$0
APPLICATIONS DENIED
0
$0
5
$86,746
43
$116,679
1
$38,850
0
$0
APPLICATIONS WITHDRAWN
0
$0
2
$157,350
20
$122,472
0
$0
0
$0
FILES CLOSED FOR INCOMPLETENESS
0
$0
0
$0
2
$180,840
0
$0
0
$0
Aggregated Statistics For Year 2002 (Based on 2 partial tracts)
A) FHA, FSA/RHS & VA Home Purchase Loans
B) Conventional Home Purchase Loans
C) Refinancings
D) Home Improvement Loans
F) Non-occupant Loans on < 5 Family Dwellings (A B C & D)
Number
Average Value
Number
Average Value
Number
Average Value
Number
Average Value
Number
Average Value
LOANS ORIGINATED
8
$88,521
25
$124,651
137
$133,497
9
$22,919
7
$62,264
APPLICATIONS APPROVED, NOT ACCEPTED
0
$0
1
$97,840
11
$136,239
1
$45,210
1
$15,540
APPLICATIONS DENIED
0
$0
2
$83,180
27
$103,959
4
$20,132
1
$40,970
APPLICATIONS WITHDRAWN
0
$0
2
$147,815
26
$119,721
1
$9,540
1
$35,320
FILES CLOSED FOR INCOMPLETENESS
0
$0
0
$0
5
$122,702
0
$0
0
$0
Aggregated Statistics For Year 2001 (Based on 2 partial tracts)
A) FHA, FSA/RHS & VA Home Purchase Loans
B) Conventional Home Purchase Loans
C) Refinancings
D) Home Improvement Loans
F) Non-occupant Loans on < 5 Family Dwellings (A B C & D)
Number
Average Value
Number
Average Value
Number
Average Value
Number
Average Value
Number
Average Value
LOANS ORIGINATED
5
$95,930
24
$113,348
111
$115,996
14
$18,013
6
$78,882
APPLICATIONS APPROVED, NOT ACCEPTED
0
$0
0
$0
6
$104,017
2
$19,425
0
$0
APPLICATIONS DENIED
0
$0
6
$76,350
23
$96,500
5
$21,828
1
$27,200
APPLICATIONS WITHDRAWN
0
$0
2
$155,230
14
$101,116
1
$7,770
0
$0
FILES CLOSED FOR INCOMPLETENESS
0
$0
0
$0
6
$81,707
0
$0
0
$0
Aggregated Statistics For Year 2000 (Based on 2 partial tracts)
A) FHA, FSA/RHS & VA Home Purchase Loans
B) Conventional Home Purchase Loans
C) Refinancings
D) Home Improvement Loans
F) Non-occupant Loans on < 5 Family Dwellings (A B C & D)
Number
Average Value
Number
Average Value
Number
Average Value
Number
Average Value
Number
Average Value
LOANS ORIGINATED
7
$96,777
35
$105,819
42
$83,700
16
$22,738
7
$73,163
APPLICATIONS APPROVED, NOT ACCEPTED
0
$0
0
$0
8
$107,814
2
$46,620
0
$0
APPLICATIONS DENIED
0
$0
2
$112,140
23
$97,453
6
$16,777
1
$60,750
APPLICATIONS WITHDRAWN
0
$0
3
$160,237
11
$64,250
1
$55,450
0
$0
FILES CLOSED FOR INCOMPLETENESS
0
$0
0
$0
6
$84,945
0
$0
0
$0
Aggregated Statistics For Year 1999 (Based on 1 partial tract)
A) FHA, FSA/RHS & VA Home Purchase Loans
B) Conventional Home Purchase Loans
C) Refinancings
D) Home Improvement Loans
F) Non-occupant Loans on < 5 Family Dwellings (A B C & D)


+$1,203
-$1,077
(% of AGI for various income ranges: 1.6% for AGIs below $10k, 1.2% for AGIs $25k-50k, -0.5% for AGIs $50k-75k, 0.2% for AGIs over 100k) Nearest zip codes: 68516, 68512, 68372, 68438, 68526, 68404.