Estimated zip code population in 2022: 28,501 Zip code population in 2010: 26,751 Zip code population in 2000: 25,930
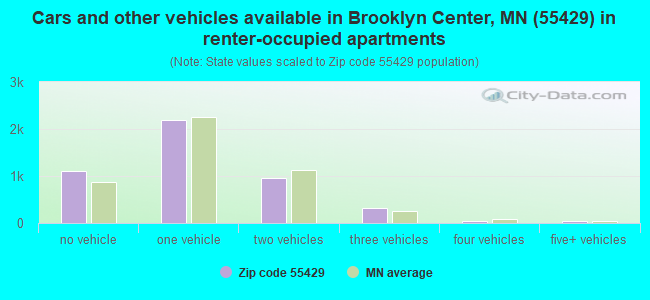
Houses and condos: 10,758 Renter-occupied apartments: 4,632
% of renters here:
44%
State:
28%
March 2022 cost of living index in zip code 55429: 113.9 (more than average, U.S. average is 100)
Land area: 6.2 sq. mi. Water area: 0.3 sq. mi.
Population density: 4,589 people per square mile
(average).
OSM Map
General Map
Google Map
MSN Map
OSM Map
General Map
Google Map
MSN Map
OSM Map
General Map
Google Map
MSN Map
OSM Map
General Map
Google Map
MSN Map
Please wait while loading the map...
Real estate property taxes paid for housing units in 2022:
This zip code:
1.2% ($3,165)
Minnesota:
1.0% ($3,087)
Median real estate property taxes paid for housing units with mortgages in 2022: $3,112 (1.1%) Median real estate property taxes paid for housing units with no mortgage in 2022: $3,240 (1.3%)
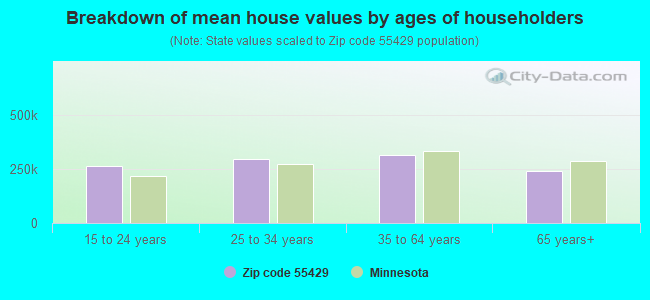
Estimated median house/condo value in 2022: $268,200
55429:
$268,200
Minnesota:
$314,600
According to our research of Minnesota and other state lists, there were 2 registered sex offenders living in 55429 zip code as of June 05, 2024. The ratio of all residents to sex offenders in zip code 55429 is 13,965 to 1. The ratio of registered sex offenders to all residents in this zip code is lower than the state average.
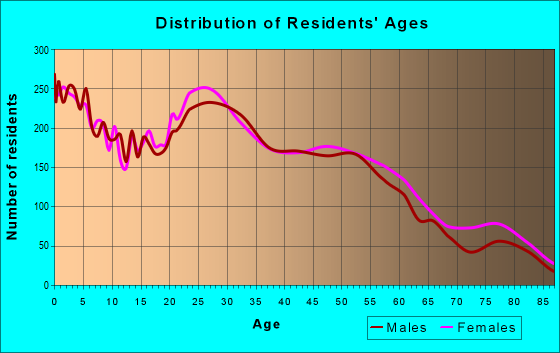
Median resident age:
This zip code:
33.1 years
Minnesota median age:
39.0 years
Average household size:
This zip code:
2.7 people
Minnesota:
2.4 people
Averages for the 2020 tax year for zip code 55429, filed in 2021:
Average Adjusted Gross Income (AGI) in 2020: $45,548 (Individual Income Tax Returns)
Here:
$45,548
State:
$82,178
Salary/wage: $42,258 (reported on 88.2% of returns)
Here:
$42,258
State:
$67,438
(% of AGI for various income ranges: 1229.4% for AGIs below $25k, 3988.2% for AGIs $25k-50k, 7238.8% for AGIs $50k-75k, 10789.0% for AGIs $75k-100k, 18336.1% for AGIs $100k-200k, 46810.0% for AGIs over 200k)
Taxable interest for individuals: $606 (reported on 15.0% of returns)
This zip code:
$606
Minnesota:
$1,814
(% of AGI for various income ranges: 5.1% for AGIs below $25k, 6.2% for AGIs $25k-50k, 13.6% for AGIs $50k-75k, 20.3% for AGIs $75k-100k, 69.6% for AGIs $100k-200k, 270.0% for AGIs over 200k)
Ordinary dividends: $2,458 (reported on 9.7% of returns)
Here:
$2,458
State:
$6,928
(% of AGI for various income ranges: 14.4% for AGIs below $25k, 12.2% for AGIs $25k-50k, 32.1% for AGIs $50k-75k, 81.2% for AGIs $75k-100k, 159.6% for AGIs $100k-200k, 1173.3% for AGIs over 200k)
Net capital gain/loss in AGI: +$4,151 (reported on 8.5% of returns)
Here:
+$4,151
State:
+$20,591
(% of AGI for various income ranges: 3.5% for AGIs below $25k, 9.8% for AGIs $25k-50k, 26.3% for AGIs $50k-75k, 91.8% for AGIs $75k-100k, 346.5% for AGIs $100k-200k, 4613.3% for AGIs over 200k)
Profit/loss from business: +$6,951 (reported on 12.3% of returns)
Here:
+$6,951
State:
+$14,342
(% of AGI for various income ranges: 84.5% for AGIs below $25k, 66.5% for AGIs $25k-50k, 132.7% for AGIs $50k-75k, 210.0% for AGIs $75k-100k, 302.1% for AGIs $100k-200k, 3440.0% for AGIs over 200k)
Taxable individual retirement arrangement distribution: $14,540 (reported on 5.7% of returns)
55429:
$14,540
Minnesota:
$20,675
(% of AGI for various income ranges: 45.1% for AGIs below $25k, 51.5% for AGIs $25k-50k, 93.0% for AGIs $50k-75k, 326.8% for AGIs $75k-100k, 722.1% for AGIs $100k-200k)
Total itemized deductions: $24,329 (reported on 5.4% of returns)
Here:
$24,329
State:
$33,311
(% of AGI for various income ranges: 23.5% for AGIs below $25k, 77.9% for AGIs $25k-50k, 275.4% for AGIs $50k-75k, 507.4% for AGIs $75k-100k, 800.2% for AGIs $100k-200k, 4786.7% for AGIs over 200k)
Charity contributions: $6,269 (reported on 3.6% of returns)
Here:
$6,269
State:
$11,879
(% of AGI for various income ranges: 2.4% for AGIs below $25k, 10.9% for AGIs $25k-50k, 38.6% for AGIs $50k-75k, 79.9% for AGIs $75k-100k, 185.3% for AGIs $100k-200k, 1080.0% for AGIs over 200k)
Taxes paid: $6,712 (reported on 5.4% of returns)
55429:
$6,712
State:
$8,252
(% of AGI for various income ranges: 3.7% for AGIs below $25k, 15.9% for AGIs $25k-50k, 84.0% for AGIs $50k-75k, 168.8% for AGIs $75k-100k, 236.0% for AGIs $100k-200k, 886.7% for AGIs over 200k)
Earned income credit: $2,203 (reported on 20.8% of returns)
Here:
$2,203
State:
$2,055
(% of AGI for various income ranges: 103.3% for AGIs below $25k, 77.5% for AGIs $25k-50k, 1.0% for AGIs $50k-75k)
Percentage of individuals using paid preparers for their 2020 taxes: 93.5%
Here:
93%
State:
94%
(% for various income ranges: 92.3% for AGIs below $25k, 94.0% for AGIs $25k-50k, 94.3% for AGIs $50k-75k, 93.8% for AGIs $75k-100k, 94.1% for AGIs $100k-200k, 88.9% for AGIs over 200k)
Averages for the 2012 tax year for zip code 55429, filed in 2013:
Average Adjusted Gross Income (AGI) in 2012: $37,104 (Individual Income Tax Returns)
Here:
$37,104
State:
$67,192
Salary/wage: $34,915 (reported on 88.2% of returns)
Here:
$34,915
State:
$55,182
(% of AGI for various income ranges: 82.3% for AGIs below $25k, 88.4% for AGIs $25k-50k, 82.4% for AGIs $50k-75k, 81.9% for AGIs $75k-100k, 80.8% for AGIs $100k-200k, 45.3% for AGIs over 200k)
Taxable interest for individuals: $805 (reported on 20.4% of returns)
This zip code:
$805
Minnesota:
$1,664
(% of AGI for various income ranges: 0.5% for AGIs below $25k, 0.2% for AGIs $25k-50k, 0.5% for AGIs $50k-75k, 0.3% for AGIs $75k-100k, 0.9% for AGIs $100k-200k, 0.3% for AGIs over 200k)
Ordinary dividends: $2,139 (reported on 11.4% of returns)
Here:
$2,139
State:
$5,665
(% of AGI for various income ranges: 0.6% for AGIs below $25k, 0.4% for AGIs $25k-50k, 0.7% for AGIs $50k-75k, 0.8% for AGIs $75k-100k, 1.1% for AGIs $100k-200k, 1.2% for AGIs over 200k)
Net capital gain/loss in AGI: +$6,014 (reported on 7.0% of returns)
Here:
+$6,014
State:
+$16,131
(% of AGI for various income ranges: 0.1% for AGIs $25k-50k, 0.3% for AGIs $50k-75k, 0.3% for AGIs $75k-100k, 1.8% for AGIs $100k-200k, 31.4% for AGIs over 200k)
Profit/loss from business: +$6,423 (reported on 11.6% of returns)
Here:
+$6,423
State:
+$12,430
(% of AGI for various income ranges: 5.1% for AGIs below $25k, 1.0% for AGIs $25k-50k, 1.7% for AGIs $50k-75k, 1.6% for AGIs $75k-100k, 2.0% for AGIs $100k-200k)
Taxable individual retirement arrangement distribution: $10,840 (reported on 7.6% of returns)
55429:
$10,840
Minnesota:
$15,212
(% of AGI for various income ranges: 2.5% for AGIs below $25k, 1.6% for AGIs $25k-50k, 2.2% for AGIs $50k-75k, 2.3% for AGIs $75k-100k, 3.3% for AGIs $100k-200k)
Self-employment retirement plans: $10,900 (reported on 0.2% of returns)
55429:
$10,900
Minnesota:
$17,874
Total itemized deductions: $15,861 (24% of AGI, reported on 26.1% of returns)
Here:
$15,861
State:
$24,665
Here:
23.8% of AGI
State:
19.6% of AGI
(% of AGI for various income ranges: 5.6% for AGIs below $25k, 8.7% for AGIs $25k-50k, 13.5% for AGIs $50k-75k, 14.5% for AGIs $75k-100k, 14.7% for AGIs $100k-200k, 14.3% for AGIs over 200k)
Charity contributions: $2,437 (reported on 20.5% of returns)
Here:
$2,437
State:
$3,948
(% of AGI for various income ranges: 0.6% for AGIs below $25k, 0.9% for AGIs $25k-50k, 1.7% for AGIs $50k-75k, 1.9% for AGIs $75k-100k, 2.0% for AGIs $100k-200k, 1.4% for AGIs over 200k)
Taxes paid: $5,558 (reported on 26.1% of returns)
55429:
$5,558
State:
$10,589
(% of AGI for various income ranges: 1.2% for AGIs below $25k, 2.4% for AGIs $25k-50k, 4.5% for AGIs $50k-75k, 5.5% for AGIs $75k-100k, 6.7% for AGIs $100k-200k, 6.3% for AGIs over 200k)
Earned income credit: $2,356 (reported on 27.6% of returns)
Here:
$2,356
State:
$2,037
(% of AGI for various income ranges: 8.4% for AGIs below $25k, 1.4% for AGIs $25k-50k)
Percentage of individuals using paid preparers for their 2012 taxes: 51.7%
Here:
52%
State:
55%
(% for various income ranges: 49.5% for AGIs below $25k, 52.5% for AGIs $25k-50k, 55.4% for AGIs $50k-75k, 54.0% for AGIs $75k-100k, 50.8% for AGIs $100k-200k, 100.0% for AGIs over 200k)
Averages for the 2004 tax year for zip code 55429, filed in 2005:
Average Adjusted Gross Income (AGI) in 2004: $35,660 (Individual Income Tax Returns)
Here:
$35,660
State:
$53,560
Salary/wage: $33,338 (reported on 88.7% of returns)
Here:
$33,338
State:
$46,177
(% of AGI for various income ranges: 94.0% for AGIs below $10k, 80.9% for AGIs $10k-25k, 88.3% for AGIs $25k-50k, 85.6% for AGIs $50k-75k, 83.9% for AGIs $75k-100k, 62.2% for AGIs over 100k)
Taxable interest for individuals: $1,035 (reported on 31.6% of returns)
This zip code:
$1,035
Minnesota:
$1,796
(% of AGI for various income ranges: 2.5% for AGIs below $10k, 1.3% for AGIs $10k-25k, 0.8% for AGIs $25k-50k, 0.7% for AGIs $50k-75k, 0.8% for AGIs $75k-100k, 1.2% for AGIs over 100k)
Taxable dividends: $1,314 (reported on 17.4% of returns)
Here:
$1,314
State:
$3,096
(% of AGI for various income ranges: 1.6% for AGIs below $10k, 0.8% for AGIs $10k-25k, 0.5% for AGIs $25k-50k, 0.5% for AGIs $50k-75k, 0.7% for AGIs $75k-100k, 0.9% for AGIs over 100k)
Net capital gain/loss: +$2,572 (reported on 12.1% of returns)
Here:
+$2,572
State:
+$10,864
(% of AGI for various income ranges: -0.5% for AGIs below $10k, -0.2% for AGIs $10k-25k, 0.2% for AGIs $25k-50k, 0.3% for AGIs $50k-75k, 1.1% for AGIs $75k-100k, 4.8% for AGIs over 100k)
Profit/loss from business: +$6,208 (reported on 10.8% of returns)
Here:
+$6,208
State:
+$10,442
(% of AGI for various income ranges: 8.0% for AGIs below $10k, 2.9% for AGIs $10k-25k, 1.3% for AGIs $25k-50k, 1.2% for AGIs $50k-75k, 1.3% for AGIs $75k-100k, 3.3% for AGIs over 100k)
IRA payment deduction: $2,500 (reported on 2.1% of returns)
55429:
$2,500
Minnesota:
$2,955
(% of AGI for various income ranges: 0.2% for AGIs $10k-25k, 0.2% for AGIs $25k-50k, 0.1% for AGIs $50k-75k, 0.1% for AGIs $75k-100k, 0.1% for AGIs over 100k)
Self-employed pension: $7,353 (reported on 0.3% of returns)
Here:
$7,353
Minnesota:
$12,099
Total itemized deductions: $17,144 (29% of AGI, reported on 35.8% of returns)
Here:
$17,144
State:
$20,035
Here:
29.4% of AGI
State:
21.3% of AGI
(% of AGI for various income ranges: 8.6% for AGIs below $10k, 9.4% for AGIs $10k-25k, 20.3% for AGIs $25k-50k, 17.6% for AGIs $50k-75k, 18.5% for AGIs $75k-100k, 16.0% for AGIs over 100k)
Charity contributions deductions: $2,206 (4% of AGI, reported on 30.1% of returns)
Here:
$2,206
State:
$3,333
Here:
3.7% of AGI
State:
3.4% of AGI
(% of AGI for various income ranges: 0.7% for AGIs below $10k, 1.0% for AGIs $10k-25k, 1.6% for AGIs $25k-50k, 2.2% for AGIs $50k-75k, 2.8% for AGIs $75k-100k, 2.0% for AGIs over 100k)
Total tax: $4,113 (reported on 72.0% of returns)
55429:
$4,113
State:
$8,485
(% of AGI for various income ranges: 2.0% for AGIs below $10k, 3.5% for AGIs $10k-25k, 6.6% for AGIs $25k-50k, 8.4% for AGIs $50k-75k, 10.1% for AGIs $75k-100k, 16.3% for AGIs over 100k)
Earned income credit: $1,725 (reported on 19.1% of returns)
Here:
$1,725
State:
$1,523
Percentage of individuals using paid preparers for their 2004 taxes: 57.5%
Here:
58%
State:
59%
(% for various income ranges: 53.5% for AGIs below $10k, 61.6% for AGIs $10k-25k, 55.5% for AGIs $25k-50k, 59.8% for AGIs $50k-75k, 56.6% for AGIs $75k-100k, 59.7% for AGIs over 100k)
Likely homosexual households (counted as self-reported same-sex unmarried-partner households)
Lesbian couples: 0.2% of all households
Gay men: 0.2% of all households
Household received Food Stamps/SNAP in the past 12 months: 1,614 Household did not receive Food Stamps/SNAP in the past 12 months: 8,980
Women who had a birth in the past 12 months: 633 (299 now married, 319 unmarried) Women who did not have a birth in the past 12 months: 6,459 (2,372 now married, 4,084 unmarried)
Housing units in zip code 55429 with a mortgage: 4,118 (473 second mortgage, 72 home equity loan, 195 both second mortgage and home equity loan) Houses without a mortgage: 30
Median monthly owner costs for units with a mortgage: $1,665 Median monthly owner costs for units without a mortgage: $655
Residents with income below the poverty level in 2022:
This zip code:
10.2%
Whole state:
9.6%
Residents with income below 50% of the poverty level in 2022:
This zip code:
5.3%
Whole state:
5.2%
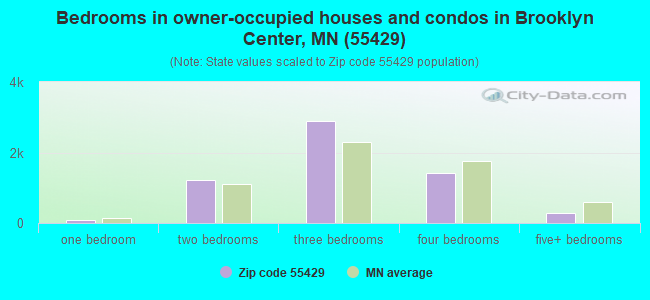
Median number of rooms in houses and condos:
Here:
6.5
State:
7.1
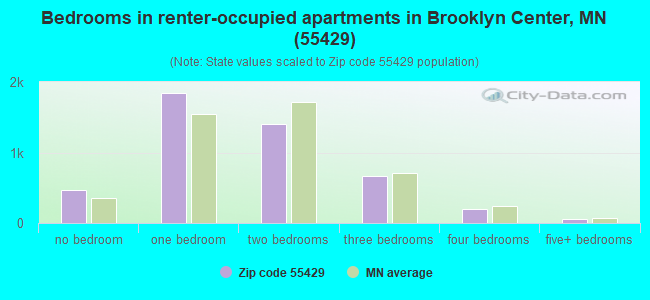
Median number of rooms in apartments:
Here:
3.6
State:
3.8
Notable locations in this zip code not listed on our city pages
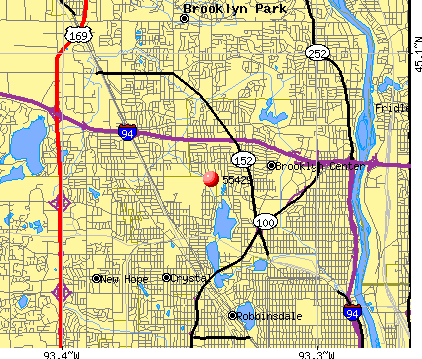
Notable locations in zip code 55429: West Metro Fire and Rescue District Station 1 (A), Brooklyn Center Fire Department West Fire Station (B). Display/hide their locations on the map
Churches in zip code 55429 include: Brooklyn Church (A), Cross of Glory Church (B), Voice of Alert Spanish Church (C), Saint Alphonsus Catholic Church (D), North Center Baptist Church (E), New Beginning Christian Center Church (F), Korean United Methodist Church (G), Korean Evangelical United Methodist Church (H), Brooklyn United Methodist Church (I). Display/hide their locations on the map
Parks in zip code 55429 include: Kylawn Park (1), Marlin Park (2), Northport Park (3), Orchard Lane Park (4), Twin Oaks Park (5), Wangstead Park (6), Willow Lane Park (7), Zanewood Park (8), Twin Lake Beach Park (9). Display/hide their locations on the map
4,458 married couples with children.
2,815 single-parent households (720 men, 2,095 women).
71.4% of residents of 55429 zip code speak English at home.
9.4% of residents speak Spanish at home (55% very well, 24% well, 17% not well, 4% not at all).
1.3% of residents speak other Indo-European language at home (47% very well, 40% well, 13% not well).
9.8% of residents speak Asian or Pacific Island language at home (50% very well, 31% well, 16% not well, 4% not at all).
8.1% of residents speak other language at home (61% very well, 33% well, 5% not well).
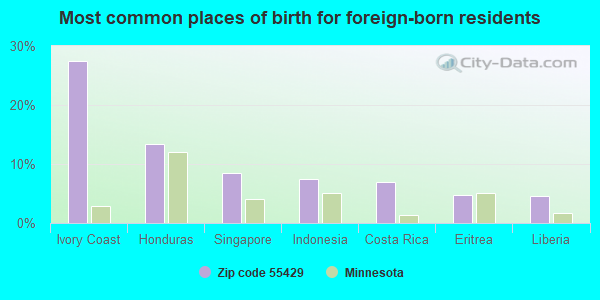
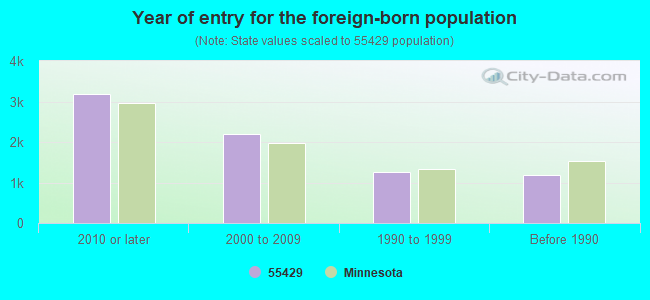
Foreign born population: 7,315 (25.7%) (44.4% of them are naturalized citizens)
Major facilities with environmental interests located in this zip code:
GLEN HAVEN MEMORIAL GARDENS (5100 DOUGLAS DR N in CRYSTAL, MN)
STATE MASTER (Minnesota Pollution Control Agency permits and compilance tracking) - PCS-UP000004, NPDES STORMWATER PERMIT STATE MASTER (Minnesota Pollution Control Agency permits and compilance tracking) - RCRAINFO-MNR000106286, CESQG, RCRIS-MNR000106286, Conditionally Exempt Small Quantity Generators, less than 100 kg/month of hazardous waste (Resource Conservation and Recovery Act (tracking hazardous waste)) - notification Organizations: SCI MINNESOTA FUNERAL SERVICE (CONTACT/OWNER)
ALTRA AUTOBODY (6301 WELCONE AVE N in BROOKLYN PARK, MN)
AIR MINOR (AIRS/AFS) STATE MASTER (Minnesota Pollution Control Agency permits and compilance tracking) - AIRS-2705300951, AIR PROGRAM, RCRIS-MND985700848, HAZARDOUS WASTE PROGRAM Conditionally Exempt Small Quantity Generators, less than 100 kg/month of hazardous waste (Resource Conservation and Recovery Act (tracking hazardous waste)) - notification Business SIC classification: TOP, BODY, AND UPHOLSTERY REPAIR SHOPS AND PAINT SHOPS Business NAICS classification: AUTOMOTIVE BODY, PAINT, AND INTERIOR REPAIR AND MAINTENANCE. Organizations: WELCOME SQUARE PARTNERS (CONTACT/OWNER)
Alternative names: ALTNA AUTOBODY
FORMER BUILDERS SQUARE (3600 63RD AVE N in BROOKLYN CENTER, MN)
STATE MASTER (Minnesota Pollution Control Agency permits and compilance tracking) - RCRAINFO-MND150097491, CESQG, RCRIS-MND150097491, (Resource Conservation and Recovery Act (tracking hazardous waste)) Organizations: BROOKLYN CENTER LP CO OPPIDAN (CONTACT/OWNER)
BEAVER MACHINE AND TOOL INC (5249 HANSON CT in MINNEAPOLIS, MN)
STATE MASTER (Minnesota Pollution Control Agency permits and compilance tracking) - RCRAINFO-MND006454235, SQG, RCRIS-MND006454235, (Resource Conservation and Recovery Act (tracking hazardous waste)) Business SIC classification: INDUSTRIAL AND COMMERCIAL MACHINERY AND EQUIPMENT Organizations: BEAVER MACHINE & TOOL INC (CONTACT/OWNER)
OASIS MARKETS (6300 ZANE AVE N in BROOKLYN PARK, MN)
STATE MASTER (Minnesota Pollution Control Agency permits and compilance tracking) - RCRAINFO-MNR000028779, CESQG, RCRIS-MNR000028779, (Resource Conservation and Recovery Act (tracking hazardous waste)) Organizations: TWIN CITIES STORES INC (CONTACT/OWNER)
MTI DISTRIBUTING (4830 AZELIA AVE N in BROOKLYN CENTER, MN)
STATE MASTER (Minnesota Pollution Control Agency permits and compilance tracking) - RCRAINFO-MNR000106211, CESQG, RCRIS-MNR000106211, (Resource Conservation and Recovery Act (tracking hazardous waste)) Organizations: TWIN LAKE LLC (CONTACT/OWNER)
NORTH MEMORIAL AIR CARE (5800 CRYSTAL AIRPORT RD STE 5 in MINNEAPOLIS, MN)
STATE MASTER (Minnesota Pollution Control Agency permits and compilance tracking) - RCRAINFO-MNR000058321, NOT IN A UNIVERSE, RCRIS-MNR000058321, HAZARDOUS WASTE PROGRAM (Resource Conservation and Recovery Act (tracking hazardous waste)) Organizations: NORTH MEMORIAL MEDICAL CTR (CONTACT/OWNER)
AAMCO TRANSMISSION (5231 WEST BROADWAY AVENUE in MINNEAPOLIS, MN)
STATE MASTER (Minnesota Pollution Control Agency permits and compilance tracking) - RCRAINFO-MND982204372, HAZARDOUS WASTE PROGRAM, RCRIS-MND982204372, Small Quantity Generators, between 100 kg and 1000 kg of hazardous waste/month (Resource Conservation and Recovery Act (tracking hazardous waste)) - notification USED OIL PROGRAM (Resource Conservation and Recovery Act (tracking hazardous waste)) Business SIC classification: AUTOMOTIVE TRANSMISSION REPAIR SHOPS Business NAICS classification: AUTOMOTIVE TRANSMISSION REPAIR. Organizations: BERGMAN KIM M (CONTACT/OWNER)
, WHITNEY & WHITNEY (CONTACT/OWNER)
Alternative names: AAMCO TRANSMISSIONS
OUTDOOR INDUSTRIAL SERVICES (5147 LAKELAND AVE N in MINNEAPOLIS, MN)
STATE MASTER (Minnesota Pollution Control Agency permits and compilance tracking) - RCRAINFO-MN0000255034, HAZARDOUS WASTE PROGRAM, RCRIS-MN0000255034, (Resource Conservation and Recovery Act (tracking hazardous waste)) Organizations: MICKLE JAMES JOHN (CONTACT/OWNER)
GILBY SOAP& CHEMICAL CO (3400 48TH AVE N in BROOKLYN CENTER, MN)
STATE MASTER (Minnesota Pollution Control Agency permits and compilance tracking) - RCRAINFO-MN0000370999, HAZARDOUS WASTE PROGRAM, RCRIS-MN0000370999, (Resource Conservation and Recovery Act (tracking hazardous waste)) Organizations: GILBERTSON MICHAEL (CONTACT/OWNER)
, GILBY SOAP & CHEMICAL CO (CONTACT/OWNER)
HOLIDAY AUTO SERVICE (6849B BROOKLYN BLVD in BROOKLYN CENTER, MN)
STATE MASTER (Minnesota Pollution Control Agency permits and compilance tracking) - RCRAINFO-MND106713241, CESQG, RCRIS-MND106713241, Conditionally Exempt Small Quantity Generators, less than 100 kg/month of hazardous waste (Resource Conservation and Recovery Act (tracking hazardous waste)) - notification USED OIL PROGRAM (Resource Conservation and Recovery Act (tracking hazardous waste)) Organizations: TRAN PETER QUYNH (CONTACT/OWNER)
NORTH MEMORIAL HEALTH CARE (4501 68TH AVE N in BROOKLYN CENTER, MN)
STATE MASTER (Minnesota Pollution Control Agency permits and compilance tracking) - RCRAINFO-MNR000024687, CESQG, RCRIS-MNR000024687, Small Quantity Generators, between 100 kg and 1000 kg of hazardous waste/month (Resource Conservation and Recovery Act (tracking hazardous waste)) - notification USED OIL PROGRAM (Resource Conservation and Recovery Act (tracking hazardous waste))
OSSEO BROOKLYN SCHOOL BUS CO (4435 68TH AVE in BROOKLYN CENTER, MN)
STATE MASTER (Minnesota Pollution Control Agency permits and compilance tracking) - RCRAINFO-MND985759075, CESQG, RCRIS-MND985759075, Conditionally Exempt Small Quantity Generators, less than 100 kg/month of hazardous waste (Resource Conservation and Recovery Act (tracking hazardous waste)) - notification TRANSPORTER (Resource Conservation and Recovery Act (tracking hazardous waste)) - notification Business SIC classification: SCHOOLS AND EDUCATIONAL SERVICES
Housing units lacking complete kitchen facilities: 0.6%
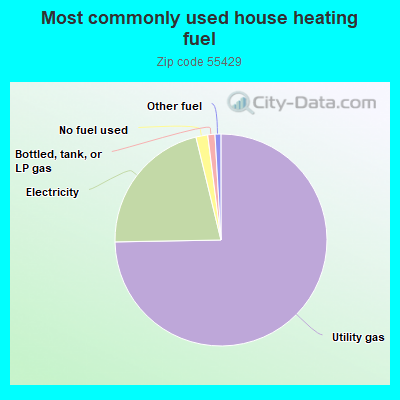
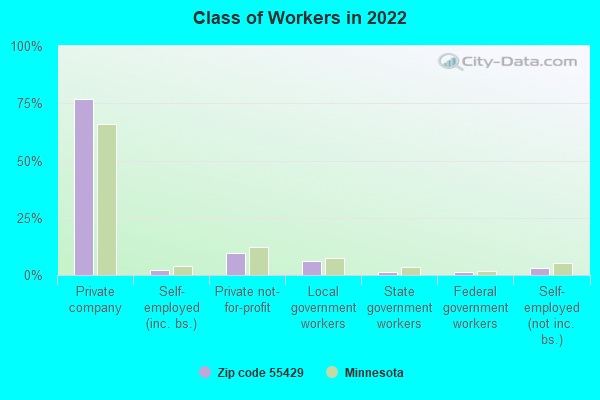
74.8%Utility gas
21.5%Electricity
1.8%No fuel used
1.1%Bottled, tank, or LP gas
0.9%Other fuel
Population in 1990: 22,597. Population change in the 1990s: +3,333 (+14.7%).
Place of birth for U.S.-born residents:
This state: 15,110
Northeast: 454
Midwest: 3,377
South: 903
West: 1,071
56% of the 55429 zip code residents lived in the same house 5 years ago. Out of people who lived in different houses, 65% lived in this county. Out of people who lived in different counties, 50% lived in Minnesota.
89% of the 55429 zip code residents lived in the same house 1 year ago. Out of people who lived in different houses, 54% moved from this county. Out of people who lived in different houses, 34% moved from different county within same state. Out of people who lived in different houses, 7% moved from different state. Out of people who lived in different houses, 2% moved from abroad.
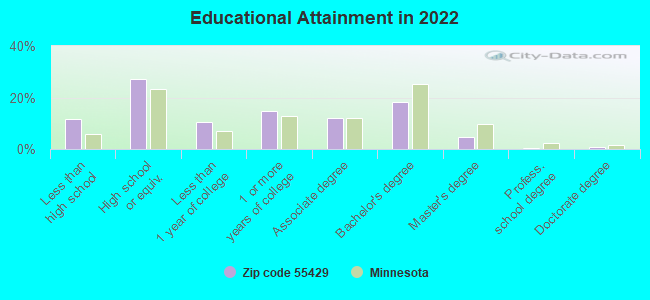
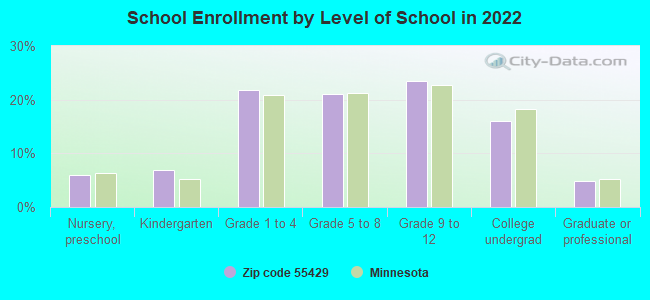
Private vs. public school enrollment:
Students in private schools in grades 1 to 8 (elementary and middle school): 271
Here:
8.3%
Minnesota:
12.9%
Students in private schools in grades 9 to 12 (high school): 195
Here:
10.8%
Minnesota:
8.6%
Students in private undergraduate colleges: 283
Here:
23.0%
Minnesota:
26.2%
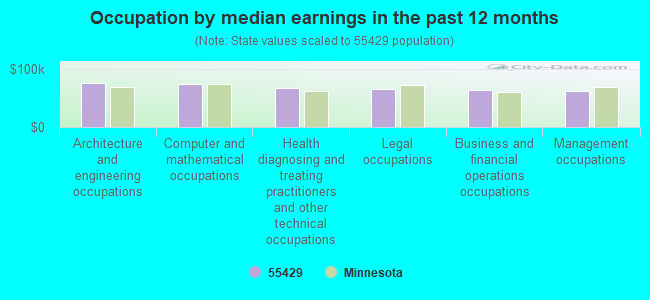
Occupation by median earnings in the past 12 months ($)
76,022Architecture and engineering occupations
74,030Computer and mathematical occupations
66,560Health diagnosing and treating practitioners and other technical occupations
66,006Legal occupations
64,421Business and financial operations occupations
62,095Management occupations
Top industries in this zip code by the number of employees in 2005:
Management of Companies and Enterprises: Corporate, Subsidiary, and Regional Managing Offices (100-249 employees: 1 establishment, 50-99 employees: 2 establishments, 10-19 employees: 1 establishment)
Health Care and Social Assistance: Home Health Care Services (100-249: 1, 10-19: 1, 5-9: 3, 1-4: 6)
Administrative and Support and Waste Management and Remediation Services: Temporary Help Services (100-249: 1, 20-49: 1, 5-9: 1, 1-4: 1)
Health Care and Social Assistance: Vocational Rehabilitation Services (100-249: 1, 20-49: 1, 1-4: 1)
Other Services (except Public Administration): Civic and Social Organizations (50-99: 2, 10-19: 2, 1-4: 2)
Health Care and Social Assistance: Ambulance Services (100-249: 1)
People in group quarters in 2010:
97 people in group homes intended for adults
86 people in nursing facilities/skilled-nursing facilities
12 people in residential treatment centers for adults
4 people in group homes for juveniles (non-correctional)
3 people in in-patient hospice facilities
People in group quarters in 2000:
183 people in nursing homes
61 people in homes for the mentally retarded
28 people in homes for the mentally ill
6 people in hospitals/wards and hospices for chronically ill
6 people in hospices or homes for chronically ill
Fatal accident statistics in 2014:
Fatal accident count: 1
Vehicles involved in fatal accidents: 1
Fatal accidents caused by drunken drivers: 0
Fatalities: 1
Persons involved in fatal accidents: 1
Pedestrians involved in fatal accidents: 1
Fatal accident statistics in 2011:
Fatal accident count: 1
Vehicles involved in fatal accidents: 2
Fatal accidents caused by drunken drivers: 0
Fatalities: 1
Persons involved in fatal accidents: 3
Pedestrians involved in fatal accidents: 0
Home Mortgage Disclosure Act Aggregated Statistics For Year 2009 (Based on 5 full and 18 partial tracts)
A) FHA, FSA/RHS & VA Home Purchase Loans
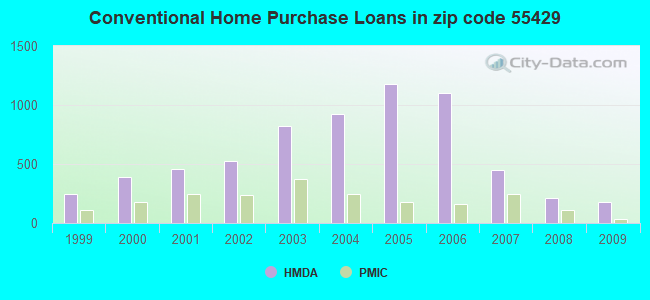
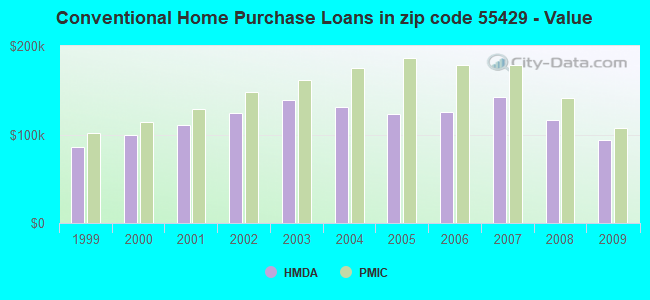
B) Conventional Home Purchase Loans
C) Refinancings
D) Home Improvement Loans
E) Loans on Dwellings For 5+ Families
F) Non-occupant Loans on < 5 Family Dwellings (A B C & D)
Number
Average Value
Number
Average Value
Number
Average Value
Number
Average Value
Number
Average Value
Number
Average Value
LOANS ORIGINATED
477
$122,410
178
$93,361
453
$139,000
32
$51,990
1
$6,019,920
81
$102,385
APPLICATIONS APPROVED, NOT ACCEPTED
26
$109,538
15
$94,025
69
$128,108
8
$19,801
0
$0
3
$74,500
APPLICATIONS DENIED
74
$134,947
34
$86,310
322
$142,624
46
$40,400
0
$0
19
$97,034
APPLICATIONS WITHDRAWN
62
$117,937
31
$84,752
148
$149,082
22
$56,769
0
$0
12
$95,450
FILES CLOSED FOR INCOMPLETENESS
7
$114,967
3
$81,273
70
$137,428
2
$131,315
0
$0
1
$77,640
Aggregated Statistics For Year 2008 (Based on 5 full and 18 partial tracts)
A) FHA, FSA/RHS & VA Home Purchase Loans
B) Conventional Home Purchase Loans
C) Refinancings
D) Home Improvement Loans
E) Loans on Dwellings For 5+ Families
F) Non-occupant Loans on < 5 Family Dwellings (A B C & D)
G) Loans On Manufactured Home Dwelling (A B C & D)
Number
Average Value
Number
Average Value
Number
Average Value
Number
Average Value
Number
Average Value
Number
Average Value
Number
Average Value
LOANS ORIGINATED
276
$147,810
216
$116,285
378
$141,108
63
$57,248
4
$1,086,170
66
$121,316
0
$0
APPLICATIONS APPROVED, NOT ACCEPTED
20
$134,113
26
$121,553
102
$149,444
17
$45,559
0
$0
7
$118,436
4
$70,878
APPLICATIONS DENIED
43
$163,239
60
$113,004
442
$165,568
94
$63,202
3
$3,178,670
18
$129,972
13
$35,412
APPLICATIONS WITHDRAWN
51
$159,039
22
$115,584
127
$148,717
17
$80,684
0
$0
12
$143,677
2
$52,325
FILES CLOSED FOR INCOMPLETENESS
6
$131,560
10
$143,127
41
$163,830
9
$46,176
1
$11,705,400
6
$145,495
0
$0
Aggregated Statistics For Year 2007 (Based on 5 full and 18 partial tracts)
A) FHA, FSA/RHS & VA Home Purchase Loans
B) Conventional Home Purchase Loans
C) Refinancings
D) Home Improvement Loans
E) Loans on Dwellings For 5+ Families
F) Non-occupant Loans on < 5 Family Dwellings (A B C & D)
G) Loans On Manufactured Home Dwelling (A B C & D)
Number
Average Value
Number
Average Value
Number
Average Value
Number
Average Value
Number
Average Value
Number
Average Value
Number
Average Value
LOANS ORIGINATED
40
$176,323
451
$142,868
708
$138,180
131
$47,599
6
$2,399,737
95
$137,400
0
$0
APPLICATIONS APPROVED, NOT ACCEPTED
1
$121,550
74
$139,192
200
$136,448
27
$45,124
0
$0
14
$136,308
3
$23,060
APPLICATIONS DENIED
12
$203,668
205
$148,639
723
$166,070
162
$66,785
0
$0
52
$138,102
14
$65,928
APPLICATIONS WITHDRAWN
1
$206,630
79
$147,062
252
$162,936
19
$68,697
0
$0
17
$152,355
0
$0
FILES CLOSED FOR INCOMPLETENESS
0
$0
38
$173,324
107
$179,497
3
$57,140
0
$0
6
$154,303
0
$0
Aggregated Statistics For Year 2006 (Based on 5 full and 18 partial tracts)
A) FHA, FSA/RHS & VA Home Purchase Loans
B) Conventional Home Purchase Loans
C) Refinancings
D) Home Improvement Loans
E) Loans on Dwellings For 5+ Families
F) Non-occupant Loans on < 5 Family Dwellings (A B C & D)
G) Loans On Manufactured Home Dwelling (A B C & D)
Number
Average Value
Number
Average Value
Number
Average Value
Number
Average Value
Number
Average Value
Number
Average Value
Number
Average Value
LOANS ORIGINATED
49
$181,113
1,099
$125,493
1,031
$135,683
123
$56,077
7
$866,356
155
$139,048
1
$22,300
APPLICATIONS APPROVED, NOT ACCEPTED
0
$0
220
$127,633
255
$141,995
40
$80,427
0
$0
56
$155,342
2
$15,500
APPLICATIONS DENIED
4
$152,880
463
$125,627
916
$155,947
112
$68,898
2
$434,060
96
$151,939
9
$28,908
APPLICATIONS WITHDRAWN
0
$0
213
$135,460
557
$161,877
41
$101,621
1
$729,570
54
$141,355
0
$0
FILES CLOSED FOR INCOMPLETENESS
1
$209,230
50
$152,620
152
$173,185
4
$63,668
0
$0
11
$194,736
0
$0
Aggregated Statistics For Year 2005 (Based on 5 full and 18 partial tracts)
A) FHA, FSA/RHS & VA Home Purchase Loans
B) Conventional Home Purchase Loans
C) Refinancings
D) Home Improvement Loans
E) Loans on Dwellings For 5+ Families
F) Non-occupant Loans on < 5 Family Dwellings (A B C & D)
G) Loans On Manufactured Home Dwelling (A B C & D)
Number
Average Value
Number
Average Value
Number
Average Value
Number
Average Value
Number
Average Value
Number
Average Value
Number
Average Value
LOANS ORIGINATED
57
$184,529
1,174
$123,450
1,372
$143,078
162
$57,957
12
$2,124,032
199
$137,818
0
$0
APPLICATIONS APPROVED, NOT ACCEPTED
1
$299,670
186
$122,287
266
$146,774
29
$71,122
0
$0
41
$131,902
0
$0
APPLICATIONS DENIED
6
$203,125
434
$124,289
865
$156,643
162
$65,730
0
$0
69
$128,656
13
$33,014
APPLICATIONS WITHDRAWN
10
$169,290
233
$145,428
640
$162,690
47
$161,178
0
$0
36
$138,932
0
$0
FILES CLOSED FOR INCOMPLETENESS
3
$176,517
69
$121,880
275
$168,394
7
$36,859
0
$0
10
$151,655
0
$0
Aggregated Statistics For Year 2004 (Based on 5 full and 18 partial tracts)
A) FHA, FSA/RHS & VA Home Purchase Loans
B) Conventional Home Purchase Loans
C) Refinancings
D) Home Improvement Loans
E) Loans on Dwellings For 5+ Families
F) Non-occupant Loans on < 5 Family Dwellings (A B C & D)
G) Loans On Manufactured Home Dwelling (A B C & D)
Number
Average Value
Number
Average Value
Number
Average Value
Number
Average Value
Number
Average Value
Number
Average Value
Number
Average Value
LOANS ORIGINATED
128
$170,095
923
$131,525
1,451
$135,789
194
$45,494
4
$2,398,600
142
$144,239
2
$17,240
APPLICATIONS APPROVED, NOT ACCEPTED
0
$0
135
$138,307
314
$135,915
27
$48,517
2
$346,760
19
$135,993
2
$32,635
APPLICATIONS DENIED
14
$176,622
205
$141,597
819
$143,450
108
$44,013
0
$0
50
$158,333
8
$38,675
APPLICATIONS WITHDRAWN
5
$196,326
88
$140,396
514
$158,551
36
$68,476
0
$0
20
$157,116
0
$0
FILES CLOSED FOR INCOMPLETENESS
1
$264,420
21
$125,075
254
$152,210
13
$52,172
0
$0
4
$116,962
0
$0
Aggregated Statistics For Year 2003 (Based on 5 full and 18 partial tracts)
A) FHA, FSA/RHS & VA Home Purchase Loans
B) Conventional Home Purchase Loans
C) Refinancings
D) Home Improvement Loans
E) Loans on Dwellings For 5+ Families
F) Non-occupant Loans on < 5 Family Dwellings (A B C & D)
Number
Average Value
Number
Average Value
Number
Average Value
Number
Average Value
Number
Average Value
Number
Average Value
LOANS ORIGINATED
154
$163,951
823
$139,545
2,849
$118,557
149
$32,353
17
$871,168
144
$134,550
APPLICATIONS APPROVED, NOT ACCEPTED
6
$151,907
103
$134,297
352
$124,531
19
$31,519
0
$0
25
$132,785
APPLICATIONS DENIED
16
$159,421
179
$132,997
937
$127,563
122
$30,003
2
$815,900
52
$136,159
APPLICATIONS WITHDRAWN
6
$143,032
94
$159,081
815
$126,444
18
$36,223
0
$0
13
$133,456
FILES CLOSED FOR INCOMPLETENESS
6
$136,660
31
$145,198
140
$122,539
4
$16,052
0
$0
8
$113,556
Aggregated Statistics For Year 2002 (Based on 5 full and 10 partial tracts)
A) FHA, FSA/RHS & VA Home Purchase Loans
B) Conventional Home Purchase Loans
C) Refinancings
D) Home Improvement Loans
E) Loans on Dwellings For 5+ Families
F) Non-occupant Loans on < 5 Family Dwellings (A B C & D)
Number
Average Value
Number
Average Value
Number
Average Value
Number
Average Value
Number
Average Value
Number
Average Value
LOANS ORIGINATED
222
$151,881
526
$124,469
1,771
$107,529
116
$23,927
5
$942,808
78
$126,188
APPLICATIONS APPROVED, NOT ACCEPTED
6
$188,238
53
$125,085
255
$113,139
27
$37,799
0
$0
9
$120,850
APPLICATIONS DENIED
10
$136,345
97
$124,311
617
$107,835
129
$22,670
2
$1,576,745
13
$148,195
APPLICATIONS WITHDRAWN
8
$140,681
60
$134,162
588
$119,862
25
$32,986
0
$0
13
$129,073
FILES CLOSED FOR INCOMPLETENESS
1
$91,000
19
$91,079
167
$119,795
4
$37,402
0
$0
0
$0
Aggregated Statistics For Year 2001 (Based on 5 full and 10 partial tracts)
A) FHA, FSA/RHS & VA Home Purchase Loans
B) Conventional Home Purchase Loans
C) Refinancings
D) Home Improvement Loans
E) Loans on Dwellings For 5+ Families
F) Non-occupant Loans on < 5 Family Dwellings (A B C & D)
Number
Average Value
Number
Average Value
Number
Average Value
Number
Average Value
Number
Average Value
Number
Average Value
LOANS ORIGINATED
270
$140,445
456
$110,673
1,594
$97,472
164
$23,902
4
$583,162
50
$108,371
APPLICATIONS APPROVED, NOT ACCEPTED
6
$139,845
32
$95,290
169
$93,977
35
$17,151
0
$0
3
$146,053
APPLICATIONS DENIED
17
$138,442
71
$90,572
506
$82,413
114
$18,416
0
$0
9
$78,357
APPLICATIONS WITHDRAWN
9
$139,853
50
$119,700
528
$101,984
26
$25,718
0
$0
0
$0
FILES CLOSED FOR INCOMPLETENESS
2
$119,935
13
$112,357
120
$102,059
7
$42,191
0
$0
3
$157,600
Aggregated Statistics For Year 2000 (Based on 5 full and 10 partial tracts)
A) FHA, FSA/RHS & VA Home Purchase Loans
B) Conventional Home Purchase Loans
C) Refinancings
D) Home Improvement Loans
E) Loans on Dwellings For 5+ Families
F) Non-occupant Loans on < 5 Family Dwellings (A B C & D)
Number
Average Value
Number
Average Value
Number
Average Value
Number
Average Value
Number
Average Value
Number
Average Value
LOANS ORIGINATED
289
$123,565
393
$99,091
462
$73,760
218
$17,179
3
$341,590
22
$104,013
APPLICATIONS APPROVED, NOT ACCEPTED
2
$80,935
49
$76,765
97
$73,432
58
$16,572
2
$685,355
1
$105,810
APPLICATIONS DENIED
23
$123,156
101
$74,512
374
$68,587
168
$19,678
0
$0
13
$71,815
APPLICATIONS WITHDRAWN
5
$144,248
38
$104,235
244
$84,080
20
$27,650
0
$0
8
$71,130
FILES CLOSED FOR INCOMPLETENESS
4
$118,918
15
$95,246
117
$94,124
1
$39,910
0
$0
1
$39,910
Aggregated Statistics For Year 1999 (Based on 3 full and 7 partial tracts)
A) FHA, FSA/RHS & VA Home Purchase Loans
B) Conventional Home Purchase Loans
C) Refinancings
D) Home Improvement Loans
E) Loans on Dwellings For 5+ Families
F) Non-occupant Loans on < 5 Family Dwellings (A B C & D)
2002 - 2018 National Fire Incident Reporting System (NFIRS) incidents
Based on the data from the years 2002 - 2018 the average number of fire incidents per year is 129. The highest number of reported fire incidents - 211 took place in 2014, and the least - 65 in 2004. The data has a constant trend.
When looking into fire subcategories, the most reports belonged to: Structure Fires (66.8%), and Outside Fires (17.7%).
Fire incident types reported to NFIRS in Zip Code 55429
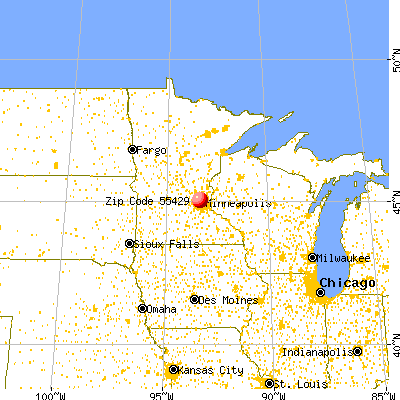


 Nearest zip codes: 55430, 55428, 55412, 55443, 55422, 55444.
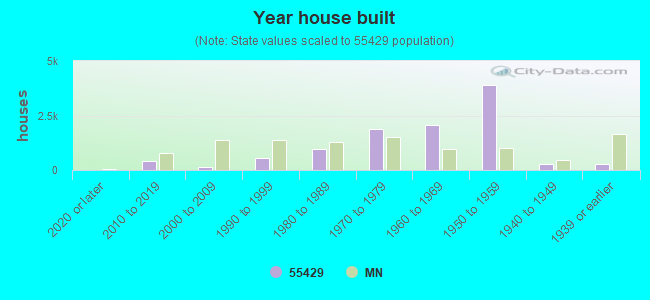


 Based on the data from the years 2002 - 2018 the average number of fire incidents per year is 129. The highest number of reported fire incidents - 211 took place in 2014, and the least - 65 in 2004. The data has a constant trend.
 When looking into fire subcategories, the most reports belonged to: Structure Fires (66.8%), and Outside Fires (17.7%).