Estimated zip code population in 2022: 7,706 Zip code population in 2010: 7,030 Zip code population in 2000: 6,633
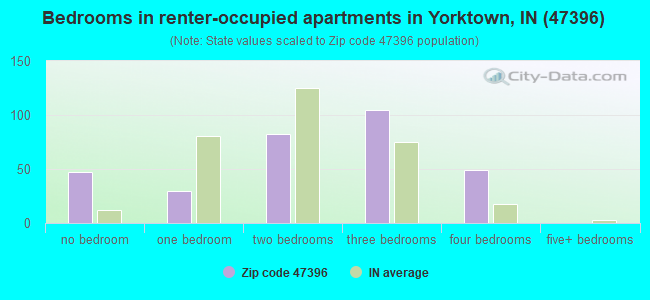
Houses and condos: 3,348 Renter-occupied apartments: 315
% of renters here:
10%
State:
29%
March 2022 cost of living index in zip code 47396: 82.2 (low, U.S. average is 100)
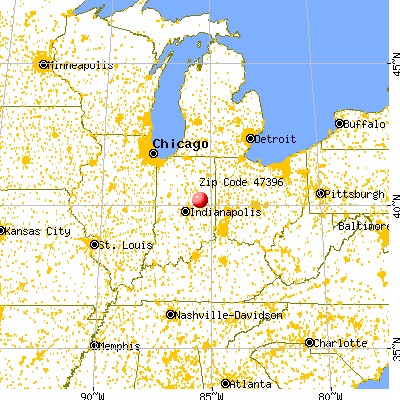
Land area: 31.9 sq. mi. Water area: 0.2 sq. mi.
Population density: 242 people per square mile
(very low).
OSM Map
General Map
Google Map
MSN Map
OSM Map
General Map
Google Map
MSN Map
OSM Map
General Map
Google Map
MSN Map
OSM Map
General Map
Google Map
MSN Map
Please wait while loading the map...
Real estate property taxes paid for housing units in 2022:
This zip code:
0.7% ($1,301)
Indiana:
0.7% ($1,467)
Median real estate property taxes paid for housing units with mortgages in 2022: $1,236 (0.7%) Median real estate property taxes paid for housing units with no mortgage in 2022: $1,489 (0.9%)
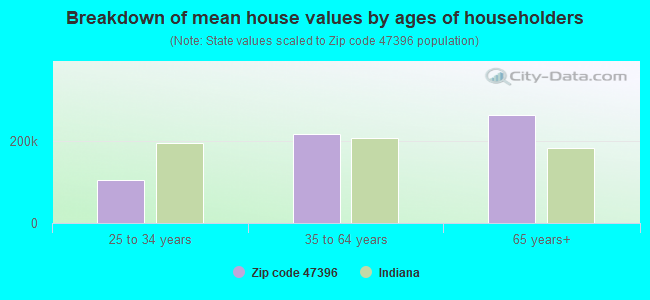
Estimated median house/condo value in 2022: $182,783
47396:
$182,783
Indiana:
$208,700
Median resident age:
This zip code:
39.9 years
Indiana median age:
38.2 years
Average household size:
This zip code:
2.5 people
Indiana:
2.4 people
Averages for the 2020 tax year for zip code 47396, filed in 2021:
Average Adjusted Gross Income (AGI) in 2020: $78,438 (Individual Income Tax Returns)
Here:
$78,438
State:
$64,978
Salary/wage: $67,424 (reported on 77.7% of returns)
Here:
$67,424
State:
$55,245
(% of AGI for various income ranges: 957.0% for AGIs below $25k, 3129.8% for AGIs $25k-50k, 5798.9% for AGIs $50k-75k, 8962.5% for AGIs $75k-100k, 17600.3% for AGIs $100k-200k, 64523.7% for AGIs over 200k)
Taxable interest for individuals: $1,550 (reported on 28.9% of returns)
This zip code:
$1,550
Indiana:
$1,351
(% of AGI for various income ranges: 13.3% for AGIs below $25k, 25.1% for AGIs $25k-50k, 56.8% for AGIs $50k-75k, 40.7% for AGIs $75k-100k, 82.4% for AGIs $100k-200k, 918.8% for AGIs over 200k)
Ordinary dividends: $6,267 (reported on 21.3% of returns)
Here:
$6,267
State:
$5,827
(% of AGI for various income ranges: 25.2% for AGIs below $25k, 48.3% for AGIs $25k-50k, 109.5% for AGIs $50k-75k, 157.9% for AGIs $75k-100k, 260.5% for AGIs $100k-200k, 3178.8% for AGIs over 200k)
Net capital gain/loss in AGI: +$18,212 (reported on 19.6% of returns)
Here:
+$18,212
State:
+$17,730
(% of AGI for various income ranges: 11.9% for AGIs below $25k, 31.8% for AGIs $25k-50k, 103.9% for AGIs $50k-75k, 142.1% for AGIs $75k-100k, 594.6% for AGIs $100k-200k, 12267.5% for AGIs over 200k)
Profit/loss from business: +$11,087 (reported on 14.7% of returns)
Here:
+$11,087
State:
+$12,144
(% of AGI for various income ranges: 66.0% for AGIs below $25k, 61.5% for AGIs $25k-50k, 205.8% for AGIs $50k-75k, 175.7% for AGIs $75k-100k, 517.0% for AGIs $100k-200k, 2315.0% for AGIs over 200k)
Taxable individual retirement arrangement distribution: $16,546 (reported on 12.5% of returns)
47396:
$16,546
Indiana:
$18,302
(% of AGI for various income ranges: 81.1% for AGIs below $25k, 138.6% for AGIs $25k-50k, 285.8% for AGIs $50k-75k, 293.2% for AGIs $75k-100k, 852.7% for AGIs $100k-200k, 1218.8% for AGIs over 200k)
Total itemized deductions: $36,700 (reported on 5.7% of returns)
Here:
$36,700
State:
$35,601
(% of AGI for various income ranges: 196.3% for AGIs $25k-50k, 231.4% for AGIs $75k-100k, 549.2% for AGIs $100k-200k, 4688.8% for AGIs over 200k)
Charity contributions: $17,031 (reported on 4.4% of returns)
Here:
$17,031
State:
$15,596
(% of AGI for various income ranges: 33.7% for AGIs $50k-75k, 166.5% for AGIs $100k-200k, 2476.2% for AGIs over 200k)
Taxes paid: $7,933 (reported on 5.7% of returns)
47396:
$7,933
State:
$7,542
(% of AGI for various income ranges: 22.3% for AGIs $25k-50k, 50.7% for AGIs $75k-100k, 152.7% for AGIs $100k-200k, 1017.5% for AGIs over 200k)
Earned income credit: $2,281 (reported on 11.4% of returns)
Here:
$2,281
State:
$2,298
(% of AGI for various income ranges: 71.1% for AGIs below $25k, 56.6% for AGIs $25k-50k)
Percentage of individuals using paid preparers for their 2020 taxes: 95.1%
Here:
95%
State:
94%
(% for various income ranges: 95.7% for AGIs below $25k, 94.9% for AGIs $25k-50k, 96.0% for AGIs $50k-75k, 94.7% for AGIs $75k-100k, 95.1% for AGIs $100k-200k, 91.7% for AGIs over 200k)
Averages for the 2012 tax year for zip code 47396, filed in 2013:
Average Adjusted Gross Income (AGI) in 2012: $66,932 (Individual Income Tax Returns)
Here:
$66,932
State:
$52,932
Salary/wage: $53,613 (reported on 82.9% of returns)
Here:
$53,613
State:
$45,173
(% of AGI for various income ranges: 68.4% for AGIs below $25k, 74.2% for AGIs $25k-50k, 73.5% for AGIs $50k-75k, 75.4% for AGIs $75k-100k, 77.7% for AGIs $100k-200k, 47.4% for AGIs over 200k)
Taxable interest for individuals: $1,545 (reported on 33.5% of returns)
This zip code:
$1,545
Indiana:
$1,311
(% of AGI for various income ranges: 1.2% for AGIs below $25k, 0.5% for AGIs $25k-50k, 0.8% for AGIs $50k-75k, 0.7% for AGIs $75k-100k, 0.6% for AGIs $100k-200k, 0.9% for AGIs over 200k)
Ordinary dividends: $4,330 (reported on 21.3% of returns)
Here:
$4,330
State:
$4,690
(% of AGI for various income ranges: 1.2% for AGIs below $25k, 0.9% for AGIs $25k-50k, 1.0% for AGIs $50k-75k, 0.7% for AGIs $75k-100k, 1.0% for AGIs $100k-200k, 2.3% for AGIs over 200k)
Net capital gain/loss in AGI: +$6,602 (reported on 17.4% of returns)
Here:
+$6,602
State:
+$10,406
(% of AGI for various income ranges: 1.0% for AGIs $50k-75k, 0.4% for AGIs $75k-100k, 1.0% for AGIs $100k-200k, 4.1% for AGIs over 200k)
Profit/loss from business: +$17,126 (reported on 14.1% of returns)
Here:
+$17,126
State:
+$11,105
(% of AGI for various income ranges: 4.2% for AGIs below $25k, 1.7% for AGIs $25k-50k, 1.8% for AGIs $50k-75k, 3.1% for AGIs $75k-100k, 3.7% for AGIs $100k-200k, 5.2% for AGIs over 200k)
Taxable individual retirement arrangement distribution: $13,673 (reported on 13.5% of returns)
47396:
$13,673
Indiana:
$13,841
(% of AGI for various income ranges: 5.9% for AGIs below $25k, 3.2% for AGIs $25k-50k, 3.2% for AGIs $50k-75k, 2.6% for AGIs $75k-100k, 5.0% for AGIs $100k-200k)
Self-employment retirement plans: $17,333 (reported on 0.9% of returns)
47396:
$17,333
Indiana:
$21,482
(% of AGI for various income ranges: 1.0% for AGIs $100k-200k)
Total itemized deductions: $23,113 (16% of AGI, reported on 29.3% of returns)
Here:
$23,113
State:
$20,913
Here:
16.2% of AGI
State:
18.2% of AGI
(% of AGI for various income ranges: 7.4% for AGIs below $25k, 8.0% for AGIs $25k-50k, 8.0% for AGIs $50k-75k, 10.6% for AGIs $75k-100k, 12.2% for AGIs $100k-200k, 10.7% for AGIs over 200k)
Charity contributions: $4,790 (reported on 23.1% of returns)
Here:
$4,790
State:
$4,697
(% of AGI for various income ranges: 0.6% for AGIs below $25k, 0.9% for AGIs $25k-50k, 1.1% for AGIs $50k-75k, 1.4% for AGIs $75k-100k, 2.0% for AGIs $100k-200k, 2.3% for AGIs over 200k)
Taxes paid: $9,091 (reported on 29.3% of returns)
47396:
$9,091
State:
$7,456
(% of AGI for various income ranges: 0.9% for AGIs below $25k, 1.6% for AGIs $25k-50k, 2.2% for AGIs $50k-75k, 3.6% for AGIs $75k-100k, 4.9% for AGIs $100k-200k, 5.8% for AGIs over 200k)
Earned income credit: $2,279 (reported on 14.4% of returns)
Here:
$2,279
State:
$2,265
(% of AGI for various income ranges: 5.6% for AGIs below $25k, 1.1% for AGIs $25k-50k)
Percentage of individuals using paid preparers for their 2012 taxes: 53.9%
Here:
54%
State:
53%
(% for various income ranges: 48.0% for AGIs below $25k, 52.2% for AGIs $25k-50k, 53.7% for AGIs $50k-75k, 59.4% for AGIs $75k-100k, 61.0% for AGIs $100k-200k, 80.0% for AGIs over 200k)
Averages for the 2004 tax year for zip code 47396, filed in 2005:
Average Adjusted Gross Income (AGI) in 2004: $59,517 (Individual Income Tax Returns)
Here:
$59,517
State:
$44,790
Salary/wage: $49,002 (reported on 86.1% of returns)
Here:
$49,002
State:
$39,615
(% of AGI for various income ranges: 113.2% for AGIs below $10k, 64.4% for AGIs $10k-25k, 76.3% for AGIs $25k-50k, 82.6% for AGIs $50k-75k, 83.6% for AGIs $75k-100k, 61.9% for AGIs over 100k)
Taxable interest for individuals: $1,491 (reported on 53.3% of returns)
This zip code:
$1,491
Indiana:
$1,535
(% of AGI for various income ranges: 7.6% for AGIs below $10k, 2.4% for AGIs $10k-25k, 1.1% for AGIs $25k-50k, 1.1% for AGIs $50k-75k, 1.1% for AGIs $75k-100k, 1.3% for AGIs over 100k)
Taxable dividends: $2,737 (reported on 27.9% of returns)
Here:
$2,737
State:
$2,998
(% of AGI for various income ranges: 3.2% for AGIs below $10k, 1.6% for AGIs $10k-25k, 0.9% for AGIs $25k-50k, 0.8% for AGIs $50k-75k, 0.7% for AGIs $75k-100k, 1.6% for AGIs over 100k)
Net capital gain/loss: +$9,948 (reported on 20.2% of returns)
Here:
+$9,948
State:
+$8,619
(% of AGI for various income ranges: -2.1% for AGIs below $10k, 1.3% for AGIs $10k-25k, 1.1% for AGIs $25k-50k, 0.4% for AGIs $50k-75k, 1.2% for AGIs $75k-100k, 5.9% for AGIs over 100k)
Profit/loss from business: +$14,132 (reported on 14.6% of returns)
Here:
+$14,132
State:
+$10,071
(% of AGI for various income ranges: 3.7% for AGIs below $10k, 4.6% for AGIs $10k-25k, 2.9% for AGIs $25k-50k, 2.3% for AGIs $50k-75k, 2.3% for AGIs $75k-100k, 4.2% for AGIs over 100k)
IRA payment deduction: $3,293 (reported on 2.4% of returns)
47396:
$3,293
Indiana:
$2,840
(% of AGI for various income ranges: 0.3% for AGIs $25k-50k, 0.2% for AGIs $50k-75k, 0.1% for AGIs $75k-100k, 0.1% for AGIs over 100k)
Self-employed pension: $17,333 (reported on 0.9% of returns)
Here:
$17,333
Indiana:
$15,305
Total itemized deductions: $20,061 (17% of AGI, reported on 35.4% of returns)
Here:
$20,061
State:
$17,065
Here:
17.1% of AGI
State:
19.5% of AGI
(% of AGI for various income ranges: 9.6% for AGIs below $10k, 7.5% for AGIs $10k-25k, 9.2% for AGIs $25k-50k, 11.0% for AGIs $50k-75k, 14.1% for AGIs $75k-100k, 13.0% for AGIs over 100k)
Charity contributions deductions: $3,968 (3% of AGI, reported on 29.7% of returns)
Here:
$3,968
State:
$3,550
Here:
3.1% of AGI
State:
3.8% of AGI
(% of AGI for various income ranges: 0.6% for AGIs below $10k, 0.9% for AGIs $10k-25k, 1.0% for AGIs $25k-50k, 1.3% for AGIs $50k-75k, 1.8% for AGIs $75k-100k, 2.7% for AGIs over 100k)
Total tax: $10,756 (reported on 77.9% of returns)
47396:
$10,756
State:
$6,914
(% of AGI for various income ranges: 3.3% for AGIs below $10k, 4.0% for AGIs $10k-25k, 6.8% for AGIs $25k-50k, 8.8% for AGIs $50k-75k, 10.5% for AGIs $75k-100k, 20.3% for AGIs over 100k)
Earned income credit: $1,517 (reported on 10.9% of returns)
Here:
$1,517
State:
$1,685
Percentage of individuals using paid preparers for their 2004 taxes: 59.0%
Here:
59%
State:
59%
(% for various income ranges: 47.8% for AGIs below $10k, 62.0% for AGIs $10k-25k, 60.5% for AGIs $25k-50k, 56.9% for AGIs $50k-75k, 55.5% for AGIs $75k-100k, 72.4% for AGIs over 100k)
Household received Food Stamps/SNAP in the past 12 months: 121 Household did not receive Food Stamps/SNAP in the past 12 months: 2,930
Women who did not have a birth in the past 12 months: 1,416 (870 now married, 550 unmarried)
Housing units in zip code 47396 with a mortgage: 1,962 (153 second mortgage, 135 both second mortgage and home equity loan) Houses without a mortgage: 160
Median monthly owner costs for units with a mortgage: $1,141 Median monthly owner costs for units without a mortgage: $433
Residents with income below the poverty level in 2022:
This zip code:
5.5%
Whole state:
12.6%
Residents with income below 50% of the poverty level in 2022:
This zip code:
2.7%
Whole state:
6.3%
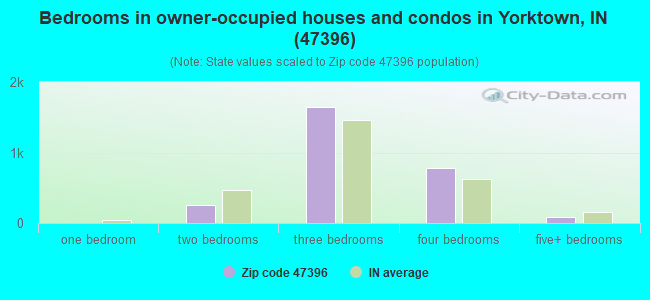
Median number of rooms in houses and condos:
Here:
6.7
State:
6.6
Median number of rooms in apartments:
Here:
5.5
State:
4.3
Notable locations in this zip code not listed on our city pages
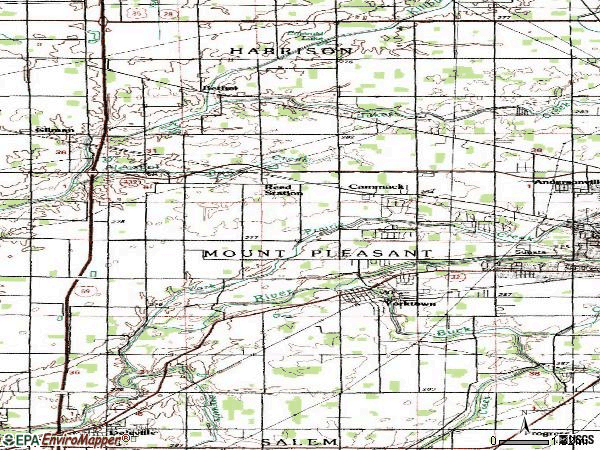
Streams, rivers, and creeks: Short Run (A), Water Run (B), York Prairie Creek (C), Jakes Creek (D), Reed Branch (E), Dry Branch (F), Mount Pleasant Branch (G), Buck Creek (H), Bethel Run (I). Display/hide their locations on the map
In group quarters: 83 (-1 institutionalized population)
Size of family households: 947 2-persons, 734 3-persons, 292 4-persons, 284 5-persons, 50 6-persons
Size of nonfamily households: 616 1-person, 133 2-persons
1,148 married couples with children.
447 single-parent households (81 men, 366 women).
97.0% of residents of 47396 zip code speak English at home.
1.5% of residents speak other Indo-European language at home (100% very well).
0.8% of residents speak Asian or Pacific Island language at home (25% very well, 75% well).
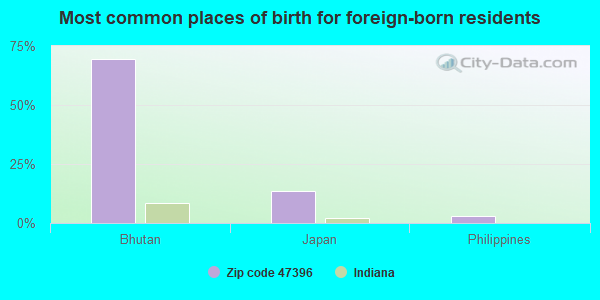
Foreign born population: 130 (1.7%) (91.8% of them are naturalized citizens)
This zip code:
1.7%
Whole state:
6.1%
69%Bhutan
13%Japan
3%Philippines
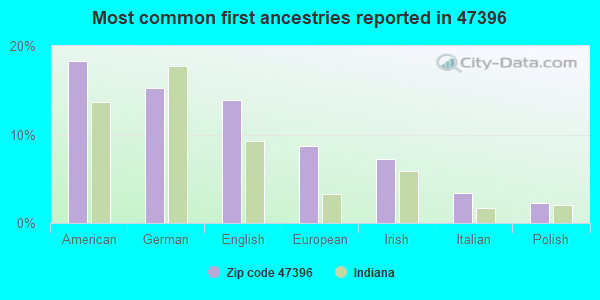
18%American
15%German
14%English
9%European
7%Irish
3%Italian
2%Polish
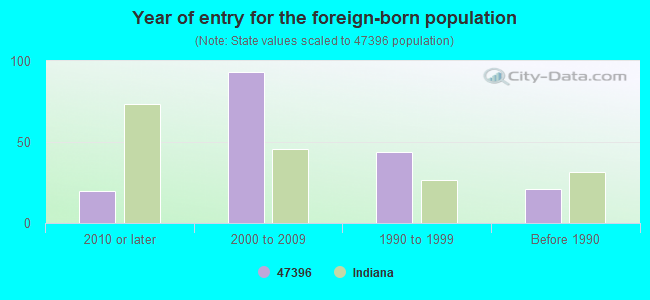
Year of entry for the foreign-born population
202010 or later
932000 to 2009
441990 to 1999
21Before 1990
Facilities with environmental interests located in this zip code:
MARSH SUPERMARKETS PRODUCE WAREHOUSE (2801 MARSH AVE in YORKTOWN, IN)
(Integrated Compliance Information System) - ICIS-05-1998-0189, FORMAL ENFORCEMENT ACTION STATE MASTER (Indiana facility tracking) - CRTK-6042, EPCRA (Resource Conservation and Recovery Act (tracking hazardous waste)) Business SIC classification: FARM PRODUCT WAREHOUSING AND STORAGE
MARSH SUPERMARKETS INC (9511 W DEPOT ST in YORKTOWN, IN)
STATE MASTER (Indiana facility tracking) - CRTK-6925, EPCRA, SPILL-199101136, RELEASE ASSESSMENT, UST-5968, UNDERGROUND STORAGE TANK PROGRAM COMPLIANCE ACTIVITY (Tracking inspections of insecticide, fungicide, and rodenticide, and toxic substances) National Pollutant Discharge Elimination System NON-MAJOR (Tracking pollutant discharge elimination systems) - permit Business SIC classification: GROCERY STORES Organizations: SCOTT W SCHUTTER 15184 (CONTACT/OPERATOR)
, MARSH YORKTOWN (CONTACT/OWNER)
Alternative names: MARSH - YORKTOWN
PLEASANT VIEW ELEMENTARY SCHOOL (9101 W RIVER RD in YORKTOWN, IN)
(Geographic Names Information System) (National Center for Education Statistics) - STATE ID-1395 Organizations: MT PLEASANT TWP COM SCH CORP (SCHOOL DISTRICT)
MT PLEASANT TWP SCHOOL CORP (8800 W SMITH ST in YORKTOWN, IN)
STATE MASTER (Indiana facility tracking) - CRTK-8113, EPCRA, LUST-198909500, LEAKING STORAGE TANK, SPILL-198909500, RELEASE ASSESSMENT, UST-20124, UNDERGROUND STORAGE TANK PROGRAM COMPLIANCE ACTIVITY (Tracking inspections of insecticide, fungicide, and rodenticide, and toxic substances) Alternative names: MT. PLEASANT TOWNSHIP COMM SCH CORP
MOUNT PLEASANT UTILITIES, LLC (SW CORNER OF S.R. 332 & I-69 in YORKTOWN, IN)
STATE MASTER (Indiana facility tracking) National Pollutant Discharge Elimination System NON-MAJOR (Tracking pollutant discharge elimination systems) - permit Business SIC classification: LAND SUBDIVIDERS AND DEVELOPERS, EXCEPT CEMETERIES Organizations: RANDY ROUSE 15340 (CONTACT/OPERATOR)
, MOUNT PLEASANT UTILITIES LLC (CONTACT/OWNER)
PRECISION ALLOYED CASTINGS INC (105 MILL ST in YORKTOWN, IN)
STATE MASTER (Indiana facility tracking) COMPLIANCE ACTIVITY (Tracking inspections of insecticide, fungicide, and rodenticide, and toxic substances) Business SIC classification: NONFERROUS FOUNDRIES, EXCEPT ALUMINUM AND COPPER
Housing units lacking complete plumbing facilities: 1.8% Housing units lacking complete kitchen facilities: 4.2%
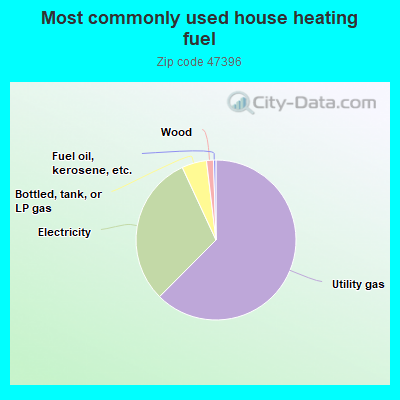
62.3%Utility gas
30.5%Electricity
5.0%Bottled, tank, or LP gas
1.4%Wood
0.5%Fuel oil, kerosene, etc.
Population in 1990: 5,027. Population change in the 1990s: +1,606 (+31.9%).
Place of birth for U.S.-born residents:
This state: 5,876
Northeast: 147
Midwest: 632
South: 359
West: 489
55% of the 47396 zip code residents lived in the same house 5 years ago. Out of people who lived in different houses, 75% lived in this county. Out of people who lived in different counties, 50% lived in Indiana.
87% of the 47396 zip code residents lived in the same house 1 year ago. Out of people who lived in different houses, 56% moved from this county. Out of people who lived in different houses, 17% moved from different county within same state. Out of people who lived in different houses, 26% moved from different state.
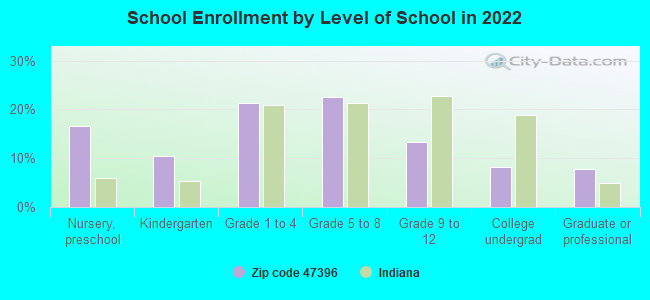
Private vs. public school enrollment:
Students in private schools in grades 1 to 8 (elementary and middle school):
Here:
0.0%
Indiana:
14.9%
Students in private schools in grades 9 to 12 (high school): 42
Here:
15.5%
Indiana:
11.4%
Students in private undergraduate colleges: 92
Here:
54.9%
Indiana:
22.3%
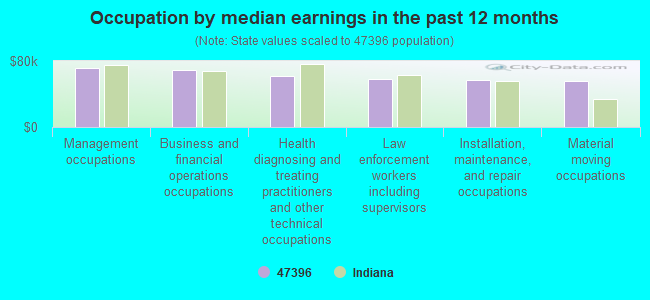
Occupation by median earnings in the past 12 months ($)
71,335Management occupations
69,029Business and financial operations occupations
61,255Health diagnosing and treating practitioners and other technical occupations
57,977Law enforcement workers including supervisors
56,569Installation, maintenance, and repair occupations
55,311Material moving occupations
Companies with federal contracts located in this zip code:
YORKTOWN PRECISION TECHNOLOGIE (2101 S WEST ST in YORKTOWN, IN; small business) : $83,794 in 2 contractsfrom 2000 to 2001
$50,850 with Defense Logistics Agency for Diesel Engines and Components. Signed on 2000-06-13. Completion date: 2000-09-05.
$32,944, same as above.Signed on 2001-07-24. Completion date: 2001-11-13.
Top industries in this zip code by the number of employees in 2005:
2002 - 2018 National Fire Incident Reporting System (NFIRS) incidents
Based on the data from the years 2002 - 2018 the average number of fires per year is 59. The highest number of fires - 96 took place in 2009, and the least - 11 in 2014. The data has an increasing trend.
When looking into fire subcategories, the most incidents belonged to: Structure Fires (42.7%), and Outside Fires (36.9%).
Fire incident types reported to NFIRS in Zip Code 47396


 Nearest zip codes: 47334, 47304, 46012, 47306, 47305, 47342.
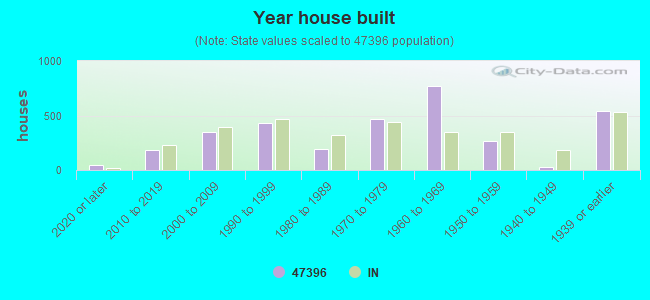


 Based on the data from the years 2002 - 2018 the average number of fires per year is 59. The highest number of fires - 96 took place in 2009, and the least - 11 in 2014. The data has an increasing trend.
 When looking into fire subcategories, the most incidents belonged to: Structure Fires (42.7%), and Outside Fires (36.9%).