Estimated zip code population in 2022: 9,512 Zip code population in 2010: 8,765 Zip code population in 2000: 9,092
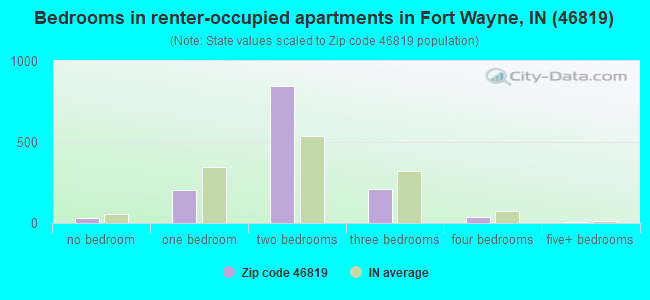
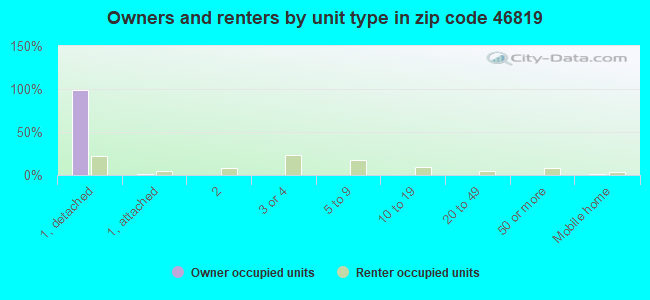
Houses and condos: 4,484 Renter-occupied apartments: 1,341
% of renters here:
31%
State:
29%
March 2022 cost of living index in zip code 46819: 82.9 (low, U.S. average is 100)
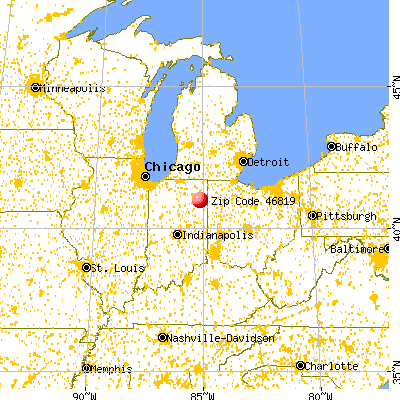
Land area: 25.6 sq. mi. Water area: 0.1 sq. mi.
Population density: 371 people per square mile
(very low).
OSM Map
General Map
Google Map
MSN Map
OSM Map
General Map
Google Map
MSN Map
OSM Map
General Map
Google Map
MSN Map
OSM Map
General Map
Google Map
MSN Map
Please wait while loading the map...
Real estate property taxes paid for housing units in 2022:
This zip code:
0.6% ($1,003)
Indiana:
0.7% ($1,467)
Median real estate property taxes paid for housing units with mortgages in 2022: $993 (0.6%) Median real estate property taxes paid for housing units with no mortgage in 2022: $1,086 (0.7%)
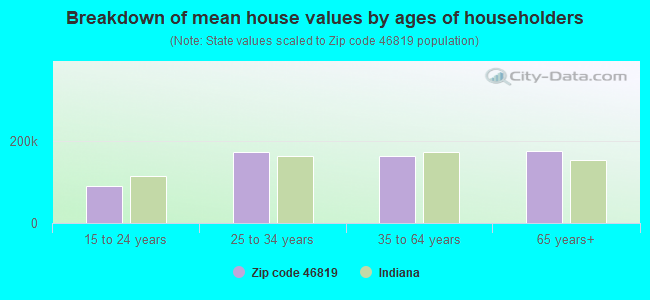
Estimated median house/condo value in 2022: $158,230
46819:
$158,230
Indiana:
$208,700
Median resident age:
This zip code:
42.2 years
Indiana median age:
38.2 years
Average household size:
This zip code:
2.2 people
Indiana:
2.4 people
Averages for the 2020 tax year for zip code 46819, filed in 2021:
Average Adjusted Gross Income (AGI) in 2020: $48,958 (Individual Income Tax Returns)
Here:
$48,958
State:
$64,978
Salary/wage: $42,396 (reported on 82.0% of returns)
Here:
$42,396
State:
$55,245
(% of AGI for various income ranges: 1060.1% for AGIs below $25k, 3533.1% for AGIs $25k-50k, 6421.6% for AGIs $50k-75k, 9501.0% for AGIs $75k-100k, 13843.7% for AGIs $100k-200k)
Taxable interest for individuals: $739 (reported on 24.2% of returns)
This zip code:
$739
Indiana:
$1,351
(% of AGI for various income ranges: 11.8% for AGIs below $25k, 10.2% for AGIs $25k-50k, 15.9% for AGIs $50k-75k, 53.8% for AGIs $75k-100k, 83.0% for AGIs $100k-200k)
Ordinary dividends: $3,312 (reported on 14.2% of returns)
Here:
$3,312
State:
$5,827
(% of AGI for various income ranges: 17.6% for AGIs below $25k, 24.9% for AGIs $25k-50k, 61.1% for AGIs $50k-75k, 132.8% for AGIs $75k-100k, 286.3% for AGIs $100k-200k)
Net capital gain/loss in AGI: +$6,065 (reported on 11.7% of returns)
Here:
+$6,065
State:
+$17,730
(% of AGI for various income ranges: 6.7% for AGIs below $25k, 40.9% for AGIs $25k-50k, 43.6% for AGIs $50k-75k, 121.7% for AGIs $75k-100k, 581.5% for AGIs $100k-200k)
Profit/loss from business: +$7,648 (reported on 9.7% of returns)
Here:
+$7,648
State:
+$12,144
(% of AGI for various income ranges: 53.0% for AGIs below $25k, 68.2% for AGIs $25k-50k, 109.8% for AGIs $50k-75k, 245.2% for AGIs $75k-100k, 261.1% for AGIs $100k-200k)
Taxable individual retirement arrangement distribution: $14,953 (reported on 10.0% of returns)
46819:
$14,953
Indiana:
$18,302
(% of AGI for various income ranges: 71.6% for AGIs below $25k, 78.5% for AGIs $25k-50k, 190.5% for AGIs $50k-75k, 402.1% for AGIs $75k-100k, 1094.8% for AGIs $100k-200k)
Total itemized deductions: $33,338 (reported on 2.8% of returns)
Here:
$33,338
State:
$35,601
(% of AGI for various income ranges: 106.7% for AGIs $25k-50k, 215.4% for AGIs $50k-75k, 668.5% for AGIs $100k-200k)
Charity contributions: $12,120 (reported on 2.1% of returns)
Here:
$12,120
State:
$15,596
(% of AGI for various income ranges: 16.1% for AGIs below $25k, 36.8% for AGIs $50k-75k, 300.4% for AGIs $100k-200k)
Taxes paid: $5,700 (reported on 2.8% of returns)
46819:
$5,700
State:
$7,542
(% of AGI for various income ranges: 9.9% for AGIs $25k-50k, 33.8% for AGIs $50k-75k, 158.9% for AGIs $100k-200k)
Earned income credit: $2,284 (reported on 18.0% of returns)
Here:
$2,284
State:
$2,298
(% of AGI for various income ranges: 87.2% for AGIs below $25k, 71.5% for AGIs $25k-50k)
Percentage of individuals using paid preparers for their 2020 taxes: 93.0%
Here:
93%
State:
94%
(% for various income ranges: 92.5% for AGIs below $25k, 93.4% for AGIs $25k-50k, 93.2% for AGIs $50k-75k, 95.2% for AGIs $75k-100k, 92.5% for AGIs $100k-200k, 80.0% for AGIs over 200k)
Averages for the 2012 tax year for zip code 46819, filed in 2013:
Average Adjusted Gross Income (AGI) in 2012: $41,606 (Individual Income Tax Returns)
Here:
$41,606
State:
$52,932
Salary/wage: $37,277 (reported on 81.7% of returns)
Here:
$37,277
State:
$45,173
(% of AGI for various income ranges: 68.1% for AGIs below $25k, 79.0% for AGIs $25k-50k, 78.8% for AGIs $50k-75k, 81.3% for AGIs $75k-100k, 75.2% for AGIs $100k-200k, 25.6% for AGIs over 200k)
Taxable interest for individuals: $981 (reported on 30.6% of returns)
This zip code:
$981
Indiana:
$1,311
(% of AGI for various income ranges: 1.2% for AGIs below $25k, 0.5% for AGIs $25k-50k, 0.5% for AGIs $50k-75k, 0.5% for AGIs $75k-100k, 1.1% for AGIs $100k-200k, 0.7% for AGIs over 200k)
Ordinary dividends: $2,365 (reported on 18.9% of returns)
Here:
$2,365
State:
$4,690
(% of AGI for various income ranges: 1.4% for AGIs below $25k, 0.7% for AGIs $25k-50k, 1.3% for AGIs $50k-75k, 0.8% for AGIs $75k-100k, 2.0% for AGIs $100k-200k)
Net capital gain/loss in AGI: +$2,144 (reported on 11.4% of returns)
Here:
+$2,144
State:
+$10,406
(% of AGI for various income ranges: 0.5% for AGIs $75k-100k, 3.0% for AGIs $100k-200k)
Profit/loss from business: +$6,270 (reported on 9.8% of returns)
Here:
+$6,270
State:
+$11,105
(% of AGI for various income ranges: 4.2% for AGIs below $25k, 1.2% for AGIs $25k-50k, 0.5% for AGIs $50k-75k, 0.9% for AGIs $75k-100k, 2.6% for AGIs $100k-200k)
Taxable individual retirement arrangement distribution: $10,707 (reported on 13.5% of returns)
46819:
$10,707
Indiana:
$13,841
(% of AGI for various income ranges: 4.3% for AGIs below $25k, 3.5% for AGIs $25k-50k, 3.1% for AGIs $50k-75k, 3.6% for AGIs $75k-100k, 4.8% for AGIs $100k-200k)
Total itemized deductions: $16,556 (22% of AGI, reported on 19.9% of returns)
Here:
$16,556
State:
$20,913
Here:
21.9% of AGI
State:
18.2% of AGI
(% of AGI for various income ranges: 6.8% for AGIs below $25k, 6.0% for AGIs $25k-50k, 7.6% for AGIs $50k-75k, 8.4% for AGIs $75k-100k, 11.4% for AGIs $100k-200k, 7.7% for AGIs over 200k)
Charity contributions: $4,325 (reported on 16.4% of returns)
Here:
$4,325
State:
$4,697
(% of AGI for various income ranges: 0.8% for AGIs below $25k, 1.0% for AGIs $25k-50k, 1.7% for AGIs $50k-75k, 1.8% for AGIs $75k-100k, 3.0% for AGIs $100k-200k, 2.4% for AGIs over 200k)
Taxes paid: $4,665 (reported on 19.6% of returns)
46819:
$4,665
State:
$7,456
(% of AGI for various income ranges: 0.8% for AGIs below $25k, 1.2% for AGIs $25k-50k, 1.9% for AGIs $50k-75k, 2.6% for AGIs $75k-100k, 4.2% for AGIs $100k-200k, 3.0% for AGIs over 200k)
Earned income credit: $2,214 (reported on 18.5% of returns)
Here:
$2,214
State:
$2,265
(% of AGI for various income ranges: 6.0% for AGIs below $25k, 1.0% for AGIs $25k-50k)
Percentage of individuals using paid preparers for their 2012 taxes: 46.8%
Here:
47%
State:
53%
(% for various income ranges: 43.2% for AGIs below $25k, 44.5% for AGIs $25k-50k, 51.6% for AGIs $50k-75k, 53.8% for AGIs $75k-100k, 56.5% for AGIs $100k-200k, 100.0% for AGIs over 200k)
Averages for the 2004 tax year for zip code 46819, filed in 2005:
Average Adjusted Gross Income (AGI) in 2004: $37,899 (Individual Income Tax Returns)
Here:
$37,899
State:
$44,790
Salary/wage: $34,681 (reported on 85.6% of returns)
Here:
$34,681
State:
$39,615
(% of AGI for various income ranges: 87.4% for AGIs below $10k, 75.4% for AGIs $10k-25k, 83.6% for AGIs $25k-50k, 84.7% for AGIs $50k-75k, 85.2% for AGIs $75k-100k, 56.2% for AGIs over 100k)
Taxable interest for individuals: $1,378 (reported on 44.7% of returns)
This zip code:
$1,378
Indiana:
$1,535
(% of AGI for various income ranges: 5.7% for AGIs below $10k, 2.1% for AGIs $10k-25k, 1.6% for AGIs $25k-50k, 1.2% for AGIs $50k-75k, 0.8% for AGIs $75k-100k, 2.3% for AGIs over 100k)
Taxable dividends: $2,152 (reported on 23.8% of returns)
Here:
$2,152
State:
$2,998
(% of AGI for various income ranges: 3.8% for AGIs below $10k, 1.8% for AGIs $10k-25k, 1.0% for AGIs $25k-50k, 1.1% for AGIs $50k-75k, 0.8% for AGIs $75k-100k, 2.3% for AGIs over 100k)
Net capital gain/loss: +$3,568 (reported on 17.0% of returns)
Here:
+$3,568
State:
+$8,619
(% of AGI for various income ranges: -1.4% for AGIs below $10k, 0.1% for AGIs $10k-25k, 0.2% for AGIs $25k-50k, 1.1% for AGIs $50k-75k, 1.4% for AGIs $75k-100k, 5.9% for AGIs over 100k)
Profit/loss from business: +$6,648 (reported on 10.2% of returns)
Here:
+$6,648
State:
+$10,071
(% of AGI for various income ranges: 4.6% for AGIs below $10k, 1.7% for AGIs $10k-25k, 1.9% for AGIs $25k-50k, 1.6% for AGIs $50k-75k, 2.3% for AGIs $75k-100k, 1.3% for AGIs over 100k)
IRA payment deduction: $2,579 (reported on 2.7% of returns)
46819:
$2,579
Indiana:
$2,840
(% of AGI for various income ranges: 0.2% for AGIs $10k-25k, 0.3% for AGIs $25k-50k, 0.1% for AGIs $50k-75k, 0.2% for AGIs $75k-100k)
Total itemized deductions: $14,549 (22% of AGI, reported on 28.1% of returns)
Here:
$14,549
State:
$17,065
Here:
21.9% of AGI
State:
19.5% of AGI
(% of AGI for various income ranges: 15.2% for AGIs below $10k, 7.3% for AGIs $10k-25k, 9.4% for AGIs $25k-50k, 11.7% for AGIs $50k-75k, 12.7% for AGIs $75k-100k, 11.3% for AGIs over 100k)
Charity contributions deductions: $3,523 (5% of AGI, reported on 24.3% of returns)
Here:
$3,523
State:
$3,550
Here:
5.1% of AGI
State:
3.8% of AGI
(% of AGI for various income ranges: 0.9% for AGIs below $10k, 1.2% for AGIs $10k-25k, 1.7% for AGIs $25k-50k, 2.1% for AGIs $50k-75k, 3.1% for AGIs $75k-100k, 3.4% for AGIs over 100k)
Total tax: $4,794 (reported on 73.5% of returns)
46819:
$4,794
State:
$6,914
(% of AGI for various income ranges: 2.0% for AGIs below $10k, 3.5% for AGIs $10k-25k, 6.6% for AGIs $25k-50k, 8.5% for AGIs $50k-75k, 10.6% for AGIs $75k-100k, 17.8% for AGIs over 100k)
Earned income credit: $1,639 (reported on 14.8% of returns)
Here:
$1,639
State:
$1,685
Percentage of individuals using paid preparers for their 2004 taxes: 53.7%
Here:
54%
State:
59%
(% for various income ranges: 45.9% for AGIs below $10k, 55.1% for AGIs $10k-25k, 53.9% for AGIs $25k-50k, 55.0% for AGIs $50k-75k, 56.9% for AGIs $75k-100k, 69.0% for AGIs over 100k)
Likely homosexual households (counted as self-reported same-sex unmarried-partner households)
Lesbian couples: 0.4% of all households
Gay men: 0.0% of all households
Household received Food Stamps/SNAP in the past 12 months: 472 Household did not receive Food Stamps/SNAP in the past 12 months: 3,790
Women who had a birth in the past 12 months: 99 (66 now married, 32 unmarried) Women who did not have a birth in the past 12 months: 1,963 (709 now married, 1,251 unmarried)
Housing units in zip code 46819 with a mortgage: 1,842 (161 second mortgage, 4 home equity loan, 112 both second mortgage and home equity loan) Houses without a mortgage: 52
Median monthly owner costs for units with a mortgage: $962 Median monthly owner costs for units without a mortgage: $456
Residents with income below the poverty level in 2022:
This zip code:
12.0%
Whole state:
12.6%
Residents with income below 50% of the poverty level in 2022:
This zip code:
5.8%
Whole state:
6.3%
Median number of rooms in houses and condos:
Here:
6.5
State:
6.6
Median number of rooms in apartments:
Here:
4.1
State:
4.3
Notable locations in this zip code not listed on our city pages
Notable locations in zip code 46819: Fort Wayne Fire Department Station 5 (A), Poe Community Volunteer Fire Department (B). Display/hide their locations on the map
In group quarters: 66 (-1 institutionalized population)
Size of family households: 1,347 2-persons, 538 3-persons, 448 4-persons, 241 5-persons, 29 6-persons, 42 7-or-more-persons
Size of nonfamily households: 1,370 1-person, 234 2-persons, 9 3-persons
1,136 married couples with children.
664 single-parent households (82 men, 582 women).
88.8% of residents of 46819 zip code speak English at home.
7.7% of residents speak Spanish at home (71% very well, 15% well, 10% not well, 4% not at all).
2.5% of residents speak other Indo-European language at home (91% very well, 9% well).
0.7% of residents speak Asian or Pacific Island language at home (100% well).
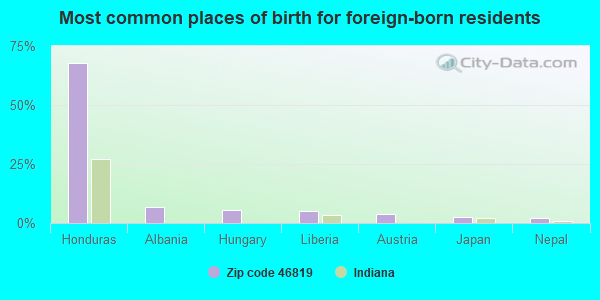
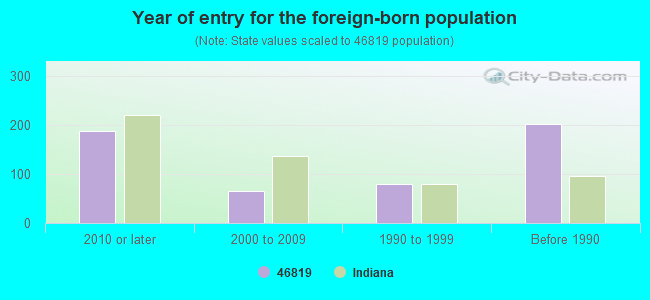
Foreign born population: 553 (5.8%) (61.6% of them are naturalized citizens)
Facilities with environmental interests located in this zip code:
MIAMI MIDDLE SCHOOL (8100 AMHERST DR in FT WAYNE, IN)
STATE MASTER (Indiana facility tracking) (National Center for Education Statistics) - STATE ID-0128 (Resource Conservation and Recovery Act (tracking hazardous waste)) Organizations: FT WAYNE COMMUNITY SCHOOLS (CONTACT/OWNER)
, FORT WAYNE COMMUNITY SCHOOLS (SCHOOL DISTRICT)
OTTS MARATHON SERVICE STATION (433 LOWER HUNTINGTON RD in FORT WAYNE, IN)
STATE MASTER (Indiana facility tracking) - CRTK-9445, EPCRA, LUST-199501517, LEAKING STORAGE TANK, UST-5466, UNDERGROUND STORAGE TANK PROGRAM (Resource Conservation and Recovery Act (tracking hazardous waste)) Organizations: OTT GARRETT (CONTACT/OWNER)
LOBRILLO ANTHONY (7701 BLUFFTON RD in FT WAYNE, IN)
STATE MASTER (Indiana facility tracking) - LUST-199302512, LEAKING STORAGE TANK, UST-18497, UNDERGROUND STORAGE TANK PROGRAM (Resource Conservation and Recovery Act (tracking hazardous waste)) Alternative names: ANTHONY LOBRILLO, BASTIAN MATERIAL HANDLING
PLEASANT CENTER ELEMENTARY SCHOOL (2323 PLEASANT CENTER RD in FORT WAYNE, IN)
STATE MASTER (Indiana facility tracking) (National Center for Education Statistics) - STATE ID-0077 Organizations: FORT WAYNE COMMUNITY SCHOOLS (SCHOOL DISTRICT)
MAPLEWOOD ELEMENTARY SCHOOL (2200 MAPLEWOOD RD in FORT WAYNE, IN)
(Geographic Names Information System) (National Center for Education Statistics) - STATE ID-0205 Organizations: FORT WAYNE COMMUNITY SCHOOLS (SCHOOL DISTRICT)
AIR RIDE CORP (BLDG 79 FERGUSON RD in FORT WAYNE, IN)
STATE MASTER (Indiana facility tracking) (Resource Conservation and Recovery Act (tracking hazardous waste)) Organizations: MACKEY AL AND STEVE SAPP (CONTACT/OWNER)
DIDIER PRINTING (613 HIGH ST in FORT WAYNE, IN)
STATE MASTER (Indiana facility tracking) (Resource Conservation and Recovery Act (tracking hazardous waste))
BROOKS CONSTRUCTION CO., INC. (5536 HOAGLAND ROAD in POE, IN)
AIR SYNTHETIC MINOR (AIRS/AFS) STATE MASTER (Indiana facility tracking) Business SIC classification: ASPHALT PAVING MIXTURES AND BLOCKS
Housing units lacking complete plumbing facilities: 0.9% Housing units lacking complete kitchen facilities: 1.9%
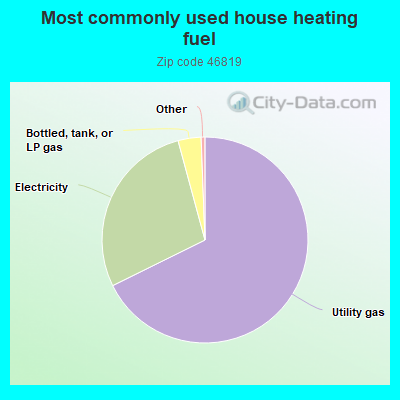
67.7%Utility gas
28.1%Electricity
3.6%Bottled, tank, or LP gas
Population in 1990: 9,139.
Place of birth for U.S.-born residents:
This state: 6,717
Northeast: 249
Midwest: 1,278
South: 523
West: 188
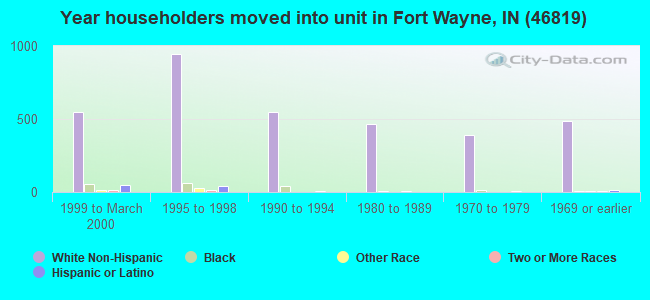
56% of the 46819 zip code residents lived in the same house 5 years ago. Out of people who lived in different houses, 74% lived in this county. Out of people who lived in different counties, 50% lived in Indiana.
92% of the 46819 zip code residents lived in the same house 1 year ago. Out of people who lived in different houses, 57% moved from this county. Out of people who lived in different houses, 18% moved from different county within same state. Out of people who lived in different houses, 22% moved from different state. Out of people who lived in different houses, 4% moved from abroad.
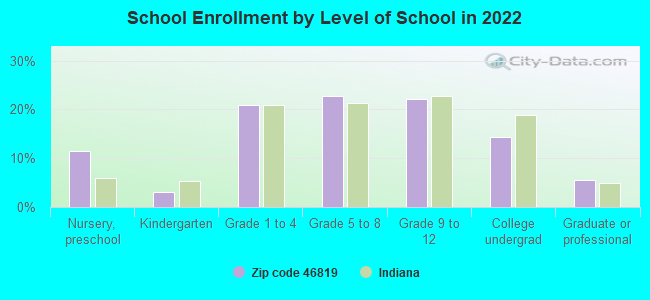
Private vs. public school enrollment:
Students in private schools in grades 1 to 8 (elementary and middle school): 240
Here:
28.4%
Indiana:
14.9%
Students in private schools in grades 9 to 12 (high school): 158
Here:
36.6%
Indiana:
11.4%
Students in private undergraduate colleges: 64
Here:
23.5%
Indiana:
22.3%
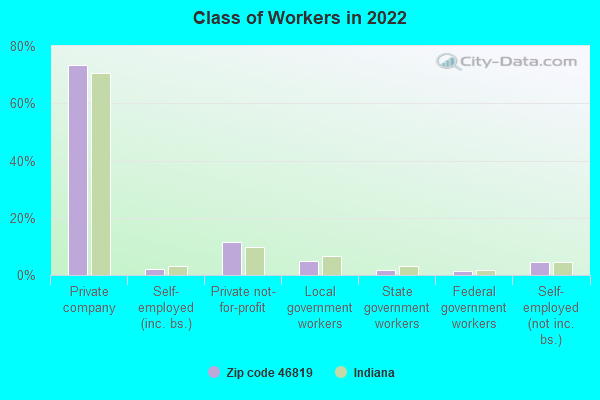
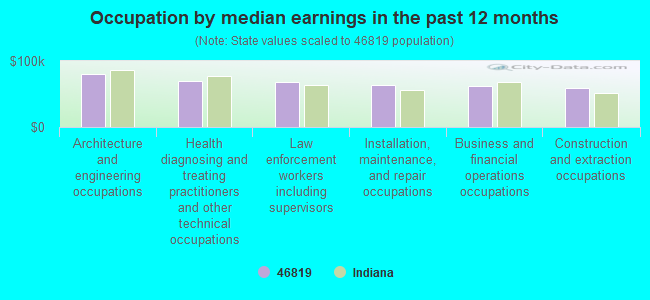
Occupation by median earnings in the past 12 months ($)
80,907Architecture and engineering occupations
69,219Health diagnosing and treating practitioners and other technical occupations
67,761Law enforcement workers including supervisors
63,368Installation, maintenance, and repair occupations
62,246Business and financial operations occupations
59,204Construction and extraction occupations
Top industries in this zip code by the number of employees in 2005:
Health Care and Social Assistance: Nursing Care Facilities (50-99 employees: 2 establishments)
Accommodation and Food Services: Full-Service Restaurants (50-99: 1, 5-9: 1)
Information: Radio Stations (50-99: 1)
Administrative and Support and Waste Management and Remediation Services: Landscaping Services (20-49: 1, 10-19: 2)
Other Services (except Public Administration): Religious Organizations (10-19: 2, 5-9: 3, 1-4: 2)
Administrative and Support and Waste Management and Remediation Services: Armored Car Services (20-49: 1, 5-9: 1)
Health Care and Social Assistance: Offices of Physical, Occupational and Speech Therapists, and Audiologists (20-49: 1)
Health Care and Social Assistance: Continuing Care Retirement Communities (20-49: 1)
Finance and Insurance: Commercial Banking (20-49: 1)
People in group quarters in 2010:
45 people in nursing facilities/skilled-nursing facilities
People in group quarters in 2000:
63 people in nursing homes
2 people in religious group quarters
Fatal accident statistics in 2013:
Fatal accident count: 1
Vehicles involved in fatal accidents: 1
Fatal accidents caused by drunken drivers: 1
Fatalities: 1
Persons involved in fatal accidents: 2
Pedestrians involved in fatal accidents: 0
Fatal accident statistics in 2012:
Fatal accident count: 1
Vehicles involved in fatal accidents: 2
Fatal accidents caused by drunken drivers: 1
Fatalities: 1
Persons involved in fatal accidents: 2
Pedestrians involved in fatal accidents: 0
Home Mortgage Disclosure Act Aggregated Statistics For Year 2009 (Based on 4 full and 4 partial tracts)
A) FHA, FSA/RHS & VA Home Purchase Loans
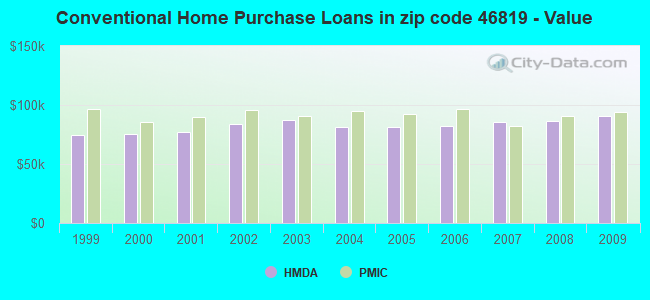
B) Conventional Home Purchase Loans
C) Refinancings
D) Home Improvement Loans
F) Non-occupant Loans on < 5 Family Dwellings (A B C & D)
G) Loans On Manufactured Home Dwelling (A B C & D)
Number
Average Value
Number
Average Value
Number
Average Value
Number
Average Value
Number
Average Value
Number
Average Value
LOANS ORIGINATED
88
$87,915
46
$90,828
306
$93,853
16
$49,737
6
$70,503
3
$25,390
APPLICATIONS APPROVED, NOT ACCEPTED
11
$87,027
7
$79,363
20
$76,418
6
$44,460
0
$0
2
$24,850
APPLICATIONS DENIED
15
$76,231
4
$83,902
90
$96,998
14
$21,509
2
$34,645
0
$0
APPLICATIONS WITHDRAWN
9
$80,353
2
$139,185
91
$97,745
5
$82,034
3
$65,850
0
$0
FILES CLOSED FOR INCOMPLETENESS
2
$70,125
1
$94,980
36
$100,436
0
$0
0
$0
2
$62,460
Aggregated Statistics For Year 2008 (Based on 4 full and 4 partial tracts)
A) FHA, FSA/RHS & VA Home Purchase Loans
B) Conventional Home Purchase Loans
C) Refinancings
D) Home Improvement Loans
F) Non-occupant Loans on < 5 Family Dwellings (A B C & D)
G) Loans On Manufactured Home Dwelling (A B C & D)
Number
Average Value
Number
Average Value
Number
Average Value
Number
Average Value
Number
Average Value
Number
Average Value
LOANS ORIGINATED
95
$97,569
76
$86,202
154
$113,833
32
$20,765
6
$386,857
0
$0
APPLICATIONS APPROVED, NOT ACCEPTED
1
$55,480
6
$90,465
19
$98,065
11
$9,893
2
$72,215
1
$68,510
APPLICATIONS DENIED
18
$90,442
18
$68,602
124
$94,147
46
$25,099
2
$70,460
3
$36,213
APPLICATIONS WITHDRAWN
9
$76,084
7
$76,753
67
$98,712
12
$55,029
0
$0
0
$0
FILES CLOSED FOR INCOMPLETENESS
3
$128,073
4
$97,590
21
$95,424
0
$0
0
$0
0
$0
Aggregated Statistics For Year 2007 (Based on 4 full and 4 partial tracts)
A) FHA, FSA/RHS & VA Home Purchase Loans
B) Conventional Home Purchase Loans
C) Refinancings
D) Home Improvement Loans
E) Loans on Dwellings For 5+ Families
F) Non-occupant Loans on < 5 Family Dwellings (A B C & D)
G) Loans On Manufactured Home Dwelling (A B C & D)
Number
Average Value
Number
Average Value
Number
Average Value
Number
Average Value
Number
Average Value
Number
Average Value
Number
Average Value
LOANS ORIGINATED
40
$113,060
184
$85,974
146
$92,426
35
$32,245
2
$4,059,745
20
$62,630
1
$54,700
APPLICATIONS APPROVED, NOT ACCEPTED
2
$92,710
20
$78,101
39
$80,376
12
$26,978
0
$0
4
$38,548
0
$0
APPLICATIONS DENIED
13
$136,206
60
$90,449
182
$93,685
44
$13,889
0
$0
3
$97,637
1
$82,770
APPLICATIONS WITHDRAWN
7
$90,897
16
$126,223
79
$93,823
6
$54,148
0
$0
4
$107,785
1
$104,380
FILES CLOSED FOR INCOMPLETENESS
0
$0
8
$93,118
39
$105,322
0
$0
0
$0
2
$81,000
0
$0
Aggregated Statistics For Year 2006 (Based on 4 full and 4 partial tracts)
A) FHA, FSA/RHS & VA Home Purchase Loans
B) Conventional Home Purchase Loans
C) Refinancings
D) Home Improvement Loans
E) Loans on Dwellings For 5+ Families
F) Non-occupant Loans on < 5 Family Dwellings (A B C & D)
G) Loans On Manufactured Home Dwelling (A B C & D)
Number
Average Value
Number
Average Value
Number
Average Value
Number
Average Value
Number
Average Value
Number
Average Value
Number
Average Value
LOANS ORIGINATED
57
$105,482
270
$82,107
220
$74,263
69
$21,203
2
$12,452,485
18
$61,907
1
$22,280
APPLICATIONS APPROVED, NOT ACCEPTED
3
$110,903
19
$106,007
59
$78,867
11
$48,145
0
$0
0
$0
0
$0
APPLICATIONS DENIED
5
$120,022
62
$76,110
172
$84,102
46
$26,687
0
$0
9
$59,314
6
$32,823
APPLICATIONS WITHDRAWN
0
$0
13
$69,332
110
$93,813
11
$47,767
0
$0
0
$0
0
$0
FILES CLOSED FOR INCOMPLETENESS
2
$82,950
21
$73,120
25
$96,138
0
$0
0
$0
0
$0
0
$0
Aggregated Statistics For Year 2005 (Based on 4 full and 4 partial tracts)
A) FHA, FSA/RHS & VA Home Purchase Loans
B) Conventional Home Purchase Loans
C) Refinancings
D) Home Improvement Loans
F) Non-occupant Loans on < 5 Family Dwellings (A B C & D)
G) Loans On Manufactured Home Dwelling (A B C & D)
Number
Average Value
Number
Average Value
Number
Average Value
Number
Average Value
Number
Average Value
Number
Average Value
LOANS ORIGINATED
58
$100,878
250
$80,953
253
$83,194
22
$34,335
20
$56,365
3
$83,850
APPLICATIONS APPROVED, NOT ACCEPTED
6
$93,603
37
$73,459
94
$92,819
9
$32,521
4
$79,370
2
$90,070
APPLICATIONS DENIED
4
$93,692
64
$77,060
216
$90,227
44
$23,398
11
$35,560
4
$42,518
APPLICATIONS WITHDRAWN
4
$97,648
26
$89,010
169
$110,927
12
$132,528
2
$63,005
0
$0
FILES CLOSED FOR INCOMPLETENESS
3
$84,277
10
$81,713
45
$96,186
2
$29,275
0
$0
1
$165,300
Aggregated Statistics For Year 2004 (Based on 4 full and 4 partial tracts)
A) FHA, FSA/RHS & VA Home Purchase Loans
B) Conventional Home Purchase Loans
C) Refinancings
D) Home Improvement Loans
E) Loans on Dwellings For 5+ Families
F) Non-occupant Loans on < 5 Family Dwellings (A B C & D)
G) Loans On Manufactured Home Dwelling (A B C & D)
Number
Average Value
Number
Average Value
Number
Average Value
Number
Average Value
Number
Average Value
Number
Average Value
Number
Average Value
LOANS ORIGINATED
52
$86,554
158
$81,210
318
$85,310
43
$32,473
2
$1,389,780
25
$57,425
14
$44,464
APPLICATIONS APPROVED, NOT ACCEPTED
1
$70,530
17
$71,894
56
$107,668
8
$64,842
0
$0
4
$64,787
6
$110,822
APPLICATIONS DENIED
8
$77,738
58
$75,061
240
$90,796
46
$22,977
0
$0
2
$37,615
14
$27,337
APPLICATIONS WITHDRAWN
0
$0
11
$73,659
140
$93,476
5
$31,636
0
$0
0
$0
1
$70,530
FILES CLOSED FOR INCOMPLETENESS
5
$92,844
9
$94,686
30
$98,825
0
$0
0
$0
0
$0
0
$0
Aggregated Statistics For Year 2003 (Based on 4 full and 4 partial tracts)
A) FHA, FSA/RHS & VA Home Purchase Loans
B) Conventional Home Purchase Loans
C) Refinancings
D) Home Improvement Loans
F) Non-occupant Loans on < 5 Family Dwellings (A B C & D)
Number
Average Value
Number
Average Value
Number
Average Value
Number
Average Value
Number
Average Value
LOANS ORIGINATED
58
$88,226
155
$87,569
758
$83,703
35
$18,388
36
$74,631
APPLICATIONS APPROVED, NOT ACCEPTED
4
$97,590
18
$78,436
80
$87,877
11
$19,985
3
$48,273
APPLICATIONS DENIED
10
$108,382
19
$71,049
225
$88,379
27
$12,682
3
$48,273
APPLICATIONS WITHDRAWN
5
$129,676
8
$94,678
146
$82,009
1
$17,870
3
$43,743
FILES CLOSED FOR INCOMPLETENESS
3
$67,993
5
$82,344
22
$94,997
1
$92,160
0
$0
Aggregated Statistics For Year 2002 (Based on 4 full and 4 partial tracts)
A) FHA, FSA/RHS & VA Home Purchase Loans
B) Conventional Home Purchase Loans
C) Refinancings
D) Home Improvement Loans
F) Non-occupant Loans on < 5 Family Dwellings (A B C & D)
Number
Average Value
Number
Average Value
Number
Average Value
Number
Average Value
Number
Average Value
LOANS ORIGINATED
82
$86,555
156
$83,733
572
$82,635
38
$21,826
13
$44,614
APPLICATIONS APPROVED, NOT ACCEPTED
5
$109,482
7
$81,887
85
$88,819
3
$12,007
4
$105,398
APPLICATIONS DENIED
12
$81,163
15
$87,906
200
$80,045
35
$11,101
4
$37,012
APPLICATIONS WITHDRAWN
2
$120,070
15
$97,466
82
$75,191
6
$9,503
0
$0
FILES CLOSED FOR INCOMPLETENESS
1
$94,040
3
$56,843
51
$88,773
0
$0
1
$83,700
Aggregated Statistics For Year 2001 (Based on 4 full and 4 partial tracts)
A) FHA, FSA/RHS & VA Home Purchase Loans
B) Conventional Home Purchase Loans
C) Refinancings
D) Home Improvement Loans
F) Non-occupant Loans on < 5 Family Dwellings (A B C & D)
Number
Average Value
Number
Average Value
Number
Average Value
Number
Average Value
Number
Average Value
LOANS ORIGINATED
83
$87,077
126
$76,701
484
$73,929
61
$12,626
13
$44,760
APPLICATIONS APPROVED, NOT ACCEPTED
4
$103,402
26
$62,208
84
$61,917
18
$18,148
2
$24,400
APPLICATIONS DENIED
7
$78,266
40
$41,110
249
$68,209
31
$11,388
5
$46,992
APPLICATIONS WITHDRAWN
2
$67,635
15
$79,111
79
$79,124
9
$51,467
2
$48,795
FILES CLOSED FOR INCOMPLETENESS
1
$36,680
2
$53,135
21
$83,548
0
$0
0
$0
Aggregated Statistics For Year 2000 (Based on 4 full and 4 partial tracts)
A) FHA, FSA/RHS & VA Home Purchase Loans
B) Conventional Home Purchase Loans
C) Refinancings
D) Home Improvement Loans
F) Non-occupant Loans on < 5 Family Dwellings (A B C & D)
Number
Average Value
Number
Average Value
Number
Average Value
Number
Average Value
Number
Average Value
LOANS ORIGINATED
76
$87,413
170
$75,670
182
$56,462
62
$12,338
10
$51,089
APPLICATIONS APPROVED, NOT ACCEPTED
5
$85,074
23
$64,244
46
$54,642
18
$22,619
12
$32,319
APPLICATIONS DENIED
8
$96,828
80
$41,798
104
$47,035
38
$16,109
4
$34,360
APPLICATIONS WITHDRAWN
4
$102,470
5
$46,338
60
$60,268
3
$7,303
2
$71,475
FILES CLOSED FOR INCOMPLETENESS
0
$0
7
$61,387
10
$50,616
0
$0
0
$0
Aggregated Statistics For Year 1999 (Based on 2 full and 2 partial tracts)
A) FHA, FSA/RHS & VA Home Purchase Loans
B) Conventional Home Purchase Loans
C) Refinancings
D) Home Improvement Loans
F) Non-occupant Loans on < 5 Family Dwellings (A B C & D)
2002 - 2018 National Fire Incident Reporting System (NFIRS) incidents
Based on the data from the years 2002 - 2018 the average number of fires per year is 26. The highest number of reported fires - 60 took place in 2005, and the least - 3 in 2014. The data has a declining trend.
When looking into fire subcategories, the most reports belonged to: Outside Fires (36.9%), and Structure Fires (34.8%).
Fire incident types reported to NFIRS in Zip Code 46819


 Nearest zip codes: 46807, 46809, 46806, 46798, 46802, 46816.


 Based on the data from the years 2002 - 2018 the average number of fires per year is 26. The highest number of reported fires - 60 took place in 2005, and the least - 3 in 2014. The data has a declining trend.
 When looking into fire subcategories, the most reports belonged to: Outside Fires (36.9%), and Structure Fires (34.8%).