Averages for the 2020 tax year for zip code 45433, filed in 2021:
Average Adjusted Gross Income (AGI) in 2020: $55,382 (Individual Income Tax Returns)
Here:
$55,382
State:
$67,288
Salary/wage: $50,441 (reported on 97.1% of returns)
Here:
$50,441
State:
$55,628
(% of AGI for various income ranges: 1726.7% for AGIs below $25k, 3514.7% for AGIs $25k-50k, 6456.2% for AGIs $50k-75k, 9208.0% for AGIs $75k-100k, 23510.0% for AGIs $100k-200k)
Taxable interest for individuals: $413 (reported on 22.1% of returns)
This zip code:
$413
Ohio:
$1,518
(% of AGI for various income ranges: 2.7% for AGIs $25k-50k, 7.5% for AGIs $50k-75k, 6.0% for AGIs $75k-100k, 81.7% for AGIs $100k-200k)
Ordinary dividends: $1,644 (reported on 13.2% of returns)
Here:
$1,644
State:
$7,167
(% of AGI for various income ranges: 2.9% for AGIs below $25k, 10.0% for AGIs $50k-75k, 221.7% for AGIs $100k-200k)
Net capital gain/loss in AGI: +$5,180 (reported on 14.7% of returns)
Here:
+$5,180
State:
+$18,919
(% of AGI for various income ranges: 0.8% for AGIs below $25k, 23.8% for AGIs $50k-75k, 828.3% for AGIs $100k-200k)
Profit/loss from business: +$725 (reported on 5.9% of returns)
Here:
+$725
State:
+$13,744
(% of AGI for various income ranges: 19.3% for AGIs $25k-50k)
Earned income credit: $1,725 (reported on 11.8% of returns)
Here:
$1,725
State:
$2,304
(% of AGI for various income ranges: 14.6% for AGIs below $25k, 68.7% for AGIs $25k-50k)
Percentage of individuals using paid preparers for their 2020 taxes: 97.1%
Here:
97%
State:
94%
(% for various income ranges: 96.2% for AGIs below $25k, 100.0% for AGIs $25k-50k, 100.0% for AGIs $50k-75k, 100.0% for AGIs $75k-100k, 90.9% for AGIs $100k-200k)
Averages for the 2012 tax year for zip code 45433, filed in 2013:
Average Adjusted Gross Income (AGI) in 2012: $48,444 (Individual Income Tax Returns)
Here:
$48,444
State:
$54,926
Salary/wage: $45,171 (reported on 98.6% of returns)
Here:
$45,171
State:
$45,869
(% of AGI for various income ranges: 96.4% for AGIs below $25k, 94.6% for AGIs $25k-50k, 93.8% for AGIs $50k-75k, 93.6% for AGIs $75k-100k, 88.2% for AGIs $100k-200k)
Taxable interest for individuals: $260 (reported on 27.4% of returns)
This zip code:
$260
Ohio:
$1,297
(% of AGI for various income ranges: 0.1% for AGIs $25k-50k, 0.1% for AGIs $50k-75k, 0.2% for AGIs $75k-100k, 0.2% for AGIs $100k-200k)
Ordinary dividends: $1,782 (reported on 15.1% of returns)
Here:
$1,782
State:
$5,821
(% of AGI for various income ranges: 0.6% for AGIs $50k-75k, 1.1% for AGIs $100k-200k)
Net capital gain/loss in AGI: +$743 (reported on 9.6% of returns)
Here:
+$743
State:
+$11,232
(% of AGI for various income ranges: 0.4% for AGIs $100k-200k)
Profit/loss from business: +$200 (reported on 4.1% of returns)
Here:
+$200
State:
+$12,773
(% of AGI for various income ranges: 0.1% for AGIs $25k-50k)
Total itemized deductions: $22,644 (20% of AGI, reported on 12.3% of returns)
Here:
$22,644
State:
$21,278
Here:
20.1% of AGI
State:
18.8% of AGI
(% of AGI for various income ranges: 17.4% for AGIs $50k-75k, 7.6% for AGIs $100k-200k)
Charity contributions: $5,550 (reported on 11.0% of returns)
Here:
$5,550
State:
$3,943
(% of AGI for various income ranges: 3.0% for AGIs $50k-75k, 1.9% for AGIs $100k-200k)
Taxes paid: $6,078 (reported on 12.3% of returns)
45433:
$6,078
State:
$9,568
(% of AGI for various income ranges: 3.3% for AGIs $50k-75k, 2.6% for AGIs $100k-200k)
Earned income credit: $2,480 (reported on 13.7% of returns)
Here:
$2,480
State:
$2,285
(% of AGI for various income ranges: 1.9% for AGIs below $25k, 2.8% for AGIs $25k-50k)
Percentage of individuals using paid preparers for their 2012 taxes: 26.0%
Here:
26%
State:
51%
(% for various income ranges: 18.2% for AGIs below $25k, 26.7% for AGIs $25k-50k, 55.6% for AGIs $50k-75k, 0.0% for AGIs $75k-100k, 40.0% for AGIs $100k-200k)
Averages for the 2004 tax year for zip code 45433, filed in 2005:
Average Adjusted Gross Income (AGI) in 2004: $43,150 (Individual Income Tax Returns)
Here:
$43,150
State:
$44,480
Salary/wage: $42,314 (reported on 99.1% of returns)
Here:
$42,314
State:
$39,198
(% of AGI for various income ranges: 97.9% for AGIs below $10k, 100.1% for AGIs $10k-25k, 100.4% for AGIs $25k-50k, 97.9% for AGIs $50k-75k, 97.8% for AGIs $75k-100k, 90.7% for AGIs over 100k)
Taxable interest for individuals: $337 (reported on 41.7% of returns)
This zip code:
$337
Ohio:
$1,532
(% of AGI for various income ranges: 0.2% for AGIs below $10k, 0.0% for AGIs $10k-25k, 0.1% for AGIs $25k-50k, 0.2% for AGIs $50k-75k, 0.4% for AGIs $75k-100k, 0.8% for AGIs over 100k)
Taxable dividends: $1,287 (reported on 23.2% of returns)
Here:
$1,287
State:
$3,496
(% of AGI for various income ranges: 1.0% for AGIs below $10k, 0.1% for AGIs $25k-50k, 0.2% for AGIs $50k-75k, 1.1% for AGIs $75k-100k, 1.9% for AGIs over 100k)
Net capital gain/loss: +$2,072 (reported on 11.9% of returns)
Here:
+$2,072
State:
+$8,582
(% of AGI for various income ranges: -0.1% for AGIs $25k-50k, 0.2% for AGIs $50k-75k, -0.4% for AGIs $75k-100k, 2.9% for AGIs over 100k)
Profit/loss from business: +$286 (reported on 6.0% of returns)
Here:
+$286
State:
+$10,813
IRA payment deduction: $2,077 (reported on 2.8% of returns)
45433:
$2,077
Ohio:
$2,794
Total itemized deductions: $15,414 (18% of AGI, reported on 10.6% of returns)
Here:
$15,414
State:
$17,503
Here:
18.3% of AGI
State:
20.8% of AGI
(% of AGI for various income ranges: 2.2% for AGIs $25k-50k, 3.3% for AGIs $50k-75k, 6.7% for AGIs $75k-100k, 5.7% for AGIs over 100k)
Charity contributions deductions: $4,391 (5% of AGI, reported on 9.9% of returns)
Here:
$4,391
State:
$3,087
Here:
5.0% of AGI
State:
3.4% of AGI
(% of AGI for various income ranges: 0.6% for AGIs $25k-50k, 1.1% for AGIs $50k-75k, 2.0% for AGIs $75k-100k, 1.1% for AGIs over 100k)
Total tax: $4,491 (reported on 74.1% of returns)
45433:
$4,491
State:
$6,781
(% of AGI for various income ranges: 1.5% for AGIs below $10k, 3.5% for AGIs $10k-25k, 2.8% for AGIs $25k-50k, 6.2% for AGIs $50k-75k, 10.2% for AGIs $75k-100k, 15.2% for AGIs over 100k)
Earned income credit: $1,400 (reported on 15.0% of returns)
Here:
$1,400
State:
$1,696
Percentage of individuals using paid preparers for their 2004 taxes: 40.0%
Here:
40%
State:
55%
(% for various income ranges: 34.8% for AGIs below $10k, 51.4% for AGIs $10k-25k, 37.9% for AGIs $25k-50k, 33.8% for AGIs $50k-75k, 34.5% for AGIs $75k-100k, 33.3% for AGIs over 100k)
Household received Food Stamps/SNAP in the past 12 months: 0 Household did not receive Food Stamps/SNAP in the past 12 months: 415
Women who had a birth in the past 12 months: 3 (4 now married, 0 unmarried) Women who did not have a birth in the past 12 months: 560 (255 now married, 305 unmarried)
Residents with income below the poverty level in 2022:
This zip code:
8.9%
Whole state:
13.4%
Residents with income below 50% of the poverty level in 2022:
This zip code:
4.2%
Whole state:
7.0%
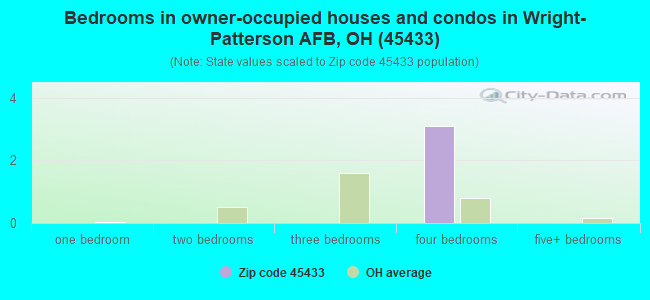
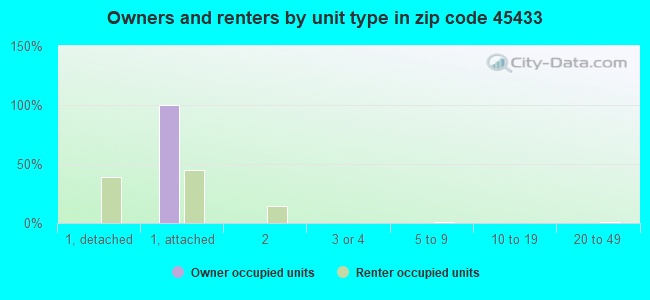
Median number of rooms in apartments:
Here:
6.9
State:
4.4
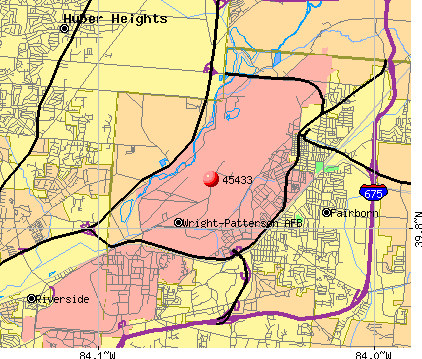
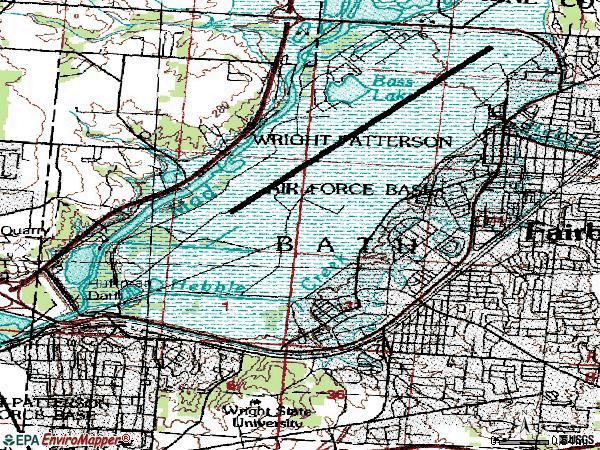
Notable locations in this zip code not listed on our city pages
Notable locations in zip code 45433: Skyborn Drive-In (A), Wright Patterson Air Force Base Fire / Emergency Medical Services Department (B). Display/hide their locations on the map
Parks in zip code 45433 include: Dayton Aviation Heritage National Historical Park (1), Huffman Prairie National Historic Landmark (2), Wright Brothers Memorial (3). Display/hide their locations on the map
329 married couples with children.
43 single-parent households (2 men, 41 women).
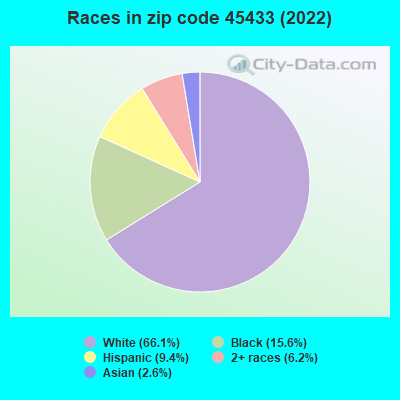
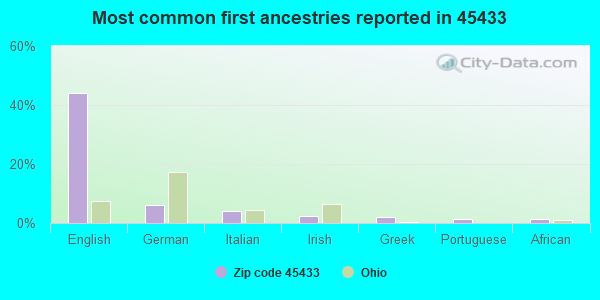
92.1% of residents of 45433 zip code speak English at home.
2.5% of residents speak Spanish at home (100% very well).
2.2% of residents speak other Indo-European language at home (71% very well, 29% well).
1.8% of residents speak Asian or Pacific Island language at home (100% very well).
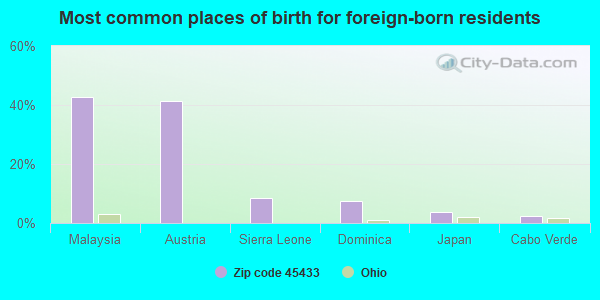
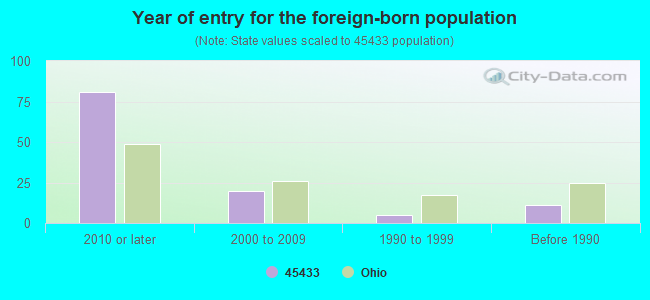
Foreign born population: 82 (5.3%) (58.5% of them are naturalized citizens)
Population in 1990: 2,298. Population change in the 1990s: +842 (+36.6%).
Place of birth for U.S.-born residents:
This state: 555
Northeast: 136
Midwest: 341
South: 285
West: 117
4% of the 45433 zip code residents lived in the same house 5 years ago. Out of people who lived in different houses, 8% lived in this county. Out of people who lived in different counties, 50% lived in Ohio.
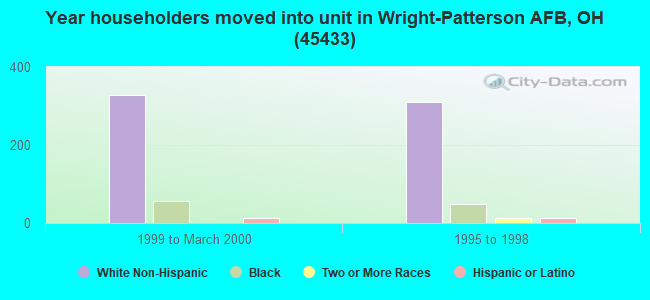
70% of the 45433 zip code residents lived in the same house 1 year ago. Out of people who lived in different houses, 23% moved from this county. Out of people who lived in different houses, 7% moved from different county within same state. Out of people who lived in different houses, 58% moved from different state. Out of people who lived in different houses, 13% moved from abroad.
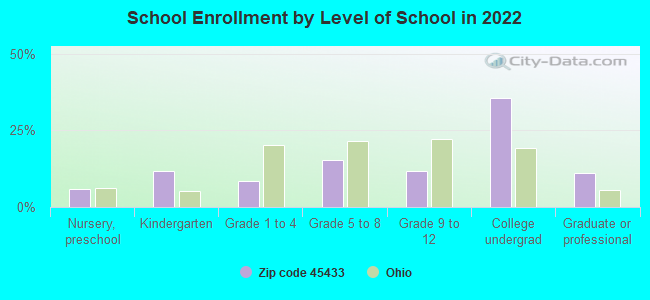
Private vs. public school enrollment:
Students in private schools in grades 1 to 8 (elementary and middle school): 63
Here:
46.8%
Ohio:
16.0%
Students in private schools in grades 9 to 12 (high school):
Here:
0.0%
Ohio:
13.1%
Students in private undergraduate colleges: 39
Here:
20.3%
Ohio:
22.3%
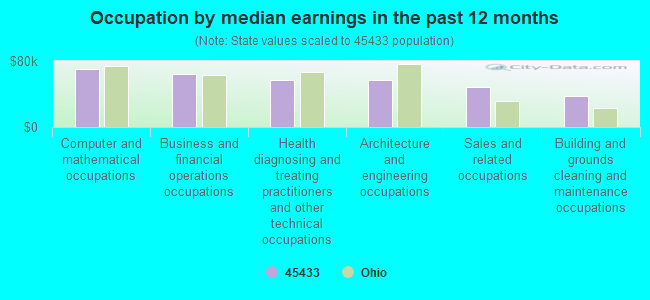
Occupation by median earnings in the past 12 months ($)
69,903Computer and mathematical occupations
64,567Business and financial operations occupations
57,419Health diagnosing and treating practitioners and other technical occupations
56,651Architecture and engineering occupations
48,977Sales and related occupations
37,605Building and grounds cleaning and maintenance occupations
Companies with federal contracts located in this zip code:
NAF WRIGHT PATTERSON (5215 THURLOW ST STE 2 in DAYTON, OH; small business) : $28,375 in 14 contractsfrom 2002 to 2006
Contracts for Other Administrative Support Services, Other Cargo and Freight Services, Veterinary/Animal Care Services by Air Force, Army Signed by year:2000: $0; 2001: $0; 2002: $1,450; 2003: $1,724; 2004: $2,650; 2005: $11,351; 2006: $11,200.
Biggest contracts:
$11,200 with Air Force for Other Administrative Support Services. Signed on 2006-05-24. Completion date: 2006-07-28.
$9,800 with Air Force for Other Cargo and Freight Services. Signed on 2005-07-11. Completion date: 2005-07-31.
$2,800 with Army for Veterinary/Animal Care Services. Signed on 2004-10-05. Completion date: 2005-09-30.
$1,450, same as above.Signed on 2005-12-15. Completion date: 2006-09-30.
VISICON INC (AREA A BLDG 823 in DAYTON, OH; small business)
$5,997 with Army for Lodging - Hotel/Motel. Signed on 2004-02-03. Completion date: 2004-01-26.
SYSKA HENNESSY GROUP, INC (4881 SUGAR MAPLE DR in DAYTON, OH)
$200 with Army for Maintenance, Repair or Alteration of Real Property -- Miscellaneous Buildings. Signed on 2005-09-26. Completion date: 2007-09-22.
Top industries in this zip code by the number of employees in 2005:
Health Care and Social Assistance: General Medical and Surgical Hospitals (250-499 employees: 1 establishment)
Professional, Scientific, and Technical Services: Research and Development in the Physical, Engineering, and Life Sciences (50-99: 1, 20-49: 1, 10-19: 3, 5-9: 2, 1-4: 6)
Professional, Scientific, and Technical Services: Computer Systems Design Services (20-49: 2, 10-19: 2, 5-9: 2, 1-4: 5)
Accommodation and Food Services: Hotels (except Casino Hotels) and Motels (50-99: 1)
Other Services (except Public Administration): General Automotive Repair (50-99: 1)
People in group quarters in 2010:
547 people in military barracks and dormitories (nondisciplinary)
People in group quarters in 2000:
319 people in military barracks, etc.
20 people in military transient quarters for temporary residents
Fatal accident statistics in 2014:
Fatal accident count: 1
Vehicles involved in fatal accidents: 1
Fatal accidents caused by drunken drivers: 1
Fatalities: 1
Persons involved in fatal accidents: 1
Pedestrians involved in fatal accidents: 0
Fatal accident statistics in 2012:
Fatal accident count: 1
Vehicles involved in fatal accidents: 1
Fatal accidents caused by drunken drivers: 0
Fatalities: 1
Persons involved in fatal accidents: 2
Pedestrians involved in fatal accidents: 1
Home Mortgage Disclosure Act Aggregated Statistics For Year 2009 (Based on 4 partial tracts)
C) Refinancings
D) Home Improvement Loans
Number
Average Value
Number
Average Value
LOANS ORIGINATED
7
$172,380
0
$0
APPLICATIONS APPROVED, NOT ACCEPTED
0
$0
0
$0
APPLICATIONS DENIED
0
$0
3
$5,523
APPLICATIONS WITHDRAWN
0
$0
0
$0
FILES CLOSED FOR INCOMPLETENESS
0
$0
0
$0
Aggregated Statistics For Year 2008 (Based on 4 partial tracts)
A) FHA, FSA/RHS & VA Home Purchase Loans
B) Conventional Home Purchase Loans
C) Refinancings
Number
Average Value
Number
Average Value
Number
Average Value
LOANS ORIGINATED
0
$0
0
$0
0
$0
APPLICATIONS APPROVED, NOT ACCEPTED
0
$0
0
$0
3
$193,377
APPLICATIONS DENIED
0
$0
3
$122,653
0
$0
APPLICATIONS WITHDRAWN
7
$57,303
0
$0
0
$0
FILES CLOSED FOR INCOMPLETENESS
0
$0
0
$0
0
$0
Aggregated Statistics For Year 2007 (Based on 4 partial tracts)
A) FHA, FSA/RHS & VA Home Purchase Loans
D) Home Improvement Loans
F) Non-occupant Loans on < 5 Family Dwellings (A B C & D)
Number
Average Value
Number
Average Value
Number
Average Value
LOANS ORIGINATED
3
$239,787
0
$0
0
$0
APPLICATIONS APPROVED, NOT ACCEPTED
0
$0
0
$0
0
$0
APPLICATIONS DENIED
0
$0
3
$81,770
3
$81,770
APPLICATIONS WITHDRAWN
0
$0
0
$0
0
$0
FILES CLOSED FOR INCOMPLETENESS
0
$0
0
$0
0
$0
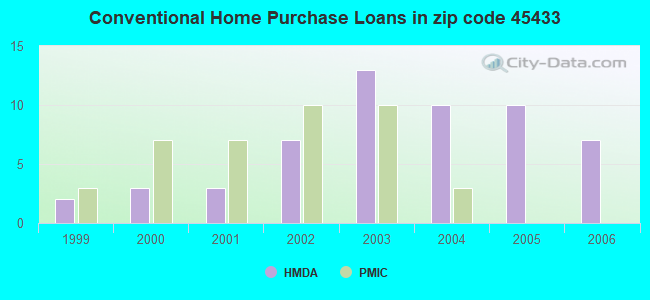
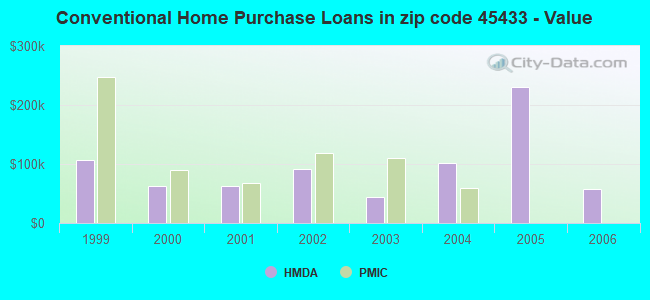
Aggregated Statistics For Year 2006 (Based on 4 partial tracts)
A) FHA, FSA/RHS & VA Home Purchase Loans
B) Conventional Home Purchase Loans
C) Refinancings
Number
Average Value
Number
Average Value
Number
Average Value
LOANS ORIGINATED
0
$0
7
$57,776
10
$106,412
APPLICATIONS APPROVED, NOT ACCEPTED
0
$0
3
$751,400
0
$0
APPLICATIONS DENIED
0
$0
0
$0
13
$171,870
APPLICATIONS WITHDRAWN
3
$265,200
0
$0
3
$79,560
FILES CLOSED FOR INCOMPLETENESS
0
$0
0
$0
0
$0
Aggregated Statistics For Year 2005 (Based on 4 partial tracts)
A) FHA, FSA/RHS & VA Home Purchase Loans
B) Conventional Home Purchase Loans
C) Refinancings
D) Home Improvement Loans
F) Non-occupant Loans on < 5 Family Dwellings (A B C & D)
G) Loans On Manufactured Home Dwelling (A B C & D)
Number
Average Value
Number
Average Value
Number
Average Value
Number
Average Value
Number
Average Value
Number
Average Value
LOANS ORIGINATED
0
$0
10
$230,393
3
$81,770
0
$0
3
$81,770
0
$0
APPLICATIONS APPROVED, NOT ACCEPTED
3
$221,000
3
$144,753
0
$0
0
$0
0
$0
0
$0
APPLICATIONS DENIED
0
$0
10
$80,555
3
$79,560
3
$16,577
0
$0
3
$139,230
APPLICATIONS WITHDRAWN
0
$0
3
$141,440
3
$238,680
0
$0
0
$0
0
$0
FILES CLOSED FOR INCOMPLETENESS
0
$0
0
$0
10
$68,289
0
$0
0
$0
0
$0
Aggregated Statistics For Year 2004 (Based on 4 partial tracts)
A) FHA, FSA/RHS & VA Home Purchase Loans
B) Conventional Home Purchase Loans
C) Refinancings
D) Home Improvement Loans
F) Non-occupant Loans on < 5 Family Dwellings (A B C & D)
Number
Average Value
Number
Average Value
Number
Average Value
Number
Average Value
Number
Average Value
LOANS ORIGINATED
3
$104,973
10
$101,108
3
$145,860
3
$6,630
3
$6,630
APPLICATIONS APPROVED, NOT ACCEPTED
0
$0
3
$75,140
0
$0
0
$0
0
$0
APPLICATIONS DENIED
7
$135,441
3
$164,647
3
$58,567
0
$0
0
$0
APPLICATIONS WITHDRAWN
0
$0
3
$53,040
7
$138,283
3
$38,677
3
$38,677
FILES CLOSED FOR INCOMPLETENESS
0
$0
0
$0
0
$0
0
$0
0
$0
Aggregated Statistics For Year 2003 (Based on 4 partial tracts)
A) FHA, FSA/RHS & VA Home Purchase Loans
B) Conventional Home Purchase Loans
C) Refinancings
D) Home Improvement Loans
Number
Average Value
Number
Average Value
Number
Average Value
Number
Average Value
LOANS ORIGINATED
0
$0
13
$44,625
10
$109,395
0
$0
APPLICATIONS APPROVED, NOT ACCEPTED
3
$201,110
0
$0
3
$119,340
0
$0
APPLICATIONS DENIED
0
$0
0
$0
13
$102,510
7
$10,419
APPLICATIONS WITHDRAWN
0
$0
0
$0
7
$86,190
0
$0
FILES CLOSED FOR INCOMPLETENESS
0
$0
0
$0
0
$0
0
$0
Aggregated Statistics For Year 2002 (Based on 4 partial tracts)
B) Conventional Home Purchase Loans
C) Refinancings
D) Home Improvement Loans
F) Non-occupant Loans on < 5 Family Dwellings (A B C & D)
Number
Average Value
Number
Average Value
Number
Average Value
Number
Average Value
LOANS ORIGINATED
7
$92,347
13
$139,230
3
$3,317
0
$0
APPLICATIONS APPROVED, NOT ACCEPTED
3
$89,503
3
$190,060
0
$0
3
$89,503
APPLICATIONS DENIED
0
$0
13
$98,685
0
$0
0
$0
APPLICATIONS WITHDRAWN
7
$28,414
7
$89,031
0
$0
7
$28,414
FILES CLOSED FOR INCOMPLETENESS
0
$0
0
$0
0
$0
0
$0
Aggregated Statistics For Year 2001 (Based on 4 partial tracts)
B) Conventional Home Purchase Loans
C) Refinancings
D) Home Improvement Loans
F) Non-occupant Loans on < 5 Family Dwellings (A B C & D)
Number
Average Value
Number
Average Value
Number
Average Value
Number
Average Value
LOANS ORIGINATED
3
$61,880
10
$99,450
3
$110,500
3
$59,670
APPLICATIONS APPROVED, NOT ACCEPTED
0
$0
0
$0
0
$0
0
$0
APPLICATIONS DENIED
7
$28,889
30
$92,267
0
$0
0
$0
APPLICATIONS WITHDRAWN
3
$132,600
10
$110,721
0
$0
0
$0
FILES CLOSED FOR INCOMPLETENESS
0
$0
3
$212,160
0
$0
0
$0
Aggregated Statistics For Year 2000 (Based on 4 partial tracts)
A) FHA, FSA/RHS & VA Home Purchase Loans
B) Conventional Home Purchase Loans
C) Refinancings
D) Home Improvement Loans
F) Non-occupant Loans on < 5 Family Dwellings (A B C & D)
Number
Average Value
Number
Average Value
Number
Average Value
Number
Average Value
Number
Average Value
LOANS ORIGINATED
0
$0
3
$61,880
7
$80,507
0
$0
3
$61,880
APPLICATIONS APPROVED, NOT ACCEPTED
0
$0
0
$0
13
$69,105
0
$0
0
$0
APPLICATIONS DENIED
0
$0
0
$0
13
$55,080
13
$7,650
3
$35,360
APPLICATIONS WITHDRAWN
3
$164,647
0
$0
3
$55,250
0
$0
0
$0
FILES CLOSED FOR INCOMPLETENESS
0
$0
3
$187,850
0
$0
0
$0
0
$0
Aggregated Statistics For Year 1999 (Based on 2 partial tracts)
B) Conventional Home Purchase Loans
C) Refinancings
D) Home Improvement Loans
F) Non-occupant Loans on < 5 Family Dwellings (A B C & D)

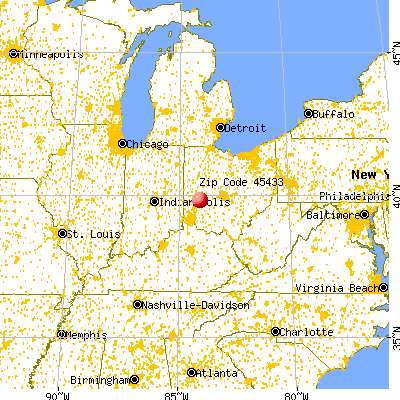


 Nearest zip codes: 45324, 45341, 45424, 45431, 45432, 45434.


 : $28,375 in 14 contracts from 2002 to 2006