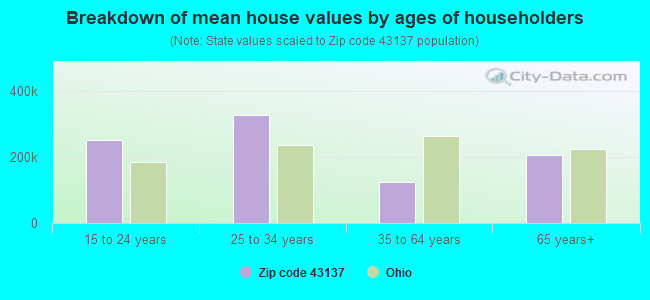
Estimated median house/condo value in 2022: $197,642
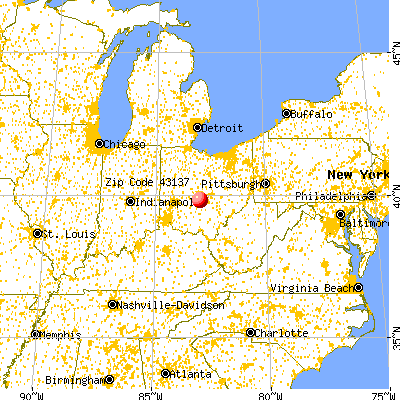
43137:
$197,642
Ohio:
$204,100
According to our research of Ohio and other state lists, there were 3 registered sex offenders living in 43137 zip code as of June 04, 2024. The ratio of all residents to sex offenders in zip code 43137 is 640 to 1. The ratio of registered sex offenders to all residents in this zip code is near the state average.
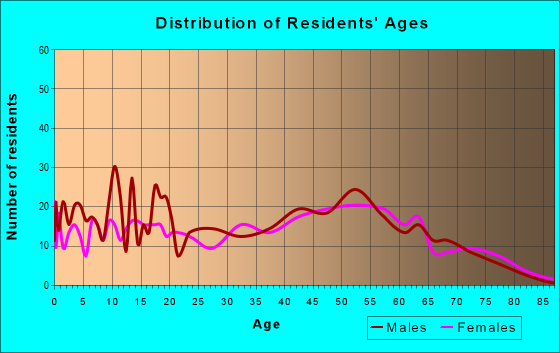
Median resident age:
This zip code:
47.4 years
Ohio median age:
39.9 years
Average household size:
This zip code:
2.3 people
Ohio:
2.4 people
Averages for the 2020 tax year for zip code 43137, filed in 2021:
Average Adjusted Gross Income (AGI) in 2020: $54,755 (Individual Income Tax Returns)
Here:
$54,755
State:
$67,288
Salary/wage: $48,040 (reported on 85.8% of returns)
Here:
$48,040
State:
$55,628
(% of AGI for various income ranges: 1129.1% for AGIs below $25k, 3711.6% for AGIs $25k-50k, 6717.1% for AGIs $50k-75k, 10274.5% for AGIs $75k-100k, 20062.0% for AGIs $100k-200k)
Taxable interest for individuals: $520 (reported on 17.7% of returns)
This zip code:
$520
Ohio:
$1,518
(% of AGI for various income ranges: 3.8% for AGIs below $25k, 12.6% for AGIs $25k-50k, 2.4% for AGIs $50k-75k, 8.2% for AGIs $75k-100k, 65.0% for AGIs $100k-200k)
Ordinary dividends: $3,600 (reported on 9.2% of returns)
Here:
$3,600
State:
$7,167
(% of AGI for various income ranges: 12.9% for AGIs $25k-50k, 38.8% for AGIs $50k-75k, 362.0% for AGIs $100k-200k)
Net capital gain/loss in AGI: +$3,569 (reported on 9.2% of returns)
Here:
+$3,569
State:
+$18,919
(% of AGI for various income ranges: 15.5% for AGIs $25k-50k, 66.5% for AGIs $50k-75k, 303.0% for AGIs $100k-200k)
Profit/loss from business: +$12,286 (reported on 14.9% of returns)
Here:
+$12,286
State:
+$13,744
(% of AGI for various income ranges: 112.1% for AGIs below $25k, 172.3% for AGIs $25k-50k, 306.5% for AGIs $50k-75k, 290.0% for AGIs $75k-100k, 825.0% for AGIs $100k-200k)
Taxable individual retirement arrangement distribution: $12,138 (reported on 5.7% of returns)
43137:
$12,138
Ohio:
$18,876
(% of AGI for various income ranges: 47.6% for AGIs below $25k, 59.0% for AGIs $25k-50k, 368.2% for AGIs $50k-75k)
Total itemized deductions: $26,288 (reported on 5.7% of returns)
Here:
$26,288
State:
$33,869
(% of AGI for various income ranges: 414.7% for AGIs $50k-75k, 1398.0% for AGIs $100k-200k)
Charity contributions: $12,760 (reported on 3.5% of returns)
Here:
$12,760
State:
$14,577
(% of AGI for various income ranges: 42.4% for AGIs $50k-75k, 566.0% for AGIs $100k-200k)
Taxes paid: $7,125 (reported on 5.7% of returns)
43137:
$7,125
State:
$7,681
(% of AGI for various income ranges: 150.6% for AGIs $50k-75k, 314.0% for AGIs $100k-200k)
Earned income credit: $2,278 (reported on 16.3% of returns)
Here:
$2,278
State:
$2,304
(% of AGI for various income ranges: 100.0% for AGIs below $25k, 59.4% for AGIs $25k-50k)
Percentage of individuals using paid preparers for their 2020 taxes: 93.6%
Here:
94%
State:
94%
(% for various income ranges: 93.0% for AGIs below $25k, 94.9% for AGIs $25k-50k, 95.7% for AGIs $50k-75k, 87.5% for AGIs $75k-100k, 95.0% for AGIs $100k-200k)
Averages for the 2012 tax year for zip code 43137, filed in 2013:
Average Adjusted Gross Income (AGI) in 2012: $45,209 (Individual Income Tax Returns)
Here:
$45,209
State:
$54,926
Salary/wage: $39,026 (reported on 85.6% of returns)
Here:
$39,026
State:
$45,869
(% of AGI for various income ranges: 71.3% for AGIs below $25k, 82.2% for AGIs $25k-50k, 80.8% for AGIs $50k-75k, 79.7% for AGIs $75k-100k, 61.8% for AGIs $100k-200k)
Taxable interest for individuals: $608 (reported on 21.2% of returns)
This zip code:
$608
Ohio:
$1,297
(% of AGI for various income ranges: 0.4% for AGIs below $25k, 0.2% for AGIs $25k-50k, 0.1% for AGIs $50k-75k, 0.4% for AGIs $75k-100k, 0.3% for AGIs $100k-200k)
Ordinary dividends: $2,169 (reported on 11.0% of returns)
Here:
$2,169
State:
$5,821
(% of AGI for various income ranges: 0.3% for AGIs $25k-50k, 0.5% for AGIs $50k-75k, 1.1% for AGIs $100k-200k)
Net capital gain/loss in AGI: +$9,089 (reported on 7.6% of returns)
Here:
+$9,089
State:
+$11,232
(% of AGI for various income ranges: 0.2% for AGIs below $25k, 0.2% for AGIs $50k-75k, 4.7% for AGIs $100k-200k)
Profit/loss from business: +$10,317 (reported on 15.3% of returns)
Here:
+$10,317
State:
+$12,773
(% of AGI for various income ranges: 8.1% for AGIs below $25k, 1.8% for AGIs $25k-50k, 5.2% for AGIs $50k-75k, 3.3% for AGIs $100k-200k)
Taxable individual retirement arrangement distribution: $10,167 (reported on 5.1% of returns)
43137:
$10,167
Ohio:
$14,511
(% of AGI for various income ranges: 3.8% for AGIs below $25k, 3.3% for AGIs $50k-75k)
Total itemized deductions: $17,846 (22% of AGI, reported on 29.7% of returns)
Here:
$17,846
State:
$21,278
Here:
22.4% of AGI
State:
18.8% of AGI
(% of AGI for various income ranges: 9.3% for AGIs below $25k, 8.1% for AGIs $25k-50k, 10.9% for AGIs $50k-75k, 16.0% for AGIs $75k-100k, 13.7% for AGIs $100k-200k)
Charity contributions: $2,385 (reported on 22.0% of returns)
Here:
$2,385
State:
$3,943
(% of AGI for various income ranges: 0.8% for AGIs below $25k, 0.8% for AGIs $25k-50k, 1.0% for AGIs $50k-75k, 1.6% for AGIs $75k-100k, 1.5% for AGIs $100k-200k)
Taxes paid: $7,009 (reported on 29.7% of returns)
43137:
$7,009
State:
$9,568
(% of AGI for various income ranges: 2.1% for AGIs below $25k, 2.6% for AGIs $25k-50k, 4.3% for AGIs $50k-75k, 6.3% for AGIs $75k-100k, 6.3% for AGIs $100k-200k)
Earned income credit: $2,300 (reported on 21.2% of returns)
Here:
$2,300
State:
$2,285
(% of AGI for various income ranges: 7.3% for AGIs below $25k, 1.2% for AGIs $25k-50k)
Percentage of individuals using paid preparers for their 2012 taxes: 50.8%
Here:
51%
State:
51%
(% for various income ranges: 43.5% for AGIs below $25k, 54.5% for AGIs $25k-50k, 52.6% for AGIs $50k-75k, 55.6% for AGIs $75k-100k, 63.6% for AGIs $100k-200k)
Averages for the 2004 tax year for zip code 43137, filed in 2005:
Average Adjusted Gross Income (AGI) in 2004: $38,631 (Individual Income Tax Returns)
Here:
$38,631
State:
$44,480
Salary/wage: $32,938 (reported on 88.2% of returns)
Here:
$32,938
State:
$39,198
(% of AGI for various income ranges: 102.5% for AGIs below $10k, 79.2% for AGIs $10k-25k, 85.7% for AGIs $25k-50k, 85.2% for AGIs $50k-75k, 84.0% for AGIs $75k-100k, 41.3% for AGIs over 100k)
Taxable interest for individuals: $941 (reported on 31.7% of returns)
This zip code:
$941
Ohio:
$1,532
(% of AGI for various income ranges: 2.7% for AGIs below $10k, 1.6% for AGIs $10k-25k, 0.6% for AGIs $25k-50k, 0.3% for AGIs $50k-75k, 0.3% for AGIs $75k-100k, 1.1% for AGIs over 100k)
Taxable dividends: $1,292 (reported on 13.7% of returns)
Here:
$1,292
State:
$3,496
(% of AGI for various income ranges: 0.3% for AGIs below $10k, 0.2% for AGIs $10k-25k, 0.4% for AGIs $25k-50k, 0.3% for AGIs $50k-75k, 0.2% for AGIs $75k-100k, 1.0% for AGIs over 100k)
Net capital gain/loss: +$2,906 (reported on 8.6% of returns)
Here:
+$2,906
State:
+$8,582
(% of AGI for various income ranges: 1.1% for AGIs below $10k, -0.2% for AGIs $10k-25k, 0.2% for AGIs $25k-50k, 0.0% for AGIs $50k-75k, 0.0% for AGIs $75k-100k, 2.6% for AGIs over 100k)
Profit/loss from business: +$6,257 (reported on 14.6% of returns)
Here:
+$6,257
State:
+$10,813
(% of AGI for various income ranges: -1.6% for AGIs below $10k, 4.9% for AGIs $10k-25k, 2.2% for AGIs $25k-50k, 1.7% for AGIs $50k-75k, -0.8% for AGIs $75k-100k, 4.1% for AGIs over 100k)
IRA payment deduction: $3,231 (reported on 1.1% of returns)
43137:
$3,231
Ohio:
$2,794
Total itemized deductions: $16,917 (23% of AGI, reported on 28.3% of returns)
Here:
$16,917
State:
$17,503
Here:
23.0% of AGI
State:
20.8% of AGI
(% of AGI for various income ranges: 14.2% for AGIs below $10k, 5.4% for AGIs $10k-25k, 10.8% for AGIs $25k-50k, 14.0% for AGIs $50k-75k, 18.8% for AGIs $75k-100k, 12.7% for AGIs over 100k)
Charity contributions deductions: $2,432 (3% of AGI, reported on 23.2% of returns)
Here:
$2,432
State:
$3,087
Here:
3.0% of AGI
State:
3.4% of AGI
(% of AGI for various income ranges: 1.0% for AGIs $10k-25k, 1.2% for AGIs $25k-50k, 1.5% for AGIs $50k-75k, 2.8% for AGIs $75k-100k, 1.4% for AGIs over 100k)
Total tax: $5,303 (reported on 74.0% of returns)
43137:
$5,303
State:
$6,781
(% of AGI for various income ranges: 3.2% for AGIs below $10k, 4.4% for AGIs $10k-25k, 6.7% for AGIs $25k-50k, 8.9% for AGIs $50k-75k, 9.8% for AGIs $75k-100k, 20.1% for AGIs over 100k)
Earned income credit: $1,698 (reported on 18.3% of returns)
Here:
$1,698
State:
$1,696
Percentage of individuals using paid preparers for their 2004 taxes: 55.8%
Here:
56%
State:
55%
(% for various income ranges: 47.7% for AGIs below $10k, 55.7% for AGIs $10k-25k, 57.2% for AGIs $25k-50k, 56.3% for AGIs $50k-75k, 65.4% for AGIs $75k-100k, 68.9% for AGIs over 100k)
Household received Food Stamps/SNAP in the past 12 months: 129 Household did not receive Food Stamps/SNAP in the past 12 months: 869
Women who had a birth in the past 12 months: 27 (2 now married, 24 unmarried) Women who did not have a birth in the past 12 months: 483 (278 now married, 204 unmarried)
Housing units in zip code 43137 with a mortgage: 484 (51 second mortgage, 37 both second mortgage and home equity loan) Houses without a mortgage: 3
Median monthly owner costs for units with a mortgage: $1,349 Median monthly owner costs for units without a mortgage: $722
Residents with income below the poverty level in 2022:
This zip code:
22.3%
Whole state:
13.4%
Residents with income below 50% of the poverty level in 2022:
This zip code:
2.1%
Whole state:
7.0%
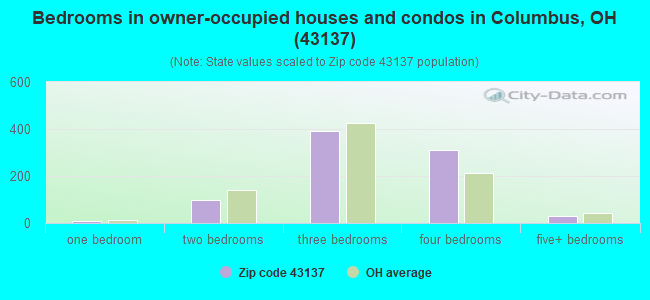
Median number of rooms in houses and condos:
Here:
6.0
State:
6.7
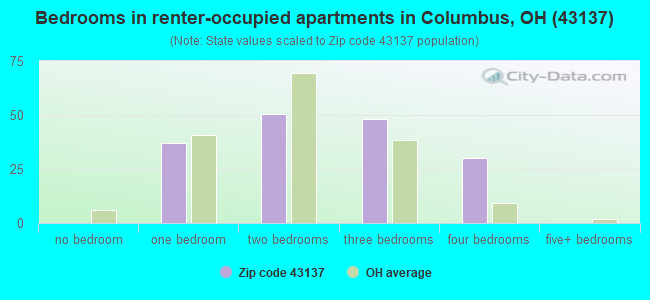
Median number of rooms in apartments:
Here:
4.5
State:
4.4
Notable locations in this zip code not listed on our city pages
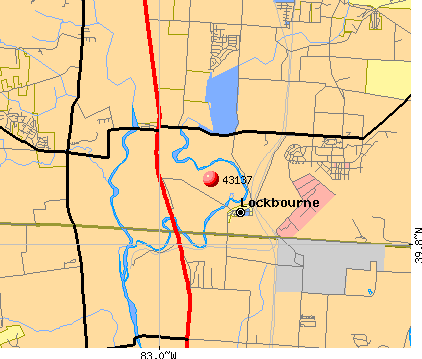
Notable locations in zip code 43137: Scioto Downs (A), Southerly Wastewater Treatment Plant (B), Columbus Municipal Nursery (C), Camp Saint Joseph (D), Peters Family Farms (E), Hamilton Township Fire Department Station 172 (F), Lockbourne Municipal Building (G). Display/hide their locations on the map
Churches in zip code 43137 include: Shadeville Church of God (A), Lockbourne Church of Christ (B), Rohr Road Baptist Church (C), Lockbourne United Methodist Church (D). Display/hide their locations on the map
In group quarters: 7 (-1 institutionalized population)
Size of family households: 294 2-persons, 194 3-persons, 55 4-persons, 23 5-persons, 33 7-or-more-persons
Size of nonfamily households: 250 1-person, 149 2-persons
105 married couples with children.
147 single-parent households (98 men, 49 women).
95.9% of residents of 43137 zip code speak English at home.
4.0% of residents speak Spanish at home (29% very well, 31% not well, 40% not at all).
Foreign born population: 0 (0.0%)
:
0.0%
Whole state:
5.0%
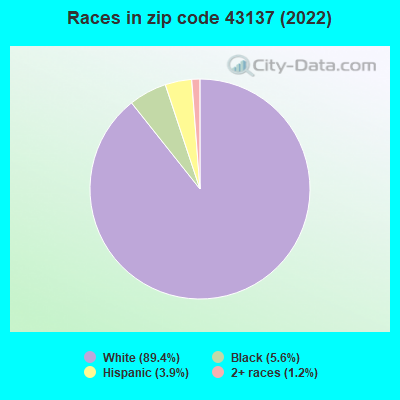
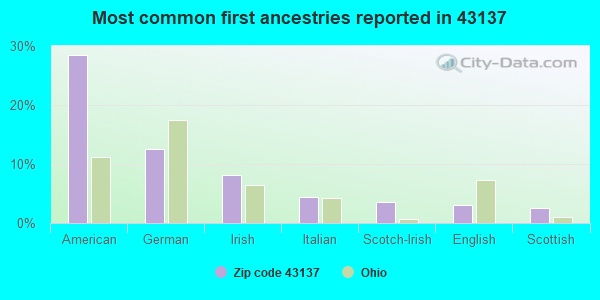
28%American
13%German
8%Irish
4%Italian
4%Scotch-Irish
3%English
2%Scottish
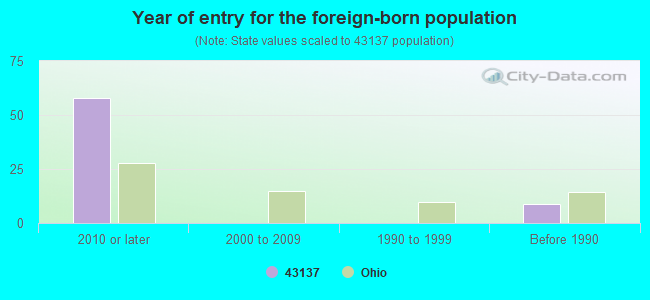
Year of entry for the foreign-born population
582010 or later
02000 to 2009
01990 to 1999
9Before 1990
Facilities with environmental interests located in this zip code:
AMERICAN ELECTRIC POWER CO PICWAY POWER PLANT * (9301 US RTE. 23 in LOCKBOURNE, OH)
AIR MAJOR (AIRS/AFS) AIR PROGRAM (Clean Air Markets Division Business System) CRITERIA AND HAZARDOUS AIR POLLUTANT INVENTORY (Inventory of air pollution sources) STATE MASTER (Ohio general info) - RCRA-OHD000724302, HAZARDOUS WASTE PROGRAM, AIR MAJOR, EPCRA, TRIS-43137MRCNL9301U, TRI REPORTER, SDWIS-6536812, DRINKING WATER PROGRAM National Pollutant Discharge Elimination System NON-MAJOR (Tracking pollutant discharge elimination systems) - permit HAZARDOUS WASTE BIENNIAL REPORTER (Resource Conservation and Recovery Act (tracking hazardous waste)) Small Quantity Generators, between 100 kg and 1000 kg of hazardous waste/month (Resource Conservation and Recovery Act (tracking hazardous waste)) - notification TRI REPORTER (Tracking of toxic chemicals releasing facilities) Business SIC classification: ELECTRIC SERVICES Business NAICS classification: FOSSIL FUEL ELECTRIC POWER GENERATION. Organizations: COLUMBUS SOUTHERN POWER DBA AEP (CONTACT/OPERATOR)
, COLUMBUS SOUTHERN POWER (CONTACT/OWNER)
, COLUMBUS SOUTHERN POWER DBA AEP (CONTACT/OWNER)
, COLUMBUS SOUTHERN POWER COMPANY (OWNER/OPERATOR)
Alternative names: AMERICAN ELECTRIC POWER CO.PICWAY PLANT, AMERICAN ELECTRIC POWER PICWAY PLANT, COLUMBUS & SO OHIO ELEC CO, COLUMBUS SOUTHERN POWER PICWAY GENERATIN, PICWAY POWER PLANT
ALD CONCRETE & GRADING CO INC (9510 SHEPHERD RD in LOCKBOURNE, OH)
STATE MASTER (Ohio general info) - RCRA-OHR000012948, HAZARDOUS WASTE PROGRAM Conditionally Exempt Small Quantity Generators, less than 100 kg/month of hazardous waste (Resource Conservation and Recovery Act (tracking hazardous waste)) - notification Organizations: ANGELO & BETTY DEFELICE (CONTACT/OWNER)
Housing units lacking complete kitchen facilities: 2.4%
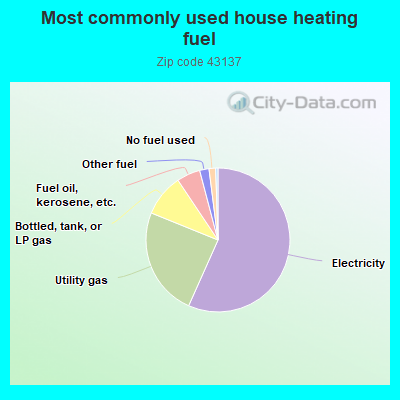
56.8%Electricity
24.5%Utility gas
9.5%Bottled, tank, or LP gas
5.3%Fuel oil, kerosene, etc.
2.1%Other fuel
1.5%No fuel used
0.5%Wood
Population in 1990: 1,423. Population change in the 1990s: +1,030 (+72.4%).
Place of birth for U.S.-born residents:
This state: 1,756
Northeast: 40
Midwest: 92
South: 208
West: 101
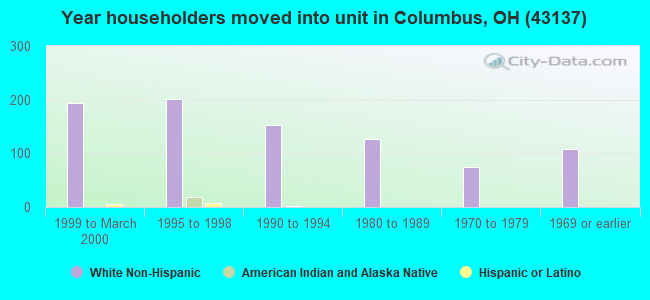
57% of the 43137 zip code residents lived in the same house 5 years ago. Out of people who lived in different houses, 45% lived in this county. Out of people who lived in different counties, 50% lived in Ohio.
78% of the 43137 zip code residents lived in the same house 1 year ago. Out of people who lived in different houses, 52% moved from this county. Out of people who lived in different houses, 42% moved from different county within same state. Out of people who lived in different houses, 1% moved from different state.
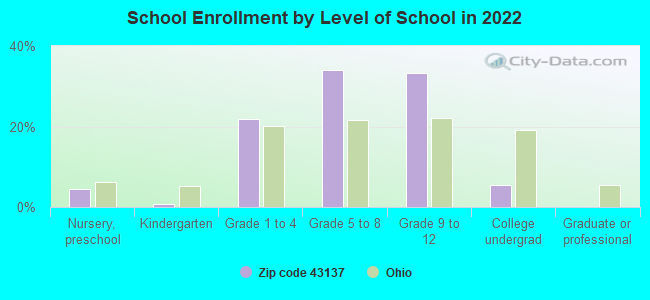
Private vs. public school enrollment:
Students in private schools in grades 1 to 8 (elementary and middle school): 40
Here:
26.5%
Ohio:
16.0%
Students in private schools in grades 9 to 12 (high school): 10
Here:
11.2%
Ohio:
13.1%
Students in private undergraduate colleges: 1
Here:
11.6%
Ohio:
22.3%
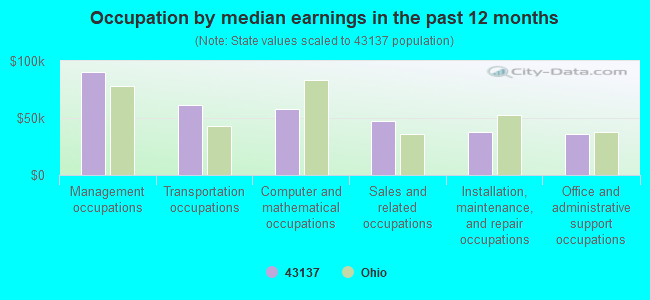
Occupation by median earnings in the past 12 months ($)
90,643Management occupations
61,698Transportation occupations
57,544Computer and mathematical occupations
47,447Sales and related occupations
37,922Installation, maintenance, and repair occupations
35,803Office and administrative support occupations
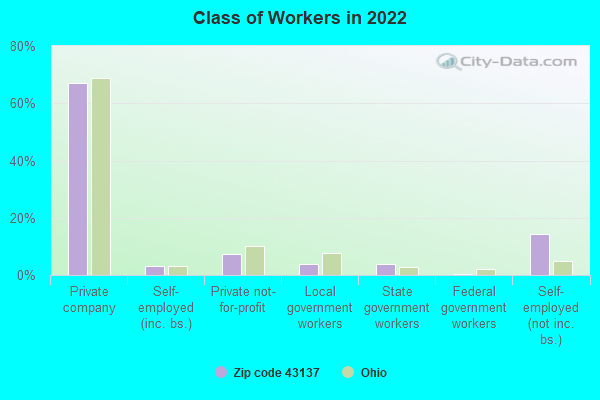
Top industries in this zip code by the number of employees in 2005:
Management of Companies and Enterprises: Corporate, Subsidiary, and Regional Managing Offices (500-999 employees: 1 establishment)
Wholesale Trade: Drugs and Druggists' Sundries Merchant Wholesalers (100-249: 1)
Health Care and Social Assistance: Medical Laboratories (50-99: 1)
Construction: Poured Concrete Foundation and Structure Contractors (50-99: 1)
People in group quarters in 2010:
10 people in workers' group living quarters and job corps centers
Fatal accident statistics in 2014:
Fatal accident count: 2
Vehicles involved in fatal accidents: 4
Fatal accidents caused by drunken drivers: 1
Fatalities: 3
Persons involved in fatal accidents: 8
Pedestrians involved in fatal accidents: 0
Fatal accident statistics in 2013:
Fatal accident count: 2
Vehicles involved in fatal accidents: 4
Fatal accidents caused by drunken drivers: 0
Fatalities: 2
Persons involved in fatal accidents: 7
Pedestrians involved in fatal accidents: 0
Home Mortgage Disclosure Act Aggregated Statistics For Year 2009 (Based on 6 partial tracts)
A) FHA, FSA/RHS & VA Home Purchase Loans
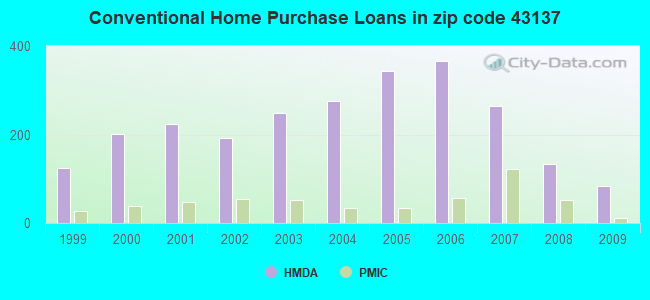
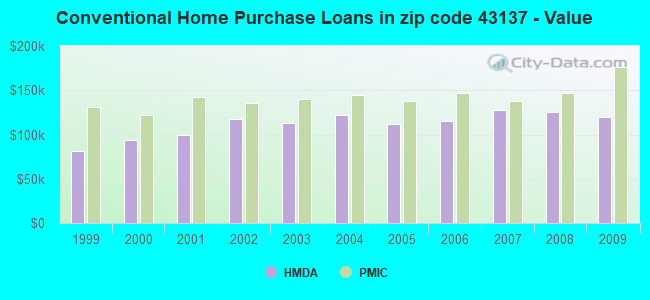
B) Conventional Home Purchase Loans
C) Refinancings
D) Home Improvement Loans
F) Non-occupant Loans on < 5 Family Dwellings (A B C & D)
G) Loans On Manufactured Home Dwelling (A B C & D)
Number
Average Value
Number
Average Value
Number
Average Value
Number
Average Value
Number
Average Value
Number
Average Value
LOANS ORIGINATED
188
$134,112
83
$120,087
310
$150,820
14
$34,843
27
$105,385
10
$27,764
APPLICATIONS APPROVED, NOT ACCEPTED
15
$158,855
10
$107,456
26
$127,215
2
$22,360
1
$147,810
6
$38,380
APPLICATIONS DENIED
31
$148,046
37
$58,900
144
$140,231
27
$33,788
11
$70,560
32
$45,841
APPLICATIONS WITHDRAWN
20
$134,042
5
$111,946
93
$139,225
4
$24,310
10
$119,713
2
$64,390
FILES CLOSED FOR INCOMPLETENESS
0
$0
6
$105,447
24
$137,970
4
$151,110
2
$86,355
2
$35,600
Aggregated Statistics For Year 2008 (Based on 6 partial tracts)
A) FHA, FSA/RHS & VA Home Purchase Loans
B) Conventional Home Purchase Loans
C) Refinancings
D) Home Improvement Loans
E) Loans on Dwellings For 5+ Families
F) Non-occupant Loans on < 5 Family Dwellings (A B C & D)
G) Loans On Manufactured Home Dwelling (A B C & D)
Number
Average Value
Number
Average Value
Number
Average Value
Number
Average Value
Number
Average Value
Number
Average Value
Number
Average Value
LOANS ORIGINATED
134
$141,339
134
$125,562
164
$125,400
38
$32,474
1
$105,190
28
$82,840
22
$37,708
APPLICATIONS APPROVED, NOT ACCEPTED
18
$143,921
18
$139,766
33
$107,530
10
$13,357
0
$0
5
$59,358
6
$36,342
APPLICATIONS DENIED
29
$121,722
33
$91,795
195
$121,972
60
$30,601
0
$0
12
$112,835
11
$33,026
APPLICATIONS WITHDRAWN
27
$136,263
14
$114,419
59
$133,788
3
$53,040
0
$0
3
$92,963
0
$0
FILES CLOSED FOR INCOMPLETENESS
4
$118,405
5
$125,492
10
$153,403
4
$19,212
0
$0
1
$43,370
0
$0
Aggregated Statistics For Year 2007 (Based on 6 partial tracts)
A) FHA, FSA/RHS & VA Home Purchase Loans
B) Conventional Home Purchase Loans
C) Refinancings
D) Home Improvement Loans
E) Loans on Dwellings For 5+ Families
F) Non-occupant Loans on < 5 Family Dwellings (A B C & D)
G) Loans On Manufactured Home Dwelling (A B C & D)
Number
Average Value
Number
Average Value
Number
Average Value
Number
Average Value
Number
Average Value
Number
Average Value
Number
Average Value
LOANS ORIGINATED
89
$137,775
264
$128,172
217
$112,879
39
$39,008
1
$310,390
40
$93,078
27
$56,151
APPLICATIONS APPROVED, NOT ACCEPTED
3
$160,427
25
$145,597
65
$117,962
8
$45,024
0
$0
3
$98,970
8
$74,241
APPLICATIONS DENIED
14
$148,650
86
$94,513
261
$118,385
56
$35,771
0
$0
13
$105,958
25
$28,007
APPLICATIONS WITHDRAWN
20
$131,629
50
$128,623
91
$122,318
7
$55,401
0
$0
17
$84,725
0
$0
FILES CLOSED FOR INCOMPLETENESS
0
$0
8
$161,044
35
$150,426
1
$106,610
0
$0
0
$0
0
$0
Aggregated Statistics For Year 2006 (Based on 6 partial tracts)
A) FHA, FSA/RHS & VA Home Purchase Loans
B) Conventional Home Purchase Loans
C) Refinancings
D) Home Improvement Loans
E) Loans on Dwellings For 5+ Families
F) Non-occupant Loans on < 5 Family Dwellings (A B C & D)
G) Loans On Manufactured Home Dwelling (A B C & D)
Number
Average Value
Number
Average Value
Number
Average Value
Number
Average Value
Number
Average Value
Number
Average Value
Number
Average Value
LOANS ORIGINATED
76
$149,532
365
$115,803
264
$103,654
45
$35,674
1
$706,140
54
$96,198
27
$38,749
APPLICATIONS APPROVED, NOT ACCEPTED
7
$146,637
66
$106,500
59
$105,507
12
$72,107
0
$0
8
$135,224
7
$31,274
APPLICATIONS DENIED
23
$120,868
98
$93,313
283
$117,362
60
$54,171
0
$0
23
$96,941
18
$46,211
APPLICATIONS WITHDRAWN
15
$147,303
49
$107,304
120
$129,262
11
$41,595
0
$0
10
$84,867
3
$33,690
FILES CLOSED FOR INCOMPLETENESS
2
$149,260
7
$139,194
36
$124,223
2
$74,605
0
$0
0
$0
0
$0
Aggregated Statistics For Year 2005 (Based on 6 partial tracts)
A) FHA, FSA/RHS & VA Home Purchase Loans
B) Conventional Home Purchase Loans
C) Refinancings
D) Home Improvement Loans
F) Non-occupant Loans on < 5 Family Dwellings (A B C & D)
G) Loans On Manufactured Home Dwelling (A B C & D)
Number
Average Value
Number
Average Value
Number
Average Value
Number
Average Value
Number
Average Value
Number
Average Value
LOANS ORIGINATED
100
$145,750
343
$111,868
308
$125,783
53
$45,622
47
$82,240
23
$24,693
APPLICATIONS APPROVED, NOT ACCEPTED
13
$150,762
86
$97,341
87
$113,338
12
$35,488
4
$53,005
9
$49,448
APPLICATIONS DENIED
26
$146,994
123
$84,444
357
$118,598
61
$42,407
21
$94,125
27
$33,893
APPLICATIONS WITHDRAWN
14
$148,503
59
$105,319
174
$128,116
36
$92,383
11
$102,397
2
$10,255
FILES CLOSED FOR INCOMPLETENESS
3
$179,287
27
$95,559
48
$137,324
4
$61,518
2
$91,965
0
$0
Aggregated Statistics For Year 2004 (Based on 6 partial tracts)
A) FHA, FSA/RHS & VA Home Purchase Loans
B) Conventional Home Purchase Loans
C) Refinancings
D) Home Improvement Loans
E) Loans on Dwellings For 5+ Families
F) Non-occupant Loans on < 5 Family Dwellings (A B C & D)
G) Loans On Manufactured Home Dwelling (A B C & D)
Number
Average Value
Number
Average Value
Number
Average Value
Number
Average Value
Number
Average Value
Number
Average Value
Number
Average Value
LOANS ORIGINATED
110
$143,435
276
$121,981
402
$114,420
59
$42,638
1
$172,440
37
$71,289
13
$17,996
APPLICATIONS APPROVED, NOT ACCEPTED
28
$138,757
57
$101,175
95
$119,512
12
$41,290
0
$0
7
$45,814
14
$47,144
APPLICATIONS DENIED
31
$133,667
49
$98,073
326
$111,222
59
$34,894
0
$0
8
$105,964
27
$43,997
APPLICATIONS WITHDRAWN
12
$138,673
41
$122,192
174
$117,111
4
$33,382
0
$0
8
$127,588
2
$25,865
FILES CLOSED FOR INCOMPLETENESS
2
$147,965
11
$104,438
59
$118,288
6
$58,898
0
$0
3
$116,720
2
$80,285
Aggregated Statistics For Year 2003 (Based on 6 partial tracts)
A) FHA, FSA/RHS & VA Home Purchase Loans
B) Conventional Home Purchase Loans
C) Refinancings
D) Home Improvement Loans
F) Non-occupant Loans on < 5 Family Dwellings (A B C & D)
Number
Average Value
Number
Average Value
Number
Average Value
Number
Average Value
Number
Average Value
LOANS ORIGINATED
111
$150,222
249
$113,334
873
$116,625
37
$29,414
54
$87,960
APPLICATIONS APPROVED, NOT ACCEPTED
9
$151,016
46
$100,376
148
$112,503
13
$31,678
6
$80,502
APPLICATIONS DENIED
18
$145,211
76
$68,986
327
$104,651
43
$25,867
16
$60,803
APPLICATIONS WITHDRAWN
5
$167,132
28
$114,931
161
$122,689
4
$87,878
6
$68,943
FILES CLOSED FOR INCOMPLETENESS
0
$0
14
$87,258
66
$111,712
2
$92,075
3
$60,743
Aggregated Statistics For Year 2002 (Based on 6 partial tracts)
A) FHA, FSA/RHS & VA Home Purchase Loans
B) Conventional Home Purchase Loans
C) Refinancings
D) Home Improvement Loans
E) Loans on Dwellings For 5+ Families
F) Non-occupant Loans on < 5 Family Dwellings (A B C & D)
Number
Average Value
Number
Average Value
Number
Average Value
Number
Average Value
Number
Average Value
Number
Average Value
LOANS ORIGINATED
177
$138,582
193
$117,630
628
$108,765
49
$22,335
1
$60,350
26
$70,068
APPLICATIONS APPROVED, NOT ACCEPTED
8
$145,400
44
$84,631
128
$98,236
11
$11,874
0
$0
3
$45,647
APPLICATIONS DENIED
23
$145,861
86
$63,079
272
$101,967
46
$19,636
0
$0
10
$56,989
APPLICATIONS WITHDRAWN
7
$133,411
15
$128,869
164
$107,571
5
$24,696
0
$0
2
$61,050
FILES CLOSED FOR INCOMPLETENESS
0
$0
11
$99,647
68
$101,725
0
$0
0
$0
3
$59,590
Aggregated Statistics For Year 2001 (Based on 6 partial tracts)
A) FHA, FSA/RHS & VA Home Purchase Loans
B) Conventional Home Purchase Loans
C) Refinancings
D) Home Improvement Loans
E) Loans on Dwellings For 5+ Families
F) Non-occupant Loans on < 5 Family Dwellings (A B C & D)
Number
Average Value
Number
Average Value
Number
Average Value
Number
Average Value
Number
Average Value
Number
Average Value
LOANS ORIGINATED
198
$131,444
224
$99,962
521
$105,031
58
$22,635
1
$177,610
35
$65,927
APPLICATIONS APPROVED, NOT ACCEPTED
4
$160,165
50
$70,316
94
$103,054
15
$25,930
0
$0
2
$105,780
APPLICATIONS DENIED
7
$136,023
127
$51,679
292
$88,891
56
$14,966
0
$0
5
$77,856
APPLICATIONS WITHDRAWN
7
$154,607
20
$104,671
142
$104,906
11
$19,654
0
$0
3
$85,027
FILES CLOSED FOR INCOMPLETENESS
2
$43,935
3
$79,147
27
$98,422
0
$0
0
$0
1
$32,760
Aggregated Statistics For Year 2000 (Based on 6 partial tracts)
A) FHA, FSA/RHS & VA Home Purchase Loans
B) Conventional Home Purchase Loans
C) Refinancings
D) Home Improvement Loans
E) Loans on Dwellings For 5+ Families
F) Non-occupant Loans on < 5 Family Dwellings (A B C & D)
Number
Average Value
Number
Average Value
Number
Average Value
Number
Average Value
Number
Average Value
Number
Average Value
LOANS ORIGINATED
129
$119,435
202
$93,333
199
$81,468
66
$16,567
2
$259,840
19
$69,741
APPLICATIONS APPROVED, NOT ACCEPTED
15
$80,809
66
$49,799
71
$96,651
16
$9,287
0
$0
2
$49,010
APPLICATIONS DENIED
20
$82,856
179
$47,626
150
$87,370
60
$11,825
0
$0
5
$34,586
APPLICATIONS WITHDRAWN
14
$91,874
22
$85,433
76
$75,172
3
$36,663
0
$0
3
$93,267
FILES CLOSED FOR INCOMPLETENESS
1
$106,250
5
$92,316
23
$72,790
3
$63,127
0
$0
3
$71,710
Aggregated Statistics For Year 1999 (Based on 3 partial tracts)
A) FHA, FSA/RHS & VA Home Purchase Loans
B) Conventional Home Purchase Loans
C) Refinancings
D) Home Improvement Loans
F) Non-occupant Loans on < 5 Family Dwellings (A B C & D)
2002 - 2018 National Fire Incident Reporting System (NFIRS) incidents
Based on the data from the years 2002 - 2018 the average number of fires per year is 11. The highest number of reported fires - 21 took place in 2002, and the least - 4 in 2015. The data has a declining trend.
When looking into fire subcategories, the most reports belonged to: Structure Fires (46.2%), and Outside Fires (28.3%).
Fire incident types reported to NFIRS in Zip Code 43137


 Nearest zip codes: 43217, 43116, 43207, 43103, 43125, 43223.


 Based on the data from the years 2002 - 2018 the average number of fires per year is 11. The highest number of reported fires - 21 took place in 2002, and the least - 4 in 2015. The data has a declining trend.
 When looking into fire subcategories, the most reports belonged to: Structure Fires (46.2%), and Outside Fires (28.3%).