Estimated zip code population in 2022: 6,482 Zip code population in 2010: 6,563 Zip code population in 2000: 6,427
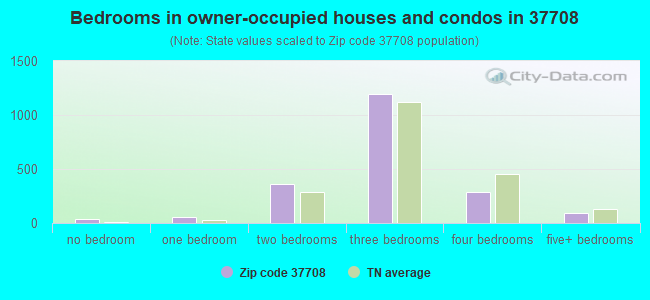
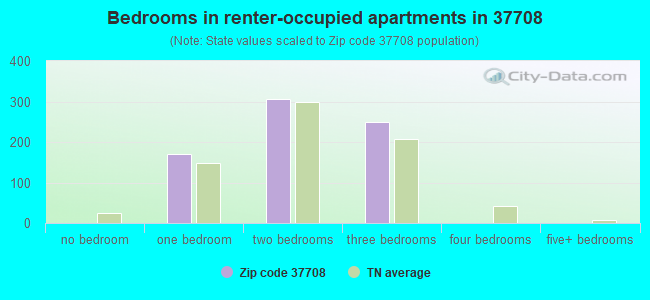
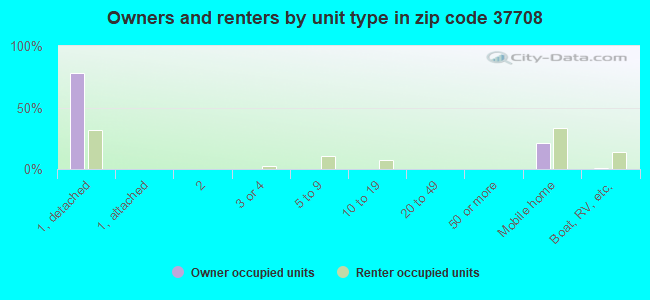
Houses and condos: 3,499 Renter-occupied apartments: 733
% of renters here:
27%
State:
33%
March 2022 cost of living index in zip code 37708: 79.1 (low, U.S. average is 100)
Land area: 42.3 sq. mi. Water area: 10.8 sq. mi.
Population density: 153 people per square mile
(very low).
OSM Map
General Map
Google Map
MSN Map
OSM Map
General Map
Google Map
MSN Map
OSM Map
General Map
Google Map
MSN Map
OSM Map
General Map
Google Map
MSN Map
Please wait while loading the map...
Real estate property taxes paid for housing units in 2022:
This zip code:
0.4% ($757)
Tennessee:
0.5% ($1,376)
Median real estate property taxes paid for housing units with mortgages in 2022: $782 (0.4%) Median real estate property taxes paid for housing units with no mortgage in 2022: $739 (0.4%)
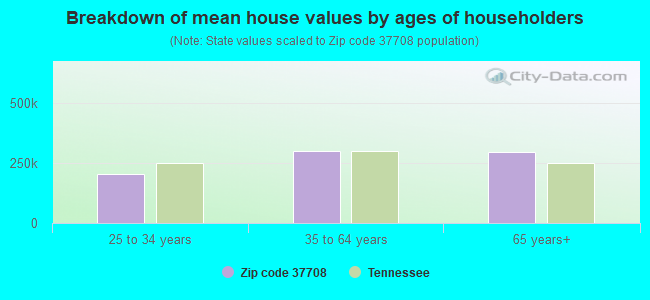
Estimated median house/condo value in 2022: $178,169
37708:
$178,169
Tennessee:
$284,800
According to our research of Tennessee and other state lists, there were 14 registered sex offenders living in 37708 zip code as of June 03, 2024. The ratio of all residents to sex offenders in zip code 37708 is 449 to 1. The ratio of registered sex offenders to all residents in this zip code is lower than the state average.
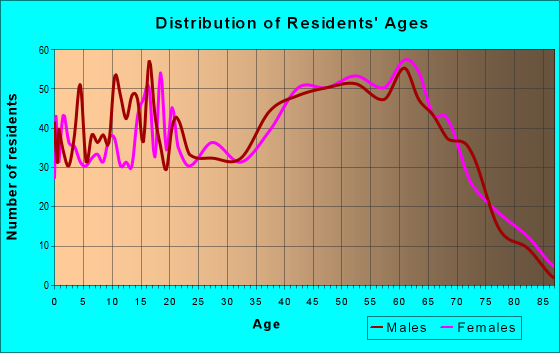
Median resident age:
This zip code:
48.3 years
Tennessee median age:
39.2 years
Average household size:
This zip code:
2.3 people
Tennessee:
2.4 people
Averages for the 2020 tax year for zip code 37708, filed in 2021:
Average Adjusted Gross Income (AGI) in 2020: $48,444 (Individual Income Tax Returns)
Here:
$48,444
State:
$69,014
Salary/wage: $39,572 (reported on 81.7% of returns)
Here:
$39,572
State:
$55,872
(% of AGI for various income ranges: 1181.3% for AGIs below $25k, 3472.5% for AGIs $25k-50k, 6184.9% for AGIs $50k-75k, 8093.3% for AGIs $75k-100k, 13313.5% for AGIs $100k-200k)
Taxable interest for individuals: $1,062 (reported on 24.4% of returns)
This zip code:
$1,062
Tennessee:
$1,945
(% of AGI for various income ranges: 9.3% for AGIs below $25k, 23.0% for AGIs $25k-50k, 41.7% for AGIs $50k-75k, 29.4% for AGIs $75k-100k, 102.9% for AGIs $100k-200k)
Ordinary dividends: $3,783 (reported on 7.4% of returns)
Here:
$3,783
State:
$8,105
(% of AGI for various income ranges: 8.9% for AGIs below $25k, 13.4% for AGIs $25k-50k, 28.9% for AGIs $50k-75k, 43.3% for AGIs $75k-100k, 206.5% for AGIs $100k-200k)
Net capital gain/loss in AGI: +$17,678 (reported on 7.4% of returns)
Here:
+$17,678
State:
+$33,664
(% of AGI for various income ranges: 1.6% for AGIs below $25k, 20.0% for AGIs $25k-50k, 84.6% for AGIs $50k-75k, 109.4% for AGIs $75k-100k, 573.5% for AGIs $100k-200k)
Profit/loss from business: +$11,233 (reported on 13.5% of returns)
Here:
+$11,233
State:
+$18,991
(% of AGI for various income ranges: 117.4% for AGIs below $25k, 122.8% for AGIs $25k-50k, 183.7% for AGIs $50k-75k, 187.2% for AGIs $75k-100k, 1031.2% for AGIs $100k-200k)
Taxable individual retirement arrangement distribution: $15,373 (reported on 7.1% of returns)
37708:
$15,373
Tennessee:
$20,036
(% of AGI for various income ranges: 35.5% for AGIs below $25k, 67.9% for AGIs $25k-50k, 162.0% for AGIs $50k-75k, 447.8% for AGIs $75k-100k, 707.6% for AGIs $100k-200k)
Total itemized deductions: $30,357 (reported on 2.2% of returns)
Here:
$30,357
State:
$40,136
(% of AGI for various income ranges: 105.8% for AGIs $25k-50k, 832.9% for AGIs $100k-200k)
Charity contributions: $10,580 (reported on 1.6% of returns)
Here:
$10,580
State:
$19,852
(% of AGI for various income ranges: 311.2% for AGIs $100k-200k)
Taxes paid: $5,983 (reported on 1.9% of returns)
37708:
$5,983
State:
$6,038
(% of AGI for various income ranges: 7.8% for AGIs below $25k, 165.9% for AGIs $100k-200k)
Earned income credit: $2,276 (reported on 22.8% of returns)
Here:
$2,276
State:
$2,391
(% of AGI for various income ranges: 109.4% for AGIs below $25k, 79.6% for AGIs $25k-50k)
Percentage of individuals using paid preparers for their 2020 taxes: 93.3%
Here:
93%
State:
93%
(% for various income ranges: 91.7% for AGIs below $25k, 95.1% for AGIs $25k-50k, 93.3% for AGIs $50k-75k, 91.7% for AGIs $75k-100k, 96.0% for AGIs $100k-200k, 100.0% for AGIs over 200k)
Averages for the 2012 tax year for zip code 37708, filed in 2013:
Average Adjusted Gross Income (AGI) in 2012: $36,999 (Individual Income Tax Returns)
Here:
$36,999
State:
$53,767
Salary/wage: $32,850 (reported on 84.0% of returns)
Here:
$32,850
State:
$45,421
(% of AGI for various income ranges: 71.3% for AGIs below $25k, 81.8% for AGIs $25k-50k, 81.9% for AGIs $50k-75k, 76.9% for AGIs $75k-100k, 61.1% for AGIs $100k-200k)
Taxable interest for individuals: $1,056 (reported on 26.5% of returns)
This zip code:
$1,056
Tennessee:
$1,732
(% of AGI for various income ranges: 1.9% for AGIs below $25k, 0.7% for AGIs $25k-50k, 0.3% for AGIs $50k-75k, 0.4% for AGIs $75k-100k, 0.6% for AGIs $100k-200k)
Ordinary dividends: $2,047 (reported on 7.4% of returns)
Here:
$2,047
State:
$6,739
(% of AGI for various income ranges: 0.6% for AGIs below $25k, 0.2% for AGIs $25k-50k, 0.5% for AGIs $50k-75k, 0.4% for AGIs $75k-100k, 0.4% for AGIs $100k-200k)
Net capital gain/loss in AGI: +$1,344 (reported on 7.0% of returns)
Here:
+$1,344
State:
+$19,082
(% of AGI for various income ranges: 0.2% for AGIs $25k-50k, 0.1% for AGIs $50k-75k, 0.5% for AGIs $75k-100k, 0.6% for AGIs $100k-200k)
Profit/loss from business: +$9,653 (reported on 14.8% of returns)
Here:
+$9,653
State:
+$15,240
(% of AGI for various income ranges: 10.0% for AGIs below $25k, 2.1% for AGIs $25k-50k, 2.9% for AGIs $50k-75k, 4.0% for AGIs $100k-200k)
Taxable individual retirement arrangement distribution: $13,432 (reported on 7.4% of returns)
37708:
$13,432
Tennessee:
$15,505
(% of AGI for various income ranges: 2.0% for AGIs below $25k, 1.9% for AGIs $25k-50k, 2.6% for AGIs $50k-75k, 5.1% for AGIs $75k-100k, 2.9% for AGIs $100k-200k)
Total itemized deductions: $17,466 (21% of AGI, reported on 11.3% of returns)
Here:
$17,466
State:
$21,976
Here:
20.6% of AGI
State:
17.8% of AGI
(% of AGI for various income ranges: 4.1% for AGIs below $25k, 3.5% for AGIs $25k-50k, 5.9% for AGIs $50k-75k, 5.3% for AGIs $75k-100k, 7.7% for AGIs $100k-200k)
Charity contributions: $3,729 (reported on 8.2% of returns)
Here:
$3,729
State:
$6,709
(% of AGI for various income ranges: 0.3% for AGIs below $25k, 0.4% for AGIs $25k-50k, 0.8% for AGIs $50k-75k, 1.0% for AGIs $75k-100k, 1.6% for AGIs $100k-200k)
Taxes paid: $3,671 (reported on 10.9% of returns)
37708:
$3,671
State:
$4,829
(% of AGI for various income ranges: 0.5% for AGIs below $25k, 0.6% for AGIs $25k-50k, 0.9% for AGIs $50k-75k, 1.2% for AGIs $75k-100k, 2.2% for AGIs $100k-200k)
Earned income credit: $2,158 (reported on 28.4% of returns)
Here:
$2,158
State:
$2,404
(% of AGI for various income ranges: 7.5% for AGIs below $25k, 1.3% for AGIs $25k-50k)
Percentage of individuals using paid preparers for their 2012 taxes: 64.2%
Here:
64%
State:
52%
(% for various income ranges: 62.6% for AGIs below $25k, 66.7% for AGIs $25k-50k, 64.7% for AGIs $50k-75k, 69.2% for AGIs $75k-100k, 61.5% for AGIs $100k-200k)
Averages for the 2004 tax year for zip code 37708, filed in 2005:
Average Adjusted Gross Income (AGI) in 2004: $30,491 (Individual Income Tax Returns)
Here:
$30,491
State:
$44,088
Salary/wage: $28,882 (reported on 86.1% of returns)
Here:
$28,882
State:
$38,825
(% of AGI for various income ranges: 92.1% for AGIs below $10k, 78.6% for AGIs $10k-25k, 86.2% for AGIs $25k-50k, 88.4% for AGIs $50k-75k, 80.4% for AGIs $75k-100k, 60.0% for AGIs over 100k)
Taxable interest for individuals: $1,159 (reported on 31.2% of returns)
This zip code:
$1,159
Tennessee:
$1,802
(% of AGI for various income ranges: 5.1% for AGIs below $10k, 1.7% for AGIs $10k-25k, 0.7% for AGIs $25k-50k, 1.0% for AGIs $50k-75k, 0.9% for AGIs $75k-100k, 1.3% for AGIs over 100k)
Taxable dividends: $2,284 (reported on 8.8% of returns)
Here:
$2,284
State:
$3,727
(% of AGI for various income ranges: 0.6% for AGIs below $10k, 0.5% for AGIs $10k-25k, 0.3% for AGIs $25k-50k, 0.2% for AGIs $50k-75k, 0.2% for AGIs $75k-100k, 3.0% for AGIs over 100k)
Net capital gain/loss: +$7,167 (reported on 7.9% of returns)
Here:
+$7,167
State:
+$15,776
(% of AGI for various income ranges: -1.2% for AGIs below $10k, 0.0% for AGIs $10k-25k, 1.0% for AGIs $25k-50k, 0.3% for AGIs $50k-75k, 0.5% for AGIs $75k-100k, 11.0% for AGIs over 100k)
Profit/loss from business: +$5,940 (reported on 16.0% of returns)
Here:
+$5,940
State:
+$12,882
(% of AGI for various income ranges: 19.6% for AGIs below $10k, 6.1% for AGIs $10k-25k, 2.5% for AGIs $25k-50k, 2.4% for AGIs $50k-75k, 0.4% for AGIs over 100k)
IRA payment deduction: $2,627 (reported on 2.0% of returns)
37708:
$2,627
Tennessee:
$2,934
Total itemized deductions: $14,632 (25% of AGI, reported on 11.4% of returns)
Here:
$14,632
State:
$18,035
Here:
25.0% of AGI
State:
19.9% of AGI
(% of AGI for various income ranges: 3.6% for AGIs $10k-25k, 5.1% for AGIs $25k-50k, 6.4% for AGIs $50k-75k, 8.7% for AGIs $75k-100k, 6.1% for AGIs over 100k)
Charity contributions deductions: $3,253 (5% of AGI, reported on 8.6% of returns)
Here:
$3,253
State:
$5,167
Here:
5.2% of AGI
State:
5.3% of AGI
(% of AGI for various income ranges: 0.5% for AGIs $10k-25k, 0.7% for AGIs $25k-50k, 0.8% for AGIs $50k-75k, 1.8% for AGIs $75k-100k, 2.1% for AGIs over 100k)
Total tax: $3,648 (reported on 70.6% of returns)
37708:
$3,648
State:
$7,482
(% of AGI for various income ranges: 4.3% for AGIs below $10k, 3.7% for AGIs $10k-25k, 6.0% for AGIs $25k-50k, 8.7% for AGIs $50k-75k, 10.4% for AGIs $75k-100k, 20.3% for AGIs over 100k)
Earned income credit: $1,740 (reported on 25.8% of returns)
Here:
$1,740
State:
$1,826
Percentage of individuals using paid preparers for their 2004 taxes: 68.4%
Here:
68%
State:
60%
(% for various income ranges: 65.4% for AGIs below $10k, 70.3% for AGIs $10k-25k, 69.5% for AGIs $25k-50k, 66.7% for AGIs $50k-75k, 60.5% for AGIs $75k-100k, 80.4% for AGIs over 100k)
Household received Food Stamps/SNAP in the past 12 months: 514 Household did not receive Food Stamps/SNAP in the past 12 months: 2,238
Women who had a birth in the past 12 months: 45 (14 now married, 30 unmarried) Women who did not have a birth in the past 12 months: 1,308 (678 now married, 630 unmarried)
Housing units in zip code 37708 with a mortgage: 714 (21 second mortgage, 14 both second mortgage and home equity loan) Houses without a mortgage: 19
Median monthly owner costs for units with a mortgage: $1,071 Median monthly owner costs for units without a mortgage: $334
Residents with income below the poverty level in 2022:
This zip code:
18.2%
Whole state:
13.3%
Residents with income below 50% of the poverty level in 2022:
This zip code:
11.7%
Whole state:
7.1%
Median number of rooms in houses and condos:
Here:
5.8
State:
6.5
Median number of rooms in apartments:
Here:
4.0
State:
4.4
Notable locations in this zip code not listed on our city pages
Notable locations in zip code 37708: Gilmore Dock (A), German Creek Dock (B), German Creek Cabin Area (C), Cornette Dock (D), Bean Station Volunteer Fire Department (E). Display/hide their locations on the map
Churches in zip code 37708 include: Chestnut Grove School (A), Meadow Branch Church (B), Lake Shore Church (C), Light House Church (D), Rock Haven Church (E), Holston Church (F), Bean Station Church (G), Barnards Grove Church (H), Adriel Church (I). Display/hide their locations on the map
Cemeteries: Samsel Cemetery (1), Williams Cemetery (2), Adkins Cemetery (3), Livingston Cemetery (4), Bean Station Cemetery (5), McGinnis Cemetery (6), Meeks Cemetery (7). Display/hide their locations on the map
Streams, rivers, and creeks: Ray Creek (A), Wildcat Branch (B), Miller Branch (C), Gap Branch (D), Briar Fork (E), Shields Creek (F), Annex Creek (G), Nuckles Branch (H), Meadow Branch (I). Display/hide their locations on the map
In group quarters: 13 (-1 institutionalized population)
Size of family households: 964 2-persons, 423 3-persons, 252 4-persons, 120 5-persons, 31 7-or-more-persons
Size of nonfamily households: 895 1-person, 59 2-persons, 11 5-persons
468 married couples with children.
435 single-parent households (193 men, 242 women).
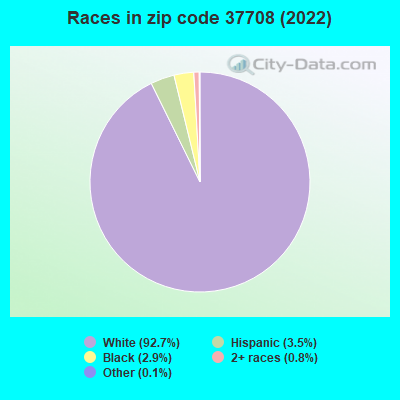
96.2% of residents of 37708 zip code speak English at home.
4.1% of residents speak Spanish at home (34% very well, 27% not well, 39% not at all).
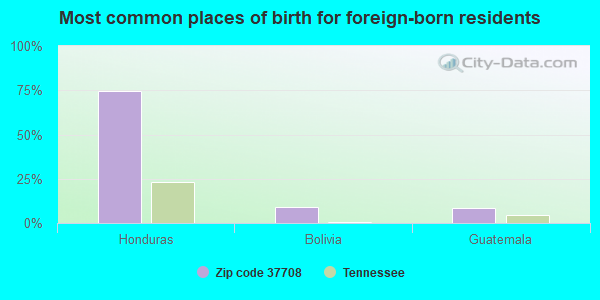
Foreign born population: 166 (2.6%) (6.2% of them are naturalized citizens)
This zip code:
2.6%
Whole state:
5.6%
75%Honduras
9%Bolivia
8%Guatemala
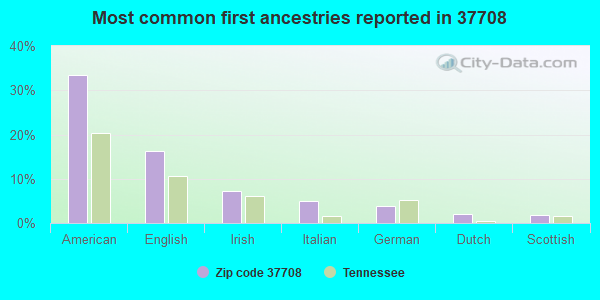
33%American
16%English
7%Irish
5%Italian
4%German
2%Dutch
2%Scottish
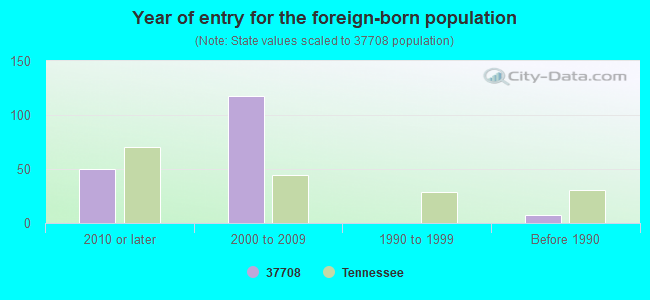
Year of entry for the foreign-born population
502010 or later
1182000 to 2009
01990 to 1999
7Before 1990
Facilities with environmental interests located in this zip code:
BEAN STATION ELEMENTARY SCHOOL (RT 3, BOX 4322 in BEAN STATION, TN)
(Geographic Names Information System) (National Center for Education Statistics) - STATE ID-0005 Organizations: GRAINGER COUNTY SCHOOL DISTRCT (SCHOOL DISTRICT)
CITY OF BEAN STATION (RICK BREWER in BEAN STATION, TN)
National Pollutant Discharge Elimination System NON-MAJOR (Tracking pollutant discharge elimination systems) - permit Business SIC classification: WATER SUPPLY
BEAN STATION CABINET SHOP (LAKESHORE RD in BEAN STATION, TN)
(Resource Conservation and Recovery Act (tracking hazardous waste))
BEAN STATION FRN FACTORY INC (PO BOX 27 in BEAN STATION, TN)
(Resource Conservation and Recovery Act (tracking hazardous waste)) Business NAICS classification: UPHOLSTERED HOUSEHOLD FURNITURE MANUFACTURING.
CHALLENGE CHAIR COMPANY INC (PO BOX 53 in BEAN STATION, TN)
(Resource Conservation and Recovery Act (tracking hazardous waste)) Business NAICS classification: UPHOLSTERED HOUSEHOLD FURNITURE MANUFACTURING.
CHEROKEE MACHINE SHOP (OFF LAKESHORE RD in BEAN STATION, TN)
(Resource Conservation and Recovery Act (tracking hazardous waste)) Business NAICS classification: OTHER COMMERCIAL AND SERVICE INDUSTRY MACHINERY MANUFACTURING.
COLONIAL CABINET CO (PO BOX 151 in BEAN STATION, TN)
(Resource Conservation and Recovery Act (tracking hazardous waste)) Business NAICS classification: NONUPHOLSTERED WOOD HOUSEHOLD FURNITURE MANUFACTURING.
Housing units lacking complete plumbing facilities: 4.7% Housing units lacking complete kitchen facilities: 4.2%
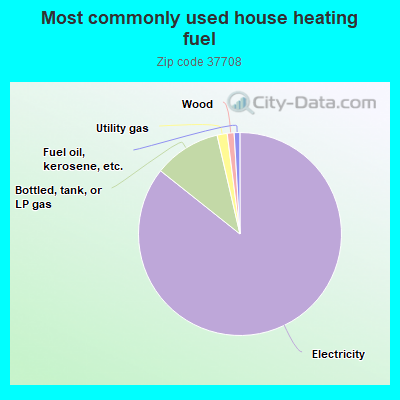
85.1%Electricity
10.6%Bottled, tank, or LP gas
1.6%Utility gas
1.1%Wood
0.9%Fuel oil, kerosene, etc.
Population in 1990: 5,255. Population change in the 1990s: +1,172 (+22.3%).
Place of birth for U.S.-born residents:
This state: 3,878
Northeast: 146
Midwest: 503
South: 1,577
West: 177
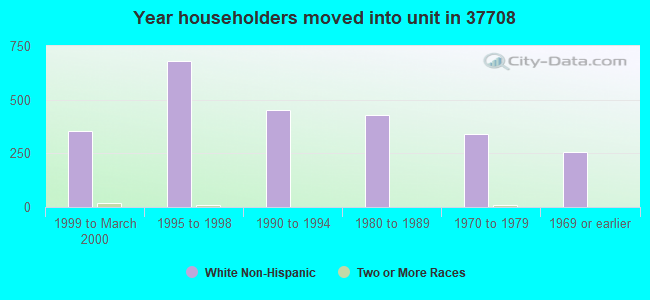
63% of the 37708 zip code residents lived in the same house 5 years ago. Out of people who lived in different houses, 46% lived in this county. Out of people who lived in different counties, 50% lived in Tennessee.
90% of the 37708 zip code residents lived in the same house 1 year ago. Out of people who lived in different houses, 21% moved from this county. Out of people who lived in different houses, 57% moved from different county within same state. Out of people who lived in different houses, 23% moved from different state. Out of people who lived in different houses, 2% moved from abroad.
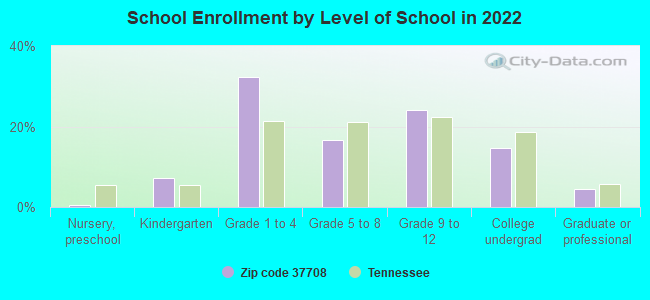
Private vs. public school enrollment:
Students in private schools in grades 1 to 8 (elementary and middle school): 8
Here:
1.6%
Tennessee:
15.0%
Students in private schools in grades 9 to 12 (high school): 39
Here:
15.1%
Tennessee:
16.2%
Students in private undergraduate colleges: 18
Here:
11.5%
Tennessee:
23.5%
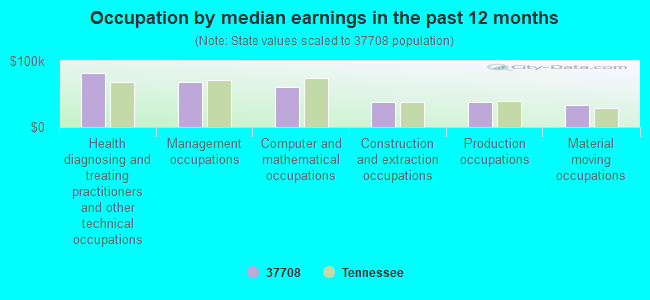
Occupation by median earnings in the past 12 months ($)
81,923Health diagnosing and treating practitioners and other technical occupations
68,038Management occupations
60,469Computer and mathematical occupations
38,407Construction and extraction occupations
38,077Production occupations
33,247Material moving occupations
Companies with federal contracts located in this zip code:
LINDA''S LAKESIDE MARINE INC (436 HWY 25 E in BEAN STATION, TN; small business)
$5,400 with U.S. Army Corps of Engineers - civil program financing only for Small Craft. Signed on 2003-09-26. Completion date: 2003-09-30.
Top industries in this zip code by the number of employees in 2005:
Management of Companies and Enterprises: Corporate, Subsidiary, and Regional Managing Offices (10-19 employees: 1 establishment, 1-4 employees: 1 establishment)
Health Care and Social Assistance: Other Residential Care Facilities (10-19: 1)
Construction: Oil and Gas Pipeline and Related Structures Construction (10-19: 1)
People in group quarters in 2010:
25 people in group homes for juveniles (non-correctional)
2 people in workers' group living quarters and job corps centers
People in group quarters in 2000:
24 people in other noninstitutional group quarters
Fatal accident statistics in 2014:
Fatal accident count: 4
Vehicles involved in fatal accidents: 5
Fatal accidents caused by drunken drivers: 1
Fatalities: 4
Persons involved in fatal accidents: 8
Pedestrians involved in fatal accidents: 0
Fatal accident statistics in 2013:
Fatal accident count: 1
Vehicles involved in fatal accidents: 2
Fatal accidents caused by drunken drivers: 0
Fatalities: 1
Persons involved in fatal accidents: 4
Pedestrians involved in fatal accidents: 0
2004 - 2018 National Fire Incident Reporting System (NFIRS) incidents
According to the data from the years 2004 - 2018 the average number of fires per year is 20. The highest number of fire incidents - 54 took place in 2007, and the least - 2 in 2013. The data has a dropping trend.
When looking into fire subcategories, the most reports belonged to: Outside Fires (40.5%), and Structure Fires (39.8%).
Fire incident types reported to NFIRS in Zip Code 37708
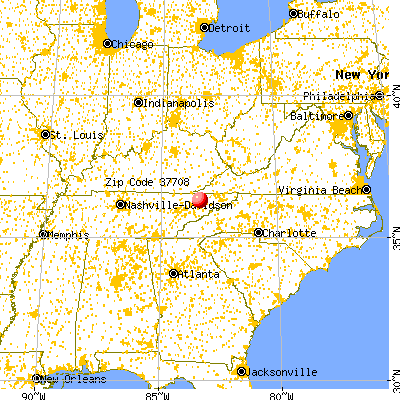


 Nearest zip codes: 37881, 37814, 37811, 37860, 37813, 37891.


 According to the data from the years 2004 - 2018 the average number of fires per year is 20. The highest number of fire incidents - 54 took place in 2007, and the least - 2 in 2013. The data has a dropping trend.
 When looking into fire subcategories, the most reports belonged to: Outside Fires (40.5%), and Structure Fires (39.8%).