Estimated zip code population in 2022: 5,299 Zip code population in 2010: 4,652 Zip code population in 2000: 3,911
Houses and condos: 2,148 Renter-occupied apartments: 301
% of renters here:
15%
State:
33%
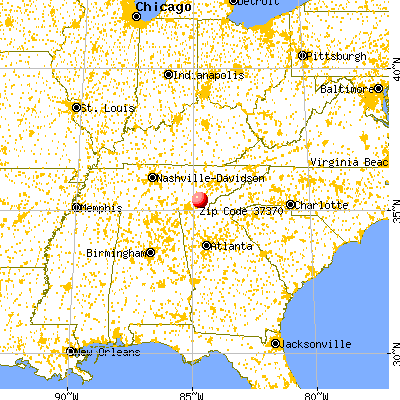
March 2022 cost of living index in zip code 37370: 80.0 (low, U.S. average is 100)
Land area: 63.1 sq. mi. Water area: 0.2 sq. mi.
Population density: 84 people per square mile
(very low).
OSM Map
General Map
Google Map
MSN Map
OSM Map
General Map
Google Map
MSN Map
OSM Map
General Map
Google Map
MSN Map
OSM Map
General Map
Google Map
MSN Map
Please wait while loading the map...
Real estate property taxes paid for housing units in 2022:
This zip code:
0.3% ($711)
Tennessee:
0.5% ($1,376)
Median real estate property taxes paid for housing units with mortgages in 2022: $813 (0.4%) Median real estate property taxes paid for housing units with no mortgage in 2022: $651 (0.2%)
Averages for the 2020 tax year for zip code 37370, filed in 2021:
Average Adjusted Gross Income (AGI) in 2020: $53,440 (Individual Income Tax Returns)
Here:
$53,440
State:
$69,014
Salary/wage: $47,460 (reported on 80.7% of returns)
Here:
$47,460
State:
$55,872
(% of AGI for various income ranges: 1078.4% for AGIs below $25k, 3337.6% for AGIs $25k-50k, 6612.3% for AGIs $50k-75k, 8155.9% for AGIs $75k-100k, 15083.3% for AGIs $100k-200k)
Taxable interest for individuals: $761 (reported on 27.1% of returns)
This zip code:
$761
Tennessee:
$1,945
(% of AGI for various income ranges: 14.0% for AGIs below $25k, 19.6% for AGIs $25k-50k, 40.0% for AGIs $50k-75k, 34.7% for AGIs $75k-100k, 66.1% for AGIs $100k-200k)
Ordinary dividends: $2,264 (reported on 10.1% of returns)
Here:
$2,264
State:
$8,105
(% of AGI for various income ranges: 18.7% for AGIs below $25k, 18.5% for AGIs $25k-50k, 24.6% for AGIs $50k-75k, 38.8% for AGIs $75k-100k, 100.0% for AGIs $100k-200k)
Net capital gain/loss in AGI: +$6,236 (reported on 11.5% of returns)
Here:
+$6,236
State:
+$33,664
(% of AGI for various income ranges: 8.5% for AGIs below $25k, 35.9% for AGIs $25k-50k, 98.5% for AGIs $50k-75k, 55.9% for AGIs $75k-100k, 553.3% for AGIs $100k-200k)
Profit/loss from business: +$11,859 (reported on 15.6% of returns)
Here:
+$11,859
State:
+$18,991
(% of AGI for various income ranges: 131.1% for AGIs below $25k, 180.4% for AGIs $25k-50k, 174.2% for AGIs $50k-75k, 382.9% for AGIs $75k-100k, 765.0% for AGIs $100k-200k)
Taxable individual retirement arrangement distribution: $18,661 (reported on 10.6% of returns)
37370:
$18,661
Tennessee:
$20,036
(% of AGI for various income ranges: 52.0% for AGIs below $25k, 112.8% for AGIs $25k-50k, 273.5% for AGIs $50k-75k, 351.8% for AGIs $75k-100k, 1210.0% for AGIs $100k-200k)
Total itemized deductions: $34,950 (reported on 1.8% of returns)
Here:
$34,950
State:
$40,136
(% of AGI for various income ranges: 155.4% for AGIs $25k-50k, 379.4% for AGIs $100k-200k)
Charity contributions: $10,625 (reported on 1.8% of returns)
Here:
$10,625
State:
$19,852
(% of AGI for various income ranges: 250.0% for AGIs $75k-100k)
Taxes paid: $4,075 (reported on 1.8% of returns)
37370:
$4,075
State:
$6,038
(% of AGI for various income ranges: 8.5% for AGIs below $25k, 64.4% for AGIs $100k-200k)
Earned income credit: $2,132 (reported on 18.3% of returns)
Here:
$2,132
State:
$2,391
(% of AGI for various income ranges: 95.6% for AGIs below $25k, 71.1% for AGIs $25k-50k)
Percentage of individuals using paid preparers for their 2020 taxes: 93.1%
Here:
93%
State:
93%
(% for various income ranges: 93.1% for AGIs below $25k, 92.9% for AGIs $25k-50k, 94.4% for AGIs $50k-75k, 95.5% for AGIs $75k-100k, 93.1% for AGIs $100k-200k, 66.7% for AGIs over 200k)
Averages for the 2012 tax year for zip code 37370, filed in 2013:
Average Adjusted Gross Income (AGI) in 2012: $44,034 (Individual Income Tax Returns)
Here:
$44,034
State:
$53,767
Salary/wage: $41,053 (reported on 81.1% of returns)
Here:
$41,053
State:
$45,421
(% of AGI for various income ranges: 70.4% for AGIs below $25k, 77.4% for AGIs $25k-50k, 77.6% for AGIs $50k-75k, 81.1% for AGIs $75k-100k, 93.6% for AGIs $100k-200k)
Taxable interest for individuals: $1,039 (reported on 29.5% of returns)
This zip code:
$1,039
Tennessee:
$1,732
(% of AGI for various income ranges: 1.1% for AGIs below $25k, 1.0% for AGIs $25k-50k, 0.6% for AGIs $50k-75k, 0.3% for AGIs $75k-100k, 0.7% for AGIs $100k-200k)
Ordinary dividends: $1,662 (reported on 11.1% of returns)
Here:
$1,662
State:
$6,739
(% of AGI for various income ranges: 0.3% for AGIs below $25k, 0.2% for AGIs $25k-50k, 0.4% for AGIs $50k-75k, 0.1% for AGIs $75k-100k, 1.0% for AGIs $100k-200k)
Net capital gain/loss in AGI: +$1,853 (reported on 8.9% of returns)
Here:
+$1,853
State:
+$19,082
(% of AGI for various income ranges: 0.5% for AGIs $25k-50k, 6.7% for AGIs $75k-100k, 1.1% for AGIs $100k-200k)
Profit/loss from business: +$9,543 (reported on 14.7% of returns)
Here:
+$9,543
State:
+$15,240
(% of AGI for various income ranges: 9.7% for AGIs below $25k, 2.4% for AGIs $25k-50k, 0.8% for AGIs $50k-75k, 5.9% for AGIs $100k-200k)
Taxable individual retirement arrangement distribution: $14,631 (reported on 8.4% of returns)
37370:
$14,631
Tennessee:
$15,505
(% of AGI for various income ranges: 1.9% for AGIs below $25k, 3.2% for AGIs $25k-50k, 3.0% for AGIs $50k-75k, 3.2% for AGIs $75k-100k, 3.3% for AGIs $100k-200k)
Total itemized deductions: $18,764 (23% of AGI, reported on 18.9% of returns)
Here:
$18,764
State:
$21,976
Here:
23.3% of AGI
State:
17.8% of AGI
(% of AGI for various income ranges: 6.1% for AGIs below $25k, 6.1% for AGIs $25k-50k, 8.8% for AGIs $50k-75k, 9.5% for AGIs $75k-100k, 11.5% for AGIs $100k-200k)
Charity contributions: $5,770 (reported on 14.2% of returns)
Here:
$5,770
State:
$6,709
(% of AGI for various income ranges: 0.5% for AGIs below $25k, 1.1% for AGIs $25k-50k, 2.0% for AGIs $50k-75k, 2.3% for AGIs $75k-100k, 3.3% for AGIs $100k-200k)
Taxes paid: $2,936 (reported on 18.9% of returns)
37370:
$2,936
State:
$4,829
(% of AGI for various income ranges: 0.8% for AGIs below $25k, 0.8% for AGIs $25k-50k, 1.3% for AGIs $50k-75k, 1.6% for AGIs $75k-100k, 2.0% for AGIs $100k-200k)
Earned income credit: $2,193 (reported on 21.6% of returns)
Here:
$2,193
State:
$2,404
(% of AGI for various income ranges: 6.9% for AGIs below $25k, 1.3% for AGIs $25k-50k)
Percentage of individuals using paid preparers for their 2012 taxes: 59.5%
Here:
59%
State:
52%
(% for various income ranges: 56.8% for AGIs below $25k, 59.6% for AGIs $25k-50k, 62.1% for AGIs $50k-75k, 66.7% for AGIs $75k-100k, 68.8% for AGIs $100k-200k)
Averages for the 2004 tax year for zip code 37370, filed in 2005:
Average Adjusted Gross Income (AGI) in 2004: $36,042 (Individual Income Tax Returns)
Here:
$36,042
State:
$44,088
Salary/wage: $35,497 (reported on 85.3% of returns)
Here:
$35,497
State:
$38,825
(% of AGI for various income ranges: 168.4% for AGIs below $10k, 72.1% for AGIs $10k-25k, 84.5% for AGIs $25k-50k, 88.3% for AGIs $50k-75k, 91.1% for AGIs $75k-100k, 71.8% for AGIs over 100k)
Taxable interest for individuals: $1,323 (reported on 39.0% of returns)
This zip code:
$1,323
Tennessee:
$1,802
(% of AGI for various income ranges: 7.2% for AGIs below $10k, 2.4% for AGIs $10k-25k, 1.2% for AGIs $25k-50k, 1.6% for AGIs $50k-75k, 0.6% for AGIs $75k-100k, 1.4% for AGIs over 100k)
Taxable dividends: $1,494 (reported on 12.4% of returns)
Here:
$1,494
State:
$3,727
(% of AGI for various income ranges: 0.7% for AGIs below $10k, 0.2% for AGIs $10k-25k, 0.3% for AGIs $25k-50k, 0.3% for AGIs $50k-75k, 0.2% for AGIs $75k-100k, 1.6% for AGIs over 100k)
Net capital gain/loss: +$6,585 (reported on 11.0% of returns)
Here:
+$6,585
State:
+$15,776
(% of AGI for various income ranges: -1.2% for AGIs below $10k, 1.4% for AGIs $10k-25k, -0.0% for AGIs $25k-50k, 1.1% for AGIs $50k-75k, 1.0% for AGIs $75k-100k, 7.8% for AGIs over 100k)
Profit/loss from business: +$5,910 (reported on 18.4% of returns)
Here:
+$5,910
State:
+$12,882
(% of AGI for various income ranges: 14.3% for AGIs below $10k, 8.6% for AGIs $10k-25k, 2.1% for AGIs $25k-50k, 2.5% for AGIs $50k-75k, -0.1% for AGIs $75k-100k, 3.3% for AGIs over 100k)
IRA payment deduction: $4,205 (reported on 2.1% of returns)
37370:
$4,205
Tennessee:
$2,934
Total itemized deductions: $15,670 (23% of AGI, reported on 20.0% of returns)
Here:
$15,670
State:
$18,035
Here:
23.4% of AGI
State:
19.9% of AGI
(% of AGI for various income ranges: 4.9% for AGIs $10k-25k, 8.7% for AGIs $25k-50k, 9.2% for AGIs $50k-75k, 9.0% for AGIs $75k-100k, 11.0% for AGIs over 100k)
Charity contributions deductions: $4,645 (7% of AGI, reported on 16.4% of returns)
Here:
$4,645
State:
$5,167
Here:
6.6% of AGI
State:
5.3% of AGI
(% of AGI for various income ranges: 1.0% for AGIs $10k-25k, 1.5% for AGIs $25k-50k, 2.1% for AGIs $50k-75k, 2.6% for AGIs $75k-100k, 3.5% for AGIs over 100k)
Total tax: $4,435 (reported on 75.5% of returns)
37370:
$4,435
State:
$7,482
(% of AGI for various income ranges: 8.4% for AGIs below $10k, 4.5% for AGIs $10k-25k, 6.2% for AGIs $25k-50k, 8.5% for AGIs $50k-75k, 10.7% for AGIs $75k-100k, 16.7% for AGIs over 100k)
Earned income credit: $1,698 (reported on 21.3% of returns)
Here:
$1,698
State:
$1,826
Percentage of individuals using paid preparers for their 2004 taxes: 64.1%
Here:
64%
State:
60%
(% for various income ranges: 63.3% for AGIs below $10k, 63.4% for AGIs $10k-25k, 64.0% for AGIs $25k-50k, 66.7% for AGIs $50k-75k, 63.5% for AGIs $75k-100k, 65.9% for AGIs over 100k)
Household received Food Stamps/SNAP in the past 12 months: 284 Household did not receive Food Stamps/SNAP in the past 12 months: 1,684
Women who did not have a birth in the past 12 months: 1,096 (615 now married, 480 unmarried)
Housing units in zip code 37370 with a mortgage: 945 (109 second mortgage, 95 both second mortgage and home equity loan) Median monthly owner costs for units with a mortgage: $1,173 Median monthly owner costs for units without a mortgage: $367
Residents with income below the poverty level in 2022:
This zip code:
11.3%
Whole state:
13.3%
Residents with income below 50% of the poverty level in 2022:
This zip code:
6.6%
Whole state:
7.1%
Median number of rooms in houses and condos:
Here:
6.4
State:
6.5
Median number of rooms in apartments:
Here:
4.7
State:
4.4
Notable locations in this zip code not listed on our city pages
Notable locations in zip code 37370: McMinn County District 6 Riceville Volunteer Fire Department (A), McMinn County District 8 Hillsview Rural Fire Department (B), McMinn County District 11 Claxton Volunteer Rural Fire Department (C). Display/hide their locations on the map
Churches in zip code 37370 include: Rose Hill Church (A), Spring Creek Church (B), Sanford Church (C), Clay Hill Church (D), Hilltop Church (E), Riceville United Methodist Church (F), First Baptist Church (G), Andrews Chapel (H), Mount Harmony Church (I). Display/hide their locations on the map
Cemeteries: Horton Cemetery (1), Thompson Cemetery (2), Thorn Hill Cemetery (3), Riceville Cemetery (4), Oak Grove Baptist Church Cemetery (5), Hilltop Cemetery (6), Walnut Grove Cemetery (7). Display/hide their locations on the map
Streams, rivers, and creeks: Kibble Branch (A), Acre Spring Branch (B), Jenkins Branch (C), Gregory Branch (D), Brush Creek (E), Boyd Branch (F), North Mouse Creek (G), Wall Hollow Branch (H), Spring Creek (I). Display/hide their locations on the map
In group quarters: 27 (-1 institutionalized population)
Size of family households: 427 2-persons, 363 3-persons, 130 4-persons, 278 6-persons, 57 7-or-more-persons
Size of nonfamily households: 596 1-person, 108 2-persons
499 married couples with children.
454 single-parent households (146 men, 308 women).
92.2% of residents of 37370 zip code speak English at home.
7.2% of residents speak Spanish at home (14% very well, 62% well, 24% not well).
0.5% of residents speak Asian or Pacific Island language at home (100% very well).
Foreign born population: 277 (5.2%) (35.5% of them are naturalized citizens)
This zip code:
5.2%
Whole state:
5.6%
46%Guatemala
27%Honduras
7%United Kingdom, excluding England and Scotland
5%Sweden
2%Scotland
26%German
16%American
8%English
6%Italian
4%Irish
2%Scottish
1%Portuguese
Year of entry for the foreign-born population
02010 or later
1432000 to 2009
01990 to 1999
134Before 1990
Housing units lacking complete plumbing facilities: 2.6% Housing units lacking complete kitchen facilities: 5.4%
68.8%Electricity
22.1%Utility gas
7.6%Wood
1.0%Fuel oil, kerosene, etc.
0.8%Bottled, tank, or LP gas
Population in 1990: 2,785. Population change in the 1990s: +1,126 (+40.4%).
Place of birth for U.S.-born residents:
This state: 3,260
Northeast: 148
Midwest: 577
South: 639
West: 364
57% of the 37370 zip code residents lived in the same house 5 years ago. Out of people who lived in different houses, 58% lived in this county. Out of people who lived in different counties, 50% lived in Tennessee.
86% of the 37370 zip code residents lived in the same house 1 year ago. Out of people who lived in different houses, 38% moved from this county. Out of people who lived in different houses, 48% moved from different county within same state. Out of people who lived in different houses, 12% moved from different state.
Private vs. public school enrollment:
Students in private schools in grades 1 to 8 (elementary and middle school): 57
Here:
11.7%
Tennessee:
15.0%
Students in private schools in grades 9 to 12 (high school): 57
Here:
14.5%
Tennessee:
16.2%
Students in private undergraduate colleges: 83
Here:
84.5%
Tennessee:
23.5%
Occupation by median earnings in the past 12 months ($)
135,674Transportation occupations
86,323Business and financial operations occupations
79,588Health diagnosing and treating practitioners and other technical occupations
53,489Education, training, and library occupations
47,566Material moving occupations
45,017Office and administrative support occupations
Companies with federal contracts located in this zip code:
OMNI SERVICES, INC (MC MINN COUNTY ROAD 701 in RICEVILLE, TN; small business) 18 employees, $1428389 revenue.
$38,000 with Tennessee Valley Authority for Maintenance, Repair and Rebuilding of Equipment -- Prefabricated Structures and Scaffolding. Signed on 1999-11-15. Completion date: 1999-12-15.
Top industries in this zip code by the number of employees in 2005:
Other Services (except Public Administration): Religious Organizations (5-9 employees: 2 establishments, 1-4 employees: 5 establishments)
Health Care and Social Assistance: Nursing Care Facilities (10-19: 1)
Administrative and Support and Waste Management and Remediation Services: Exterminating and Pest Control Services (10-19: 1)
Construction: Commercial and Institutional Building Construction (10-19: 1)
Wholesale Trade: Farm and Garden Machinery and Equipment Merchant Wholesalers (5-9: 1)
Administrative and Support and Waste Management and Remediation Services: All Other Support Services (5-9: 1)
People in group quarters in 2010:
17 people in nursing facilities/skilled-nursing facilities
9 people in residential treatment centers for adults
People in group quarters in 2000:
10 people in other noninstitutional group quarters
Fatal accident statistics in 2014:
Fatal accident count: 1
Vehicles involved in fatal accidents: 1
Fatal accidents caused by drunken drivers: 1
Fatalities: 1
Persons involved in fatal accidents: 1
Pedestrians involved in fatal accidents: 0
Fatal accident statistics in 2012:
Fatal accident count: 4
Vehicles involved in fatal accidents: 7
Fatal accidents caused by drunken drivers: 2
Fatalities: 4
Persons involved in fatal accidents: 16
Pedestrians involved in fatal accidents: 0
2002 - 2018 National Fire Incident Reporting System (NFIRS) incidents
Based on the data from the years 2002 - 2018 the average number of fires per year is 40. The highest number of reported fires - 85 took place in 2014, and the least - 3 in 2003. The data has a growing trend.
When looking into fire subcategories, the most reports belonged to: Outside Fires (42.4%), and Structure Fires (37.3%).
Fire incident types reported to NFIRS in Zip Code 37370


 Nearest zip codes: 37309, 37303, 37310, 37325, 37331, 37322.


 Based on the data from the years 2002 - 2018 the average number of fires per year is 40. The highest number of reported fires - 85 took place in 2014, and the least - 3 in 2003. The data has a growing trend.
 When looking into fire subcategories, the most reports belonged to: Outside Fires (42.4%), and Structure Fires (37.3%).