Estimated zip code population in 2022: 75,014
Zip code population in 2010: 38,966
Zip code population in 2000: 18,017
Houses and condos: 28,775
Renter-occupied apartments: 9,285
% of renters here:
34%State:
33%
March 2022 cost of living index in zip code 37128: 90.1
(less than average, U.S. average is 100)
Land area: 54.0
sq. mi.
Water area: 0.1
sq. mi.
Population density: 1,388 people per square mile (low).
OSM Map
General Map
Google Map
MSN Map
OSM Map
General Map
Google Map
MSN Map
OSM Map
General Map
Google Map
MSN Map
OSM Map
General Map
Google Map
MSN Map
Please wait while loading the map...
Real estate property taxes paid for housing units in 2022:
This zip code:
0.5% ($1,892)Tennessee:
0.5% ($1,376)
Median real estate property taxes paid for housing units with mortgages in 2022: $1,858 (0.4%)
Median real estate property taxes paid for housing units with no mortgage in 2022: $2,075 (0.5%)
Profiles of local businesses
Business Search - 14 Million verified businesses
Males: 36,977 Females: 38,036
For population 25 years and over in 37128:
High school or higher: 97.4%Bachelor's degree or higher: 40.5%Graduate or professional degree: 12.7%Unemployed: 2.1%Mean travel time to work (commute): 29.4 minutes
For population 15 years and over in 37128:
Never married: 32.6%Now married: 54.2%Separated: 1.2%Widowed: 2.6%Divorced: 9.4%
Zip code 37128 compared to state average:
Median age below state average. House age significantly below state average. 52,210 69.6% White 10,432 13.9% Black 4,713 6.3% Two or more races 4,069 5.4% Hispanic or Latino 3,360 4.5% Asian 158 0.2% Some other race 68 0.09% Native Hawaiian and Other
Data:
Median household income ($)
Median household income (% change since 2000)
Household income diversity
Ratio of average income to average house value (%)
Ratio of average income to average rent
Median household income ($) - White
Median household income ($) - Black or African American
Median household income ($) - Asian
Median household income ($) - Hispanic or Latino
Median household income ($) - American Indian and Alaska Native
Median household income ($) - Multirace
Median household income ($) - Other Race
Median household income for houses/condos with a mortgage ($)
Median household income for apartments without a mortgage ($)
Races - White alone (%)
Races - White alone (% change since 2000)
Races - Black alone (%)
Races - Black alone (% change since 2000)
Races - American Indian alone (%)
Races - American Indian alone (% change since 2000)
Races - Asian alone (%)
Races - Asian alone (% change since 2000)
Races - Hispanic (%)
Races - Hispanic (% change since 2000)
Races - Native Hawaiian and Other Pacific Islander alone (%)
Races - Native Hawaiian and Other Pacific Islander alone (% change since 2000)
Races - Two or more races (%)
Races - Two or more races (% change since 2000)
Races - Other race alone (%)
Races - Other race alone (% change since 2000)
Racial diversity
Unemployment (%)
Unemployment (% change since 2000)
Unemployment (%) - White
Unemployment (%) - Black or African American
Unemployment (%) - Asian
Unemployment (%) - Hispanic or Latino
Unemployment (%) - American Indian and Alaska Native
Unemployment (%) - Multirace
Unemployment (%) - Other Race
Population density (people per square mile)
Population - Males (%)
Population - Females (%)
Population - Males (%) - White
Population - Males (%) - Black or African American
Population - Males (%) - Asian
Population - Males (%) - Hispanic or Latino
Population - Males (%) - American Indian and Alaska Native
Population - Males (%) - Multirace
Population - Males (%) - Other Race
Population - Females (%) - White
Population - Females (%) - Black or African American
Population - Females (%) - Asian
Population - Females (%) - Hispanic or Latino
Population - Females (%) - American Indian and Alaska Native
Population - Females (%) - Multirace
Population - Females (%) - Other Race
Coronavirus confirmed cases (May 29, 2024)
Deaths caused by coronavirus (May 29, 2024)
Coronavirus confirmed cases (per 100k population) (May 29, 2024)
Deaths caused by coronavirus (per 100k population) (May 29, 2024)
Daily increase in number of cases (May 29, 2024)
Weekly increase in number of cases (May 29, 2024)
Cases doubled (in days) (May 29, 2024)
Hospitalized patients (Apr 18, 2022)
Negative test results (Apr 18, 2022)
Total test results (Apr 18, 2022)
COVID Vaccine doses distributed (per 100k population) (Sep 19, 2023)
COVID Vaccine doses administered (per 100k population) (Sep 19, 2023)
COVID Vaccine doses distributed (Sep 19, 2023)
COVID Vaccine doses administered (Sep 19, 2023)
Likely homosexual households (%)
Likely homosexual households (% change since 2000)
Likely homosexual households - Lesbian couples (%)
Likely homosexual households - Lesbian couples (% change since 2000)
Likely homosexual households - Gay men (%)
Likely homosexual households - Gay men (% change since 2000)
Cost of living index
Median gross rent ($)
Median contract rent ($)
Median monthly housing costs ($)
Median house or condo value ($)
Median house or condo value ($ change since 2000)
Mean house or condo value by units in structure - 1, detached ($)
Mean house or condo value by units in structure - 1, attached ($)
Mean house or condo value by units in structure - 2 ($)
Mean house or condo value by units in structure by units in structure - 3 or 4 ($)
Mean house or condo value by units in structure - 5 or more ($)
Mean house or condo value by units in structure - Boat, RV, van, etc. ($)
Mean house or condo value by units in structure - Mobile home ($)
Median house or condo value ($) - White
Median house or condo value ($) - Black or African American
Median house or condo value ($) - Asian
Median house or condo value ($) - Hispanic or Latino
Median house or condo value ($) - American Indian and Alaska Native
Median house or condo value ($) - Multirace
Median house or condo value ($) - Other Race
Median resident age
Resident age diversity
Median resident age - Males
Median resident age - Females
Median resident age - White
Median resident age - Black or African American
Median resident age - Asian
Median resident age - Hispanic or Latino
Median resident age - American Indian and Alaska Native
Median resident age - Multirace
Median resident age - Other Race
Median resident age - Males - White
Median resident age - Males - Black or African American
Median resident age - Males - Asian
Median resident age - Males - Hispanic or Latino
Median resident age - Males - American Indian and Alaska Native
Median resident age - Males - Multirace
Median resident age - Males - Other Race
Median resident age - Females - White
Median resident age - Females - Black or African American
Median resident age - Females - Asian
Median resident age - Females - Hispanic or Latino
Median resident age - Females - American Indian and Alaska Native
Median resident age - Females - Multirace
Median resident age - Females - Other Race
Commute - mean travel time to work (minutes)
Travel time to work - Less than 5 minutes (%)
Travel time to work - Less than 5 minutes (% change since 2000)
Travel time to work - 5 to 9 minutes (%)
Travel time to work - 5 to 9 minutes (% change since 2000)
Travel time to work - 10 to 19 minutes (%)
Travel time to work - 10 to 19 minutes (% change since 2000)
Travel time to work - 20 to 29 minutes (%)
Travel time to work - 20 to 29 minutes (% change since 2000)
Travel time to work - 30 to 39 minutes (%)
Travel time to work - 30 to 39 minutes (% change since 2000)
Travel time to work - 40 to 59 minutes (%)
Travel time to work - 40 to 59 minutes (% change since 2000)
Travel time to work - 60 to 89 minutes (%)
Travel time to work - 60 to 89 minutes (% change since 2000)
Travel time to work - 90 or more minutes (%)
Travel time to work - 90 or more minutes (% change since 2000)
Marital status - Never married (%)
Marital status - Now married (%)
Marital status - Separated (%)
Marital status - Widowed (%)
Marital status - Divorced (%)
Median family income ($)
Median family income (% change since 2000)
Median non-family income ($)
Median non-family income (% change since 2000)
Median per capita income ($)
Median per capita income (% change since 2000)
Median family income ($) - White
Median family income ($) - Black or African American
Median family income ($) - Asian
Median family income ($) - Hispanic or Latino
Median family income ($) - American Indian and Alaska Native
Median family income ($) - Multirace
Median family income ($) - Other Race
Median year house/condo built
Median year apartment built
Year house built - Built 2005 or later (%)
Year house built - Built 2000 to 2004 (%)
Year house built - Built 1990 to 1999 (%)
Year house built - Built 1980 to 1989 (%)
Year house built - Built 1970 to 1979 (%)
Year house built - Built 1960 to 1969 (%)
Year house built - Built 1950 to 1959 (%)
Year house built - Built 1940 to 1949 (%)
Year house built - Built 1939 or earlier (%)
Average household size
Household density (households per square mile)
Average household size - White
Average household size - Black or African American
Average household size - Asian
Average household size - Hispanic or Latino
Average household size - American Indian and Alaska Native
Average household size - Multirace
Average household size - Other Race
Occupied housing units (%)
Vacant housing units (%)
Owner occupied housing units (%)
Renter occupied housing units (%)
Vacancy status - For rent (%)
Vacancy status - For sale only (%)
Vacancy status - Rented or sold, not occupied (%)
Vacancy status - For seasonal, recreational, or occasional use (%)
Vacancy status - For migrant workers (%)
Vacancy status - Other vacant (%)
Residents with income below the poverty level (%)
Residents with income below 50% of the poverty level (%)
Children below poverty level (%)
Poor families by family type - Married-couple family (%)
Poor families by family type - Male, no wife present (%)
Poor families by family type - Female, no husband present (%)
Poverty status for native-born residents (%)
Poverty status for foreign-born residents (%)
Poverty among high school graduates not in families (%)
Poverty among people who did not graduate high school not in families (%)
Residents with income below the poverty level (%) - White
Residents with income below the poverty level (%) - Black or African American
Residents with income below the poverty level (%) - Asian
Residents with income below the poverty level (%) - Hispanic or Latino
Residents with income below the poverty level (%) - American Indian and Alaska Native
Residents with income below the poverty level (%) - Multirace
Residents with income below the poverty level (%) - Other Race
Air pollution - Air Quality Index (AQI)
Air pollution - CO
Air pollution - NO2
Air pollution - SO2
Air pollution - Ozone
Air pollution - PM10
Air pollution - PM25
Air pollution - Pb
Crime - Murders per 100,000 population
Crime - Rapes per 100,000 population
Crime - Robberies per 100,000 population
Crime - Assaults per 100,000 population
Crime - Burglaries per 100,000 population
Crime - Thefts per 100,000 population
Crime - Auto thefts per 100,000 population
Crime - Arson per 100,000 population
Crime - City-data.com crime index
Crime - Violent crime index
Crime - Property crime index
Crime - Murders per 100,000 population (5 year average)
Crime - Rapes per 100,000 population (5 year average)
Crime - Robberies per 100,000 population (5 year average)
Crime - Assaults per 100,000 population (5 year average)
Crime - Burglaries per 100,000 population (5 year average)
Crime - Thefts per 100,000 population (5 year average)
Crime - Auto thefts per 100,000 population (5 year average)
Crime - Arson per 100,000 population (5 year average)
Crime - City-data.com crime index (5 year average)
Crime - Violent crime index (5 year average)
Crime - Property crime index (5 year average)
1996 Presidential Elections Results (%) - Democratic Party (Clinton)
1996 Presidential Elections Results (%) - Republican Party (Dole)
1996 Presidential Elections Results (%) - Other
2000 Presidential Elections Results (%) - Democratic Party (Gore)
2000 Presidential Elections Results (%) - Republican Party (Bush)
2000 Presidential Elections Results (%) - Other
2004 Presidential Elections Results (%) - Democratic Party (Kerry)
2004 Presidential Elections Results (%) - Republican Party (Bush)
2004 Presidential Elections Results (%) - Other
2008 Presidential Elections Results (%) - Democratic Party (Obama)
2008 Presidential Elections Results (%) - Republican Party (McCain)
2008 Presidential Elections Results (%) - Other
2012 Presidential Elections Results (%) - Democratic Party (Obama)
2012 Presidential Elections Results (%) - Republican Party (Romney)
2012 Presidential Elections Results (%) - Other
2016 Presidential Elections Results (%) - Democratic Party (Clinton)
2016 Presidential Elections Results (%) - Republican Party (Trump)
2016 Presidential Elections Results (%) - Other
2020 Presidential Elections Results (%) - Democratic Party (Biden)
2020 Presidential Elections Results (%) - Republican Party (Trump)
2020 Presidential Elections Results (%) - Other
Ancestries Reported - Arab (%)
Ancestries Reported - Czech (%)
Ancestries Reported - Danish (%)
Ancestries Reported - Dutch (%)
Ancestries Reported - English (%)
Ancestries Reported - French (%)
Ancestries Reported - French Canadian (%)
Ancestries Reported - German (%)
Ancestries Reported - Greek (%)
Ancestries Reported - Hungarian (%)
Ancestries Reported - Irish (%)
Ancestries Reported - Italian (%)
Ancestries Reported - Lithuanian (%)
Ancestries Reported - Norwegian (%)
Ancestries Reported - Polish (%)
Ancestries Reported - Portuguese (%)
Ancestries Reported - Russian (%)
Ancestries Reported - Scotch-Irish (%)
Ancestries Reported - Scottish (%)
Ancestries Reported - Slovak (%)
Ancestries Reported - Subsaharan African (%)
Ancestries Reported - Swedish (%)
Ancestries Reported - Swiss (%)
Ancestries Reported - Ukrainian (%)
Ancestries Reported - United States (%)
Ancestries Reported - Welsh (%)
Ancestries Reported - West Indian (%)
Ancestries Reported - Other (%)
Educational Attainment - No schooling completed (%)
Educational Attainment - Less than high school (%)
Educational Attainment - High school or equivalent (%)
Educational Attainment - Less than 1 year of college (%)
Educational Attainment - 1 or more years of college (%)
Educational Attainment - Associate degree (%)
Educational Attainment - Bachelor's degree (%)
Educational Attainment - Master's degree (%)
Educational Attainment - Professional school degree (%)
Educational Attainment - Doctorate degree (%)
School Enrollment - Nursery, preschool (%)
School Enrollment - Kindergarten (%)
School Enrollment - Grade 1 to 4 (%)
School Enrollment - Grade 5 to 8 (%)
School Enrollment - Grade 9 to 12 (%)
School Enrollment - College undergrad (%)
School Enrollment - Graduate or professional (%)
School Enrollment - Not enrolled in school (%)
School enrollment - Public schools (%)
School enrollment - Private schools (%)
School enrollment - Not enrolled (%)
Median number of rooms in houses and condos
Median number of rooms in apartments
Housing units lacking complete plumbing facilities (%)
Housing units lacking complete kitchen facilities (%)
Density of houses
Urban houses (%)
Rural houses (%)
Households with people 60 years and over (%)
Households with people 65 years and over (%)
Households with people 75 years and over (%)
Households with one or more nonrelatives (%)
Households with no nonrelatives (%)
Population in households (%)
Family households (%)
Nonfamily households (%)
Population in families (%)
Family households with own children (%)
Median number of bedrooms in owner occupied houses
Mean number of bedrooms in owner occupied houses
Median number of bedrooms in renter occupied houses
Mean number of bedrooms in renter occupied houses
Median number of vehichles in owner occupied houses
Mean number of vehichles in owner occupied houses
Median number of vehichles in renter occupied houses
Mean number of vehichles in renter occupied houses
Mortgage status - with mortgage (%)
Mortgage status - with second mortgage (%)
Mortgage status - with home equity loan (%)
Mortgage status - with both second mortgage and home equity loan (%)
Mortgage status - without a mortgage (%)
Average family size
Average family size - White
Average family size - Black or African American
Average family size - Asian
Average family size - Hispanic or Latino
Average family size - American Indian and Alaska Native
Average family size - Multirace
Average family size - Other Race
Geographical mobility - Same house 1 year ago (%)
Geographical mobility - Moved within same county (%)
Geographical mobility - Moved from different county within same state (%)
Geographical mobility - Moved from different state (%)
Geographical mobility - Moved from abroad (%)
Place of birth - Born in state of residence (%)
Place of birth - Born in other state (%)
Place of birth - Native, outside of US (%)
Place of birth - Foreign born (%)
Housing units in structures - 1, detached (%)
Housing units in structures - 1, attached (%)
Housing units in structures - 2 (%)
Housing units in structures - 3 or 4 (%)
Housing units in structures - 5 to 9 (%)
Housing units in structures - 10 to 19 (%)
Housing units in structures - 20 to 49 (%)
Housing units in structures - 50 or more (%)
Housing units in structures - Mobile home (%)
Housing units in structures - Boat, RV, van, etc. (%)
House/condo owner moved in on average (years ago)
Renter moved in on average (years ago)
Year householder moved into unit - Moved in 1999 to March 2000 (%)
Year householder moved into unit - Moved in 1995 to 1998 (%)
Year householder moved into unit - Moved in 1990 to 1994 (%)
Year householder moved into unit - Moved in 1980 to 1989 (%)
Year householder moved into unit - Moved in 1970 to 1979 (%)
Year householder moved into unit - Moved in 1969 or earlier (%)
Means of transportation to work - Drove car alone (%)
Means of transportation to work - Carpooled (%)
Means of transportation to work - Public transportation (%)
Means of transportation to work - Bus or trolley bus (%)
Means of transportation to work - Streetcar or trolley car (%)
Means of transportation to work - Subway or elevated (%)
Means of transportation to work - Railroad (%)
Means of transportation to work - Ferryboat (%)
Means of transportation to work - Taxicab (%)
Means of transportation to work - Motorcycle (%)
Means of transportation to work - Bicycle (%)
Means of transportation to work - Walked (%)
Means of transportation to work - Other means (%)
Working at home (%)
Industry diversity
Most Common Industries - Agriculture, forestry, fishing and hunting, and mining (%)
Most Common Industries - Agriculture, forestry, fishing and hunting (%)
Most Common Industries - Mining, quarrying, and oil and gas extraction (%)
Most Common Industries - Construction (%)
Most Common Industries - Manufacturing (%)
Most Common Industries - Wholesale trade (%)
Most Common Industries - Retail trade (%)
Most Common Industries - Transportation and warehousing, and utilities (%)
Most Common Industries - Transportation and warehousing (%)
Most Common Industries - Utilities (%)
Most Common Industries - Information (%)
Most Common Industries - Finance and insurance, and real estate and rental and leasing (%)
Most Common Industries - Finance and insurance (%)
Most Common Industries - Real estate and rental and leasing (%)
Most Common Industries - Professional, scientific, and management, and administrative and waste management services (%)
Most Common Industries - Professional, scientific, and technical services (%)
Most Common Industries - Management of companies and enterprises (%)
Most Common Industries - Administrative and support and waste management services (%)
Most Common Industries - Educational services, and health care and social assistance (%)
Most Common Industries - Educational services (%)
Most Common Industries - Health care and social assistance (%)
Most Common Industries - Arts, entertainment, and recreation, and accommodation and food services (%)
Most Common Industries - Arts, entertainment, and recreation (%)
Most Common Industries - Accommodation and food services (%)
Most Common Industries - Other services, except public administration (%)
Most Common Industries - Public administration (%)
Occupation diversity
Most Common Occupations - Management, business, science, and arts occupations (%)
Most Common Occupations - Management, business, and financial occupations (%)
Most Common Occupations - Management occupations (%)
Most Common Occupations - Business and financial operations occupations (%)
Most Common Occupations - Computer, engineering, and science occupations (%)
Most Common Occupations - Computer and mathematical occupations (%)
Most Common Occupations - Architecture and engineering occupations (%)
Most Common Occupations - Life, physical, and social science occupations (%)
Most Common Occupations - Education, legal, community service, arts, and media occupations (%)
Most Common Occupations - Community and social service occupations (%)
Most Common Occupations - Legal occupations (%)
Most Common Occupations - Education, training, and library occupations (%)
Most Common Occupations - Arts, design, entertainment, sports, and media occupations (%)
Most Common Occupations - Healthcare practitioners and technical occupations (%)
Most Common Occupations - Health diagnosing and treating practitioners and other technical occupations (%)
Most Common Occupations - Health technologists and technicians (%)
Most Common Occupations - Service occupations (%)
Most Common Occupations - Healthcare support occupations (%)
Most Common Occupations - Protective service occupations (%)
Most Common Occupations - Fire fighting and prevention, and other protective service workers including supervisors (%)
Most Common Occupations - Law enforcement workers including supervisors (%)
Most Common Occupations - Food preparation and serving related occupations (%)
Most Common Occupations - Building and grounds cleaning and maintenance occupations (%)
Most Common Occupations - Personal care and service occupations (%)
Most Common Occupations - Sales and office occupations (%)
Most Common Occupations - Sales and related occupations (%)
Most Common Occupations - Office and administrative support occupations (%)
Most Common Occupations - Natural resources, construction, and maintenance occupations (%)
Most Common Occupations - Farming, fishing, and forestry occupations (%)
Most Common Occupations - Construction and extraction occupations (%)
Most Common Occupations - Installation, maintenance, and repair occupations (%)
Most Common Occupations - Production, transportation, and material moving occupations (%)
Most Common Occupations - Production occupations (%)
Most Common Occupations - Transportation occupations (%)
Most Common Occupations - Material moving occupations (%)
People in Group quarters - Institutionalized population (%)
People in Group quarters - Correctional institutions (%)
People in Group quarters - Federal prisons and detention centers (%)
People in Group quarters - Halfway houses (%)
People in Group quarters - Local jails and other confinement facilities (including police lockups) (%)
People in Group quarters - Military disciplinary barracks (%)
People in Group quarters - State prisons (%)
People in Group quarters - Other types of correctional institutions (%)
People in Group quarters - Nursing homes (%)
People in Group quarters - Hospitals/wards, hospices, and schools for the handicapped (%)
People in Group quarters - Hospitals/wards and hospices for chronically ill (%)
People in Group quarters - Hospices or homes for chronically ill (%)
People in Group quarters - Military hospitals or wards for chronically ill (%)
People in Group quarters - Other hospitals or wards for chronically ill (%)
People in Group quarters - Hospitals or wards for drug/alcohol abuse (%)
People in Group quarters - Mental (Psychiatric) hospitals or wards (%)
People in Group quarters - Schools, hospitals, or wards for the mentally retarded (%)
People in Group quarters - Schools, hospitals, or wards for the physically handicapped (%)
People in Group quarters - Institutions for the deaf (%)
People in Group quarters - Institutions for the blind (%)
People in Group quarters - Orthopedic wards and institutions for the physically handicapped (%)
People in Group quarters - Wards in general hospitals for patients who have no usual home elsewhere (%)
People in Group quarters - Wards in military hospitals for patients who have no usual home elsewhere (%)
People in Group quarters - Juvenile institutions (%)
People in Group quarters - Long-term care (%)
People in Group quarters - Homes for abused, dependent, and neglected children (%)
People in Group quarters - Residential treatment centers for emotionally disturbed children (%)
People in Group quarters - Training schools for juvenile delinquents (%)
People in Group quarters - Short-term care, detention or diagnostic centers for delinquent children (%)
People in Group quarters - Type of juvenile institution unknown (%)
People in Group quarters - Noninstitutionalized population (%)
People in Group quarters - College dormitories (includes college quarters off campus) (%)
People in Group quarters - Military quarters (%)
People in Group quarters - On base (%)
People in Group quarters - Barracks, unaccompanied personnel housing (UPH), (Enlisted/Officer), ;and similar group living quarters for military personnel (%)
People in Group quarters - Transient quarters for temporary residents (%)
People in Group quarters - Military ships (%)
People in Group quarters - Group homes (%)
People in Group quarters - Homes or halfway houses for drug/alcohol abuse (%)
People in Group quarters - Homes for the mentally ill (%)
People in Group quarters - Homes for the mentally retarded (%)
People in Group quarters - Homes for the physically handicapped (%)
People in Group quarters - Other group homes (%)
People in Group quarters - Religious group quarters (%)
People in Group quarters - Dormitories (%)
People in Group quarters - Agriculture workers' dormitories on farms (%)
People in Group quarters - Job Corps and vocational training facilities (%)
People in Group quarters - Other workers' dormitories (%)
People in Group quarters - Crews of maritime vessels (%)
People in Group quarters - Other nonhousehold living situations (%)
People in Group quarters - Other noninstitutional group quarters (%)
Residents speaking English at home (%)
Residents speaking English at home - Born in the United States (%)
Residents speaking English at home - Native, born elsewhere (%)
Residents speaking English at home - Foreign born (%)
Residents speaking Spanish at home (%)
Residents speaking Spanish at home - Born in the United States (%)
Residents speaking Spanish at home - Native, born elsewhere (%)
Residents speaking Spanish at home - Foreign born (%)
Residents speaking other language at home (%)
Residents speaking other language at home - Born in the United States (%)
Residents speaking other language at home - Native, born elsewhere (%)
Residents speaking other language at home - Foreign born (%)
Class of Workers - Employee of private company (%)
Class of Workers - Self-employed in own incorporated business (%)
Class of Workers - Private not-for-profit wage and salary workers (%)
Class of Workers - Local government workers (%)
Class of Workers - State government workers (%)
Class of Workers - Federal government workers (%)
Class of Workers - Self-employed workers in own not incorporated business and Unpaid family workers (%)
House heating fuel used in houses and condos - Utility gas (%)
House heating fuel used in houses and condos - Bottled, tank, or LP gas (%)
House heating fuel used in houses and condos - Electricity (%)
House heating fuel used in houses and condos - Fuel oil, kerosene, etc. (%)
House heating fuel used in houses and condos - Coal or coke (%)
House heating fuel used in houses and condos - Wood (%)
House heating fuel used in houses and condos - Solar energy (%)
House heating fuel used in houses and condos - Other fuel (%)
House heating fuel used in houses and condos - No fuel used (%)
House heating fuel used in apartments - Utility gas (%)
House heating fuel used in apartments - Bottled, tank, or LP gas (%)
House heating fuel used in apartments - Electricity (%)
House heating fuel used in apartments - Fuel oil, kerosene, etc. (%)
House heating fuel used in apartments - Coal or coke (%)
House heating fuel used in apartments - Wood (%)
House heating fuel used in apartments - Solar energy (%)
House heating fuel used in apartments - Other fuel (%)
House heating fuel used in apartments - No fuel used (%)
Armed forces status - In Armed Forces (%)
Armed forces status - Civilian (%)
Armed forces status - Civilian - Veteran (%)
Armed forces status - Civilian - Nonveteran (%)
Fatal accidents locations in years 2005-2021
Fatal accidents locations in 2005
Fatal accidents locations in 2006
Fatal accidents locations in 2007
Fatal accidents locations in 2008
Fatal accidents locations in 2009
Fatal accidents locations in 2010
Fatal accidents locations in 2011
Fatal accidents locations in 2012
Fatal accidents locations in 2013
Fatal accidents locations in 2014
Fatal accidents locations in 2015
Fatal accidents locations in 2016
Fatal accidents locations in 2017
Fatal accidents locations in 2018
Fatal accidents locations in 2019
Fatal accidents locations in 2020
Fatal accidents locations in 2021
Alcohol use - People drinking some alcohol every month (%)
Alcohol use - People not drinking at all (%)
Alcohol use - Average days/month drinking alcohol
Alcohol use - Average drinks/week
Alcohol use - Average days/year people drink much
Audiometry - Average condition of hearing (%)
Audiometry - People that can hear a whisper from across a quiet room (%)
Audiometry - People that can hear normal voice from across a quiet room (%)
Audiometry - Ears ringing, roaring, buzzing (%)
Audiometry - Had a job exposure to loud noise (%)
Audiometry - Had off-work exposure to loud noise (%)
Blood Pressure & Cholesterol - Has high blood pressure (%)
Blood Pressure & Cholesterol - Checking blood pressure at home (%)
Blood Pressure & Cholesterol - Frequently checking blood cholesterol (%)
Blood Pressure & Cholesterol - Has high cholesterol level (%)
Consumer Behavior - Money monthly spent on food at supermarket/grocery store
Consumer Behavior - Money monthly spent on food at other stores
Consumer Behavior - Money monthly spent on eating out
Consumer Behavior - Money monthly spent on carryout/delivered foods
Consumer Behavior - Income spent on food at supermarket/grocery store (%)
Consumer Behavior - Income spent on food at other stores (%)
Consumer Behavior - Income spent on eating out (%)
Consumer Behavior - Income spent on carryout/delivered foods (%)
Current Health Status - General health condition (%)
Current Health Status - Blood donors (%)
Current Health Status - Has blood ever tested for HIV virus (%)
Current Health Status - Left-handed people (%)
Dermatology - People using sunscreen (%)
Diabetes - Diabetics (%)
Diabetes - Had a blood test for high blood sugar (%)
Diabetes - People taking insulin (%)
Diet Behavior & Nutrition - Diet health (%)
Diet Behavior & Nutrition - Milk product consumption (# of products/month)
Diet Behavior & Nutrition - Meals not home prepared (#/week)
Diet Behavior & Nutrition - Meals from fast food or pizza place (#/week)
Diet Behavior & Nutrition - Ready-to-eat foods (#/month)
Diet Behavior & Nutrition - Frozen meals/pizza (#/month)
Drug Use - People that ever used marijuana or hashish (%)
Drug Use - Ever used hard drugs (%)
Drug Use - Ever used any form of cocaine (%)
Drug Use - Ever used heroin (%)
Drug Use - Ever used methamphetamine (%)
Health Insurance - People covered by health insurance (%)
Kidney Conditions-Urology - Avg. # of times urinating at night
Medical Conditions - People with asthma (%)
Medical Conditions - People with anemia (%)
Medical Conditions - People with psoriasis (%)
Medical Conditions - People with overweight (%)
Medical Conditions - Elderly people having difficulties in thinking or remembering (%)
Medical Conditions - People who ever received blood transfusion (%)
Medical Conditions - People having trouble seeing even with glass/contacts (%)
Medical Conditions - People with arthritis (%)
Medical Conditions - People with gout (%)
Medical Conditions - People with congestive heart failure (%)
Medical Conditions - People with coronary heart disease (%)
Medical Conditions - People with angina pectoris (%)
Medical Conditions - People who ever had heart attack (%)
Medical Conditions - People who ever had stroke (%)
Medical Conditions - People with emphysema (%)
Medical Conditions - People with thyroid problem (%)
Medical Conditions - People with chronic bronchitis (%)
Medical Conditions - People with any liver condition (%)
Medical Conditions - People who ever had cancer or malignancy (%)
Mental Health - People who have little interest in doing things (%)
Mental Health - People feeling down, depressed, or hopeless (%)
Mental Health - People who have trouble sleeping or sleeping too much (%)
Mental Health - People feeling tired or having little energy (%)
Mental Health - People with poor appetite or overeating (%)
Mental Health - People feeling bad about themself (%)
Mental Health - People who have trouble concentrating on things (%)
Mental Health - People moving or speaking slowly or too fast (%)
Mental Health - People having thoughts they would be better off dead (%)
Oral Health - Average years since last visit a dentist
Oral Health - People embarrassed because of mouth (%)
Oral Health - People with gum disease (%)
Oral Health - General health of teeth and gums (%)
Oral Health - Average days a week using dental floss/device
Oral Health - Average days a week using mouthwash for dental problem
Oral Health - Average number of teeth
Pesticide Use - Households using pesticides to control insects (%)
Pesticide Use - Households using pesticides to kill weeds (%)
Physical Activity - People doing vigorous-intensity work activities (%)
Physical Activity - People doing moderate-intensity work activities (%)
Physical Activity - People walking or bicycling (%)
Physical Activity - People doing vigorous-intensity recreational activities (%)
Physical Activity - People doing moderate-intensity recreational activities (%)
Physical Activity - Average hours a day doing sedentary activities
Physical Activity - Average hours a day watching TV or videos
Physical Activity - Average hours a day using computer
Physical Functioning - People having limitations keeping them from working (%)
Physical Functioning - People limited in amount of work they can do (%)
Physical Functioning - People that need special equipment to walk (%)
Physical Functioning - People experiencing confusion/memory problems (%)
Physical Functioning - People requiring special healthcare equipment (%)
Prescription Medications - Average number of prescription medicines taking
Preventive Aspirin Use - Adults 40+ taking low-dose aspirin (%)
Reproductive Health - Vaginal deliveries (%)
Reproductive Health - Cesarean deliveries (%)
Reproductive Health - Deliveries resulted in a live birth (%)
Reproductive Health - Pregnancies resulted in a delivery (%)
Reproductive Health - Women breastfeeding newborns (%)
Reproductive Health - Women that had a hysterectomy (%)
Reproductive Health - Women that had both ovaries removed (%)
Reproductive Health - Women that have ever taken birth control pills (%)
Reproductive Health - Women taking birth control pills (%)
Reproductive Health - Women that have ever used Depo-Provera or injectables (%)
Reproductive Health - Women that have ever used female hormones (%)
Sexual Behavior - People 18+ that ever had sex (vaginal, anal, or oral) (%)
Sexual Behavior - Males 18+ that ever had vaginal sex with a woman (%)
Sexual Behavior - Males 18+ that ever performed oral sex on a woman (%)
Sexual Behavior - Males 18+ that ever had anal sex with a woman (%)
Sexual Behavior - Males 18+ that ever had any sex with a man (%)
Sexual Behavior - Females 18+ that ever had vaginal sex with a man (%)
Sexual Behavior - Females 18+ that ever performed oral sex on a man (%)
Sexual Behavior - Females 18+ that ever had anal sex with a man (%)
Sexual Behavior - Females 18+ that ever had any kind of sex with a woman (%)
Sexual Behavior - Average age people first had sex
Sexual Behavior - Average number of female sex partners in lifetime (males 18+)
Sexual Behavior - Average number of female vaginal sex partners in lifetime (males 18+)
Sexual Behavior - Average age people first performed oral sex on a woman (18+)
Sexual Behavior - Average number of woman performed oral sex on in lifetime (18+)
Sexual Behavior - Average number of male sex partners in lifetime (males 18+)
Sexual Behavior - Average number of male anal sex partners in lifetime (males 18+)
Sexual Behavior - Average age people first performed oral sex on a man (18+)
Sexual Behavior - Average number of male oral sex partners in lifetime (18+)
Sexual Behavior - People using protection when performing oral sex (%)
Sexual Behavior - Average number of times people have vaginal or anal sex a year
Sexual Behavior - People having sex without condom (%)
Sexual Behavior - Average number of male sex partners in lifetime (females 18+)
Sexual Behavior - Average number of male vaginal sex partners in lifetime (females 18+)
Sexual Behavior - Average number of female sex partners in lifetime (females 18+)
Sexual Behavior - Circumcised males 18+ (%)
Sleep Disorders - Average hours sleeping at night
Sleep Disorders - People that has trouble sleeping (%)
Smoking-Cigarette Use - People smoking cigarettes (%)
Taste & Smell - People 40+ having problems with smell (%)
Taste & Smell - People 40+ having problems with taste (%)
Taste & Smell - People 40+ that ever had wisdom teeth removed (%)
Taste & Smell - People 40+ that ever had tonsils teeth removed (%)
Taste & Smell - People 40+ that ever had a loss of consciousness because of a head injury (%)
Taste & Smell - People 40+ that ever had a broken nose or other serious injury to face or skull (%)
Taste & Smell - People 40+ that ever had two or more sinus infections (%)
Weight - Average height (inches)
Weight - Average weight (pounds)
Weight - Average BMI
Weight - People that are obese (%)
Weight - People that ever were obese (%)
Weight - People trying to lose weight (%)
Urban population: 45,240
Rural population: 29,773
Estimated median house/condo value in 2022: $404,193
37128:
$404,193Tennessee:
$284,800
According to our research of Tennessee and other state lists, there were 33 registered sex offenders living in 37128 zip code as of May 28, 2024 . The ratio of all residents to sex offenders in zip code 37128 is 1,413 to 1.The ratio of registered sex offenders to all residents in this zip code is much lower than the state average.
Median resident age: This zip code:
32.2 yearsTennessee median age:
39.2 years
Average household size: This zip code:
2.7 peopleTennessee:
2.4 people
Averages for the 2020 tax year for zip code 37128, filed in 2021:
Average Adjusted Gross Income (AGI) in 2020: $67,493 (Individual Income Tax Returns) Here:
$67,493State:
$69,014
Salary/wage: $60,707 (reported on 87.9% of returns )Here:
$60,707State:
$55,872
(% of AGI for various income ranges: 1189.8% for AGIs below $25k , 3724.8% for AGIs $25k-50k , 6647.7% for AGIs $50k-75k , 9743.7% for AGIs $75k-100k , 18111.7% for AGIs $100k-200k , 59216.1% for AGIs over 200k ) Taxable interest for individuals: $983 (reported on 23.2% of returns )This zip code:
$983Tennessee:
$1,945
(% of AGI for various income ranges: 8.0% for AGIs below $25k , 12.2% for AGIs $25k-50k , 20.3% for AGIs $50k-75k , 35.6% for AGIs $75k-100k , 65.1% for AGIs $100k-200k , 493.0% for AGIs over 200k ) Ordinary dividends: $2,938 (reported on 13.0% of returns )(% of AGI for various income ranges: 10.1% for AGIs below $25k , 14.9% for AGIs $25k-50k , 33.9% for AGIs $50k-75k , 47.1% for AGIs $75k-100k , 97.6% for AGIs $100k-200k , 1144.8% for AGIs over 200k ) Net capital gain/loss in AGI: +$13,446 (reported on 13.0% of returns )Here:
+$13,446State:
+$33,664
(% of AGI for various income ranges: 5.4% for AGIs below $25k , 14.8% for AGIs $25k-50k , 48.7% for AGIs $50k-75k , 88.1% for AGIs $75k-100k , 339.9% for AGIs $100k-200k , 9643.2% for AGIs over 200k ) Profit/loss from business: +$17,911 (reported on 17.5% of returns )Here:
+$17,911State:
+$18,991
(% of AGI for various income ranges: 99.8% for AGIs below $25k , 152.1% for AGIs $25k-50k , 201.6% for AGIs $50k-75k , 388.8% for AGIs $75k-100k , 766.3% for AGIs $100k-200k , 9686.6% for AGIs over 200k ) Taxable individual retirement arrangement distribution: $17,526 (reported on 6.1% of returns )37128:
$17,526Tennessee:
$20,036
(% of AGI for various income ranges: 35.4% for AGIs below $25k , 66.3% for AGIs $25k-50k , 110.5% for AGIs $50k-75k , 189.9% for AGIs $75k-100k , 379.6% for AGIs $100k-200k , 1215.2% for AGIs over 200k ) Self-employed (Keogh) retirement plans: $21,025 (reported on 0.3% of returns )37128:
$21,025Tennessee:
$28,955
(% of AGI for various income ranges: 2.9% for AGIs $25k-50k , 15.3% for AGIs $100k-200k , 398.2% for AGIs over 200k ) Total itemized deductions: $31,691 (reported on 6.4% of returns )Here:
$31,691State:
$40,136
(% of AGI for various income ranges: 27.0% for AGIs below $25k , 94.0% for AGIs $25k-50k , 204.9% for AGIs $50k-75k , 329.9% for AGIs $75k-100k , 640.4% for AGIs $100k-200k , 4527.5% for AGIs over 200k ) Charity contributions: $13,090 (reported on 5.3% of returns )Here:
$13,090State:
$19,852
(% of AGI for various income ranges: 2.6% for AGIs below $25k , 16.3% for AGIs $25k-50k , 43.7% for AGIs $50k-75k , 79.1% for AGIs $75k-100k , 232.9% for AGIs $100k-200k , 2320.0% for AGIs over 200k ) Taxes paid: $5,278 (reported on 6.1% of returns )(% of AGI for various income ranges: 2.7% for AGIs below $25k , 11.6% for AGIs $25k-50k , 30.7% for AGIs $50k-75k , 56.2% for AGIs $75k-100k , 110.0% for AGIs $100k-200k , 732.5% for AGIs over 200k ) Earned income credit: $2,176 (reported on 12.7% of returns )(% of AGI for various income ranges: 70.7% for AGIs below $25k , 59.3% for AGIs $25k-50k , 1.5% for AGIs $50k-75k ) Percentage of individuals using paid preparers for their 2020 taxes: 94.9%(% for various income ranges: 93.7% for AGIs below $25k , 95.7% for AGIs $25k-50k , 95.1% for AGIs $50k-75k , 95.6% for AGIs $75k-100k , 94.9% for AGIs $100k-200k , 95.8% for AGIs over 200k )
Averages for the 2012 tax year for zip code 37128, filed in 2013:
Average Adjusted Gross Income (AGI) in 2012: $56,470 (Individual Income Tax Returns) Here:
$56,470State:
$53,767
Salary/wage: $52,242 (reported on 90.0% of returns )Here:
$52,242State:
$45,421
(% of AGI for various income ranges: 80.3% for AGIs below $25k , 88.0% for AGIs $25k-50k , 86.3% for AGIs $50k-75k , 86.9% for AGIs $75k-100k , 86.3% for AGIs $100k-200k , 58.2% for AGIs over 200k ) Taxable interest for individuals: $707 (reported on 28.0% of returns )This zip code:
$707Tennessee:
$1,732
(% of AGI for various income ranges: 0.7% for AGIs below $25k , 0.3% for AGIs $25k-50k , 0.3% for AGIs $50k-75k , 0.3% for AGIs $75k-100k , 0.2% for AGIs $100k-200k , 0.6% for AGIs over 200k ) Ordinary dividends: $2,742 (reported on 12.5% of returns )(% of AGI for various income ranges: 0.8% for AGIs below $25k , 0.4% for AGIs $25k-50k , 0.4% for AGIs $50k-75k , 0.4% for AGIs $75k-100k , 0.4% for AGIs $100k-200k , 2.3% for AGIs over 200k ) Net capital gain/loss in AGI: +$8,182 (reported on 9.7% of returns )Here:
+$8,182State:
+$19,082
(% of AGI for various income ranges: 0.2% for AGIs $25k-50k , 0.3% for AGIs $50k-75k , 0.4% for AGIs $75k-100k , 0.7% for AGIs $100k-200k , 9.8% for AGIs over 200k ) Profit/loss from business: +$14,516 (reported on 14.8% of returns )Here:
+$14,516State:
+$15,240
(% of AGI for various income ranges: 6.7% for AGIs below $25k , 2.6% for AGIs $25k-50k , 2.5% for AGIs $50k-75k , 2.5% for AGIs $75k-100k , 3.8% for AGIs $100k-200k , 8.5% for AGIs over 200k ) Taxable individual retirement arrangement distribution: $13,709 (reported on 6.7% of returns )37128:
$13,709Tennessee:
$15,505
(% of AGI for various income ranges: 2.3% for AGIs below $25k , 1.3% for AGIs $25k-50k , 1.7% for AGIs $50k-75k , 1.4% for AGIs $75k-100k , 1.7% for AGIs $100k-200k , 1.6% for AGIs over 200k ) Self-employment retirement plans: $17,617 (reported on 0.3% of returns )37128:
$17,617Tennessee:
$22,567
Total itemized deductions: $17,929 (20% of AGI, reported on 32.6% of returns )Here:
$17,929State:
$21,976
Here:
19.7% of AGIState:
17.8% of AGI
(% of AGI for various income ranges: 8.5% for AGIs below $25k , 8.9% for AGIs $25k-50k , 11.0% for AGIs $50k-75k , 11.2% for AGIs $75k-100k , 11.1% for AGIs $100k-200k , 9.3% for AGIs over 200k ) Charity contributions: $4,539 (reported on 26.0% of returns )(% of AGI for various income ranges: 0.9% for AGIs below $25k , 1.2% for AGIs $25k-50k , 1.8% for AGIs $50k-75k , 2.2% for AGIs $75k-100k , 2.5% for AGIs $100k-200k , 3.4% for AGIs over 200k ) Taxes paid: $3,931 (reported on 32.2% of returns )(% of AGI for various income ranges: 1.4% for AGIs below $25k , 1.7% for AGIs $25k-50k , 2.2% for AGIs $50k-75k , 2.4% for AGIs $75k-100k , 2.7% for AGIs $100k-200k , 2.3% for AGIs over 200k ) Earned income credit: $2,046 (reported on 14.3% of returns )(% of AGI for various income ranges: 5.3% for AGIs below $25k , 1.0% for AGIs $25k-50k ) Percentage of individuals using paid preparers for their 2012 taxes: 42.2%(% for various income ranges: 39.1% for AGIs below $25k , 39.2% for AGIs $25k-50k , 43.4% for AGIs $50k-75k , 43.8% for AGIs $75k-100k , 49.0% for AGIs $100k-200k , 71.4% for AGIs over 200k )
Averages for the 2004 tax year for zip code 37128, filed in 2005:
Average Adjusted Gross Income (AGI) in 2004: $48,345 (Individual Income Tax Returns) Here:
$48,345State:
$44,088
Salary/wage: $45,454 (reported on 91.7% of returns )Here:
$45,454State:
$38,825
(% of AGI for various income ranges: 117.4% for AGIs below $10k , 83.4% for AGIs $10k-25k , 89.8% for AGIs $25k-50k , 90.8% for AGIs $50k-75k , 90.1% for AGIs $75k-100k , 74.9% for AGIs over 100k ) Taxable interest for individuals: $818 (reported on 36.9% of returns )This zip code:
$818Tennessee:
$1,802
(% of AGI for various income ranges: 2.4% for AGIs below $10k , 1.4% for AGIs $10k-25k , 0.6% for AGIs $25k-50k , 0.5% for AGIs $50k-75k , 0.5% for AGIs $75k-100k , 0.7% for AGIs over 100k ) Taxable dividends: $1,173 (reported on 16.3% of returns )(% of AGI for various income ranges: 2.1% for AGIs below $10k , 0.5% for AGIs $10k-25k , 0.3% for AGIs $25k-50k , 0.3% for AGIs $50k-75k , 0.3% for AGIs $75k-100k , 0.5% for AGIs over 100k ) Net capital gain/loss: +$6,251 (reported on 13.1% of returns )Here:
+$6,251State:
+$15,776
(% of AGI for various income ranges: 0.0% for AGIs below $10k , 0.4% for AGIs $10k-25k , 0.2% for AGIs $25k-50k , 0.5% for AGIs $50k-75k , 0.8% for AGIs $75k-100k , 5.2% for AGIs over 100k ) Profit/loss from business: +$11,203 (reported on 15.8% of returns )Here:
+$11,203State:
+$12,882
(% of AGI for various income ranges: 3.3% for AGIs below $10k , 5.5% for AGIs $10k-25k , 3.4% for AGIs $25k-50k , 2.2% for AGIs $50k-75k , 2.6% for AGIs $75k-100k , 5.7% for AGIs over 100k ) IRA payment deduction: $2,427 (reported on 1.8% of returns )37128:
$2,427Tennessee:
$2,934
(% of AGI for various income ranges: 0.1% for AGIs $10k-25k , 0.1% for AGIs $25k-50k , 0.1% for AGIs $50k-75k , 0.1% for AGIs $75k-100k , 0.1% for AGIs over 100k ) Self-employed pension: $10,014 (reported on 0.6% of returns )Here:
$10,014Tennessee:
$16,857
(% of AGI for various income ranges: 0.1% for AGIs $25k-50k , 0.0% for AGIs $50k-75k , 0.1% for AGIs $75k-100k , 0.3% for AGIs over 100k ) Total itemized deductions: $14,696 (21% of AGI, reported on 40.6% of returns )Here:
$14,696State:
$18,035
Here:
20.8% of AGIState:
19.9% of AGI
(% of AGI for various income ranges: 12.2% for AGIs below $10k , 10.3% for AGIs $10k-25k , 12.5% for AGIs $25k-50k , 13.6% for AGIs $50k-75k , 12.9% for AGIs $75k-100k , 11.0% for AGIs over 100k ) Charity contributions deductions: $3,312 (5% of AGI, reported on 33.3% of returns )Here:
4.6% of AGIState:
5.3% of AGI
(% of AGI for various income ranges: 1.0% for AGIs below $10k , 1.2% for AGIs $10k-25k , 1.7% for AGIs $25k-50k , 2.2% for AGIs $50k-75k , 2.5% for AGIs $75k-100k , 3.1% for AGIs over 100k ) Total tax: $6,309 (reported on 81.9% of returns )(% of AGI for various income ranges: 3.4% for AGIs below $10k , 4.7% for AGIs $10k-25k , 7.1% for AGIs $25k-50k , 8.5% for AGIs $50k-75k , 10.2% for AGIs $75k-100k , 18.1% for AGIs over 100k ) Earned income credit: $1,611 (reported on 11.1% of returns )Percentage of individuals using paid preparers for their 2004 taxes: 50.9%(% for various income ranges: 41.0% for AGIs below $10k , 53.4% for AGIs $10k-25k , 51.6% for AGIs $25k-50k , 53.1% for AGIs $50k-75k , 49.4% for AGIs $75k-100k , 57.8% for AGIs over 100k )
Estimated median household income in 2022: This zip code:
$87,172Tennessee:
$65,254
Nearest zip codes: 37153 ,
37132 ,
37060 ,
37129 ,
37037 ,
37127 .
Murfreesboro Zip Code Map
Percentage of family households: This zip code:
58.6%Tennessee:
46.2%
Percentage of households with unmarried partners: This zip code:
4.9%Tennessee:
47.1%
Likely homosexual households (counted as self-reported same-sex unmarried-partner households)
Lesbian couples: 0.0% of all households Gay men: 0.0% of all households
Household received Food Stamps/SNAP in the past 12 months: 1,164Household did not receive Food Stamps/SNAP in the past 12 months: 26,646
Women who had a birth in the past 12 months: 711 (635 now married , 85 unmarried) Women who did not have a birth in the past 12 months: 19,840 (9,490 now married , 10,351 unmarried)
Housing units in zip code 37128 with a mortgage: 13,817 (1,028
second mortgage , 92
home equity loan , 760
both second mortgage and home equity loan )
Houses without a mortgage: 75
Median monthly owner costs for units with a mortgage: $1,727
Median monthly owner costs for units without a mortgage: $473
Residents with income below the poverty level in 2022:
This zip code:
4.9%Whole state:
13.3%
Residents with income below 50% of the poverty level in 2022:
This zip code:
2.9%Whole state:
7.1%
Median number of rooms in houses and condos: Median number of rooms in apartments: Notable locations in this zip code not listed on our city pages
Click to draw/clear zip code borders Notable locations in zip code 37128: (A) , Salem - Blackman Volunteer Fire Department (B) . Display/hide their locations on the map
Shopping Center: (1) . Display/hide its location on the map
Churches in zip code 37128 include: (A) , Begsley Lane Church (B) , Cherry Grove Church (C) , Mount Zion Baptist Church (D) , Cedar Grove Church (E) . Display/hide their locations on the map
Cemeteries: (1) , Webb Cemetery (2) , Yeargan Cemetery (3) , Wray-Covington Cemetery (4) , Witherspoon Cemetery (5) , Webb Cemetery (6) , Steagall Cemetery (7) . Display/hide their locations on the map
Lakes and reservoirs: (A) , Sterling Farmer Lake (B) . Display/hide their locations on the map
Streams, rivers, and creeks: (A) , Christmas Creek (B) , Armstrong Branch (C) , Panther Creek (D) , Middle Fork Stones River (E) . Display/hide their locations on the map
Year house built (houses)
993 2020 or later11,692 2010 to 20198,871 2000 to 20094,431 1990 to 19992,368 1980 to 19891,002 1970 to 1979229 1960 to 1969250 1950 to 1959200 1940 to 194939 1939 or earlier
Zip code 37128 household income distribution in 2022 375 Less than $10,000372 $10,000 to $14,999520 $15,000 to $19,999590 $20,000 to $24,999480 $25,000 to $29,999697 $30,000 to $34,9991,247 $35,000 to $39,999754 $40,000 to $44,9991,581 $45,000 to $49,9992,049 $50,000 to $59,9992,989 $60,000 to $74,9994,465 $75,000 to $99,9993,514 $100,000 to $124,9992,777 $125,000 to $149,9993,898 $150,000 to $199,9991,603 $200,000 or moreEstimate of home value of owner-occupied houses/condos in 2022 in zip code 37128 37 Less than $10,00036 $20,000 to $24,99976 $25,000 to $29,99922 $30,000 to $34,99911 $35,000 to $39,99930 $80,000 to $89,99913 $90,000 to $99,99974 $100,000 to $124,99928 $125,000 to $149,999236 $150,000 to $174,999438 $175,000 to $199,9992,045 $200,000 to $249,9993,943 $250,000 to $299,9996,630 $300,000 to $399,9993,555 $400,000 to $499,9993,165 $500,000 to $749,999397 $750,000 to $999,99975 $1,000,000 to $1,499,99941 $1,500,000 to $1,999,999191 $2,000,000 or moreRent paid by renters in 2022 in zip code 37128 136 $300 to $34995 $450 to $49941 $550 to $59930 $650 to $69935 $700 to $74986 $750 to $799171 $800 to $899644 $900 to $9992,639 $1,000 to $1,2492,757 $1,250 to $1,4992,186 $1,500 to $1,999494 $2,000 to $2,499290 $2,500 to $2,999417 No cash rent
Median gross rent in 2022: $1,498.
Median price asked for vacant for-sale houses and condos in 2022: $428,365.
Estimated median house (or condo) value in 2022 for: White Non-Hispanic householders: $405,217Black or African American householders: $441,776American Indian or Alaska Native householders: $305,450Asian householders: $380,959Some other race householders: $594,501Two or more races householders: $370,025Hispanic or Latino householders: $402,826Estimated median house or condo value in 2022: $404,193
37128:
$404,193Tennessee:
$284,800
Lower value quartile - upper value quartile: $317,553 - $508,832
Mean price in 2022: Detached houses: $285,420Here:
$285,420State:
$374,382
Townhouses or other attached units: $145,739Here:
$145,739State:
$354,101
In 2-unit structures: $930,485Here:
$930,485State:
$247,693
In 5-or-more-unit structures: $297,024Here:
$297,024State:
$317,434
Mobile homes: $758,981Here:
$758,981State:
$101,421
Housing units in structures:
One, detached: 18,659One, attached: 3,561Two: 1233 or 4: 4285 to 9: 1,95510 to 19: 1,74220 to 49: 1,46750 or more: 932Mobile homes: 165Unemployment : 2.1%
Means of transportation to work in zip code 37128 72.4% 30,370 Drove a car alone9.2% 3,846 Carpooled0.0% 7 Bus or trolley bus0.1% 46 Walked1.3% 537 Other means18.8% 7,893 Worked at homeTravel time to work (commute) in zip code 37128 729 Less than 5 minutes1,977 5 to 9 minutes3,324 10 to 14 minutes5,615 15 to 19 minutes5,036 20 to 24 minutes2,450 25 to 29 minutes5,299 30 to 34 minutes1,195 35 to 39 minutes2,104 40 to 44 minutes3,539 45 to 59 minutes2,727 60 to 89 minutes760 90 or more minutes
Percentage of zip code residents living and working in this county: 70.4%
Household type by relationship:
Households: 75,014
Male householders: 13,024 (2,402 living alone ), Female householders: 14,687 (3,678 living alone )15,300 spouses (15,206 opposite-sex spouses ), 2,419 unmarried partners , (2,375 opposite-sex unmarried partners ), 23,772 children (21,207 natural , 676 adopted , 1,845 stepchildren ), 1,045 grandchildren , 701 brothers or sisters , 612 parents , 69 foster children , 1,056 other relatives , 2,138 non-relatives In group quarters: 57 (-1 institutionalized population )
Size of family households: 7,668 2-persons , 4,785 3-persons , 3,574 4-persons , 2,548 5-persons , 656 6-persons , 299 7-or-more-persons
Size of nonfamily households: 6,095 1-person , 1,416 2-persons , 519 3-persons , 40 4-persons , 124 5-persons
14,377 married couples with children. single-parent households (1,588 men , 2,298 women ).
88.3% of residents of 37128 zip code speak English at home. of residents speak Spanish at home (64% very well, 14% well, 13% not well, 9% not at all ).of residents speak other Indo-European language at home (68% very well, 9% well, 22% not at all ).of residents speak Asian or Pacific Island language at home (50% very well, 24% well, 24% not well, 2% not at all ).of residents speak other language at home (66% very well, 21% well, 11% not well, 2% not at all ).
Foreign born population: 5,766 (7.7%)
(49.1%
of them are naturalized citizens )
This zip code:
7.7%Whole state:
5.6%
20% Bolivia 10% Algeria 6% Dominica 6% Malaysia 6% Indonesia 6% Honduras 5% Haiti 15% English 11% American 7% Irish 7% German 3% European 3% Italian 2% Scottish
Year of entry for the foreign-born population
3,830 2010 or later 1,146 2000 to 2009 803 1990 to 1999 1,197 Before 1990
There are
86 Medical Specialists in Zip Code 37128 .
Facilities with environmental interests located in this zip code:
BARFIELD ELEMENTARY (350 BARFIELD- CRESCENT RD in MURFREESBORO, TN)
(National Center for Education Statistics) - STATE ID-0003 Organizations: RUTHERFORD COUNTY SCHOOL DIST (SCHOOL DISTRICT)
CASON LANE ACADEMY (1330 CASON LA in MURFREESBORO, TN)
(National Center for Education Statistics) - STATE ID-0015 Organizations: MURFREESBORO CITY ELEM SCH DIS (SCHOOL DISTRICT)
CELLCO PARTNERSHIP, DBA VERIZON WIRELESS (300 RIVER ROCK BLVD. in MURFREESBORO, TN)
AIR SYNTHETIC MINOR (AIRS/AFS) Business SIC classification: RADIOTELEPHONE COMMUNICATIONS
DAVES BODY SHOP (2441 CANTERBURY CHASE in MURFREESBORO, TN)
Conditionally Exempt Small Quantity Generators, less than 100 kg/month of hazardous waste (Resource Conservation and Recovery Act (tracking hazardous waste)) - notification Business NAICS classification: AUTOMOTIVE BODY, PAINT, AND INTERIOR REPAIR AND MAINTENANCE.
Housing units lacking complete plumbing facilities: 0.4%
Housing units lacking complete kitchen facilities: 0.5%
73.8% Electricity 24.6% Utility gas 0.9% Bottled, tank, or LP gas
Place of birth for U.S.-born residents:
This state: 36,078Northeast: 4,907Midwest: 8,851South: 13,319West: 5,578
41% of the 37128 zip code residents lived in the same house 5 years ago.
Out of people who lived in different houses, 46% lived in this county.
Out of people who lived in different counties, 50% lived in Tennessee.
86% of the 37128 zip code residents lived in the same house 1 year ago.
Out of people who lived in different houses, 39% moved from this county.
Out of people who lived in different houses, 30% moved from different county within same state.
Out of people who lived in different houses, 27% moved from different state.
Out of people who lived in different houses, 5% moved from abroad.
Private vs. public school enrollment:
Students in private schools in grades 1 to 8 (elementary and middle school): 1,328
Here:
14.6%Tennessee:
15.0%
Students in private schools in grades 9 to 12 (high school): 838
Here:
16.7%Tennessee:
16.2%
Students in private undergraduate colleges: 590
Here:
15.4%Tennessee:
23.5%
Occupation by median earnings in the past 12 months ($)
80,774 Architecture and engineering occupations 75,649 Management occupations 74,362 Computer and mathematical occupations 72,412 Law enforcement workers including supervisors 68,360 Health diagnosing and treating practitioners and other technical occupations 65,434 Business and financial operations occupations
Companies with federal contracts located in this zip code (MURFREESBORO, TN):
NEDROW & ASSOCIATES, INC (2233 S PARK DR; small business) in 3 contracts from 2000 to 2005
$54,000 with Tennessee Valley Authority for Sewage Treatment Equipment. Signed on 2000-06-15. Completion date: 2000-08-15.
with Army for Compressors and Vacuum Pumps. Signed on 2005-09-13. Completion date: 2005-09-23.
with U.S. Army Corps of Engineers - civil program financing only for Compressors and Vacuum Pumps. Signed on 2005-09-13. Completion date: 2005-09-23.
M-SOFT, INC (2441Q OLD FORT PKWY; small business) in 2 contracts from 2005 to 2006
$27,000 with Air Force for Maintenance, Repair and Rebuilding of Equipment -- Automatic Data Processing Equipment (Including Firmware), Software, Supplies and Support Equipment. Taking place in AK. Signed on 2006-04-07. Completion date: 2007-04-06.
with Air Force for Programming Services. Taking place in ID. Signed on 2005-11-18. Completion date: 2006-09-30.
R & R DATA/TELECOM, INC (2232 SASSAFRAS DRIVE; small business)
$4,549 with U.S. Army Corps of Engineers - civil program financing only for ADP Support Equipment. Signed on 2001-03-27. Completion date: 2001-04-04.
MCNULTY, KEVIN (2710 CASON CT; small business)
$2,800 with Army for Other Education and Training Services. Signed on 2003-12-16. Completion date: 2003-12-15.
Top industries in this zip code by the number of employees in 2005:
Information: Cellular and Other Wireless Telecommunications (over 1000 employees: 1 establishment)Accommodation and Food Services: Limited-Service Restaurants (50-99: 2, 20-49: 7, 10-19: 3, 5-9: 3)Other Services (except Public Administration): Religious Organizations (50-99: 1, 20-49: 1, 10-19: 2, 5-9: 2, 1-4: 12)Accommodation and Food Services: Full-Service Restaurants (50-99: 1, 20-49: 2, 10-19: 1, 1-4: 3)Administrative and Support and Waste Management and Remediation Services: Landscaping Services (50-99: 1, 20-49: 1, 5-9: 1, 1-4: 7)Health Care and Social Assistance: Child Day Care Services (20-49: 2, 10-19: 2)Professional, Scientific, and Technical Services: Veterinary Services (20-49: 2)Finance and Insurance: Commercial Banking (10-19: 2, 5-9: 4, 1-4: 2)Administrative and Support and Waste Management and Remediation Services: Janitorial Services (20-49: 1, 5-9: 2, 1-4: 2)
People in group quarters in 2010:
7 people in emergency and transitional shelters (with sleeping facilities) for people experiencing homelessness
7 people in group homes intended for adults
Fatal accident statistics in 2014:
Fatal accident count: 3Vehicles involved in fatal accidents: 4Fatal accidents caused by drunken drivers: 0Fatalities: 3Persons involved in fatal accidents: 6Pedestrians involved in fatal accidents: 0
Fatal accident statistics in 2013:
Fatal accident count: 2Vehicles involved in fatal accidents: 5Fatal accidents caused by drunken drivers: 0Fatalities: 3Persons involved in fatal accidents: 9Pedestrians involved in fatal accidents: 0
Home Mortgage Disclosure Act Aggregated Statistics For Year 2009(Based on 10 partial tracts) A) FHA, FSA/RHS & VA B) Conventional C) Refinancings D) Home Improvement Loans F) Non-occupant Loans on G) Loans On Manufactured Number Average Value Number Average Value Number Average Value Number Average Value Number Average Value Number Average Value
LOANS ORIGINATED 729 $151,827 383 $147,177 1,501 $157,186 45 $65,433 124 $116,465 5 $64,836 APPLICATIONS APPROVED, NOT ACCEPTED 29 $149,388 13 $185,873 107 $157,672 5 $85,052 3 $79,777 2 $67,325 APPLICATIONS DENIED 47 $146,188 42 $143,445 432 $155,647 48 $34,864 29 $108,356 5 $95,984 APPLICATIONS WITHDRAWN 76 $174,169 70 $132,305 388 $164,545 15 $42,123 19 $103,102 3 $67,627 FILES CLOSED FOR INCOMPLETENESS 19 $175,452 12 $141,983 99 $156,083 5 $53,260 4 $103,520 0 $0
Aggregated Statistics For Year 2008(Based on 10 partial tracts) A) FHA, FSA/RHS & VA B) Conventional C) Refinancings D) Home Improvement Loans E) Loans on Dwellings For 5+ Families F) Non-occupant Loans on G) Loans On Manufactured Number Average Value Number Average Value Number Average Value Number Average Value Number Average Value Number Average Value Number Average Value
LOANS ORIGINATED 618 $158,969 635 $154,467 764 $151,896 75 $45,470 1 $24,438,660 184 $132,469 9 $90,280 APPLICATIONS APPROVED, NOT ACCEPTED 16 $164,568 52 $154,642 118 $148,114 13 $57,771 0 $0 7 $109,611 3 $52,253 APPLICATIONS DENIED 58 $157,719 63 $165,674 530 $146,563 115 $59,610 0 $0 28 $150,876 8 $70,801 APPLICATIONS WITHDRAWN 53 $154,373 95 $173,066 283 $150,586 20 $105,251 0 $0 17 $145,814 1 $147,430 FILES CLOSED FOR INCOMPLETENESS 1 $102,020 18 $165,972 41 $161,304 1 $40,500 0 $0 3 $160,283 0 $0
Aggregated Statistics For Year 2007(Based on 10 partial tracts) A) FHA, FSA/RHS & VA B) Conventional C) Refinancings D) Home Improvement Loans E) Loans on Dwellings For 5+ Families F) Non-occupant Loans on G) Loans On Manufactured Number Average Value Number Average Value Number Average Value Number Average Value Number Average Value Number Average Value Number Average Value
LOANS ORIGINATED 382 $158,818 1,750 $134,152 879 $130,179 142 $36,924 1 $17,868,000 315 $114,550 14 $73,694 APPLICATIONS APPROVED, NOT ACCEPTED 8 $129,029 159 $125,290 165 $138,566 29 $31,953 0 $0 23 $112,679 2 $44,370 APPLICATIONS DENIED 25 $160,295 222 $123,027 646 $144,529 187 $52,787 0 $0 67 $102,601 19 $69,669 APPLICATIONS WITHDRAWN 32 $181,689 197 $141,912 285 $140,673 25 $76,312 0 $0 28 $125,679 4 $93,085 FILES CLOSED FOR INCOMPLETENESS 8 $150,642 27 $141,357 94 $148,359 2 $66,385 0 $0 7 $131,593 0 $0
Aggregated Statistics For Year 2006(Based on 10 partial tracts) A) FHA, FSA/RHS & VA B) Conventional C) Refinancings D) Home Improvement Loans E) Loans on Dwellings For 5+ Families F) Non-occupant Loans on G) Loans On Manufactured Number Average Value Number Average Value Number Average Value Number Average Value Number Average Value Number Average Value Number Average Value
LOANS ORIGINATED 472 $146,516 2,153 $115,234 851 $116,742 143 $31,154 5 $3,676,830 450 $103,221 12 $78,363 APPLICATIONS APPROVED, NOT ACCEPTED 15 $168,187 199 $100,814 163 $118,474 35 $26,563 0 $0 38 $89,193 9 $74,853 APPLICATIONS DENIED 30 $147,268 291 $115,919 587 $125,852 157 $37,884 0 $0 76 $105,836 24 $80,575 APPLICATIONS WITHDRAWN 48 $155,458 221 $115,025 444 $137,409 17 $55,937 0 $0 46 $106,808 1 $39,160 FILES CLOSED FOR INCOMPLETENESS 5 $140,086 39 $136,537 91 $139,948 2 $32,605 0 $0 5 $101,254 0 $0
Aggregated Statistics For Year 2005(Based on 10 partial tracts) A) FHA, FSA/RHS & VA B) Conventional C) Refinancings D) Home Improvement Loans E) Loans on Dwellings For 5+ Families F) Non-occupant Loans on G) Loans On Manufactured Number Average Value Number Average Value Number Average Value Number Average Value Number Average Value Number Average Value Number Average Value
LOANS ORIGINATED 499 $132,536 2,082 $108,269 926 $110,641 88 $37,078 1 $12,882,830 314 $89,747 11 $75,946 APPLICATIONS APPROVED, NOT ACCEPTED 11 $113,640 174 $93,171 146 $106,309 25 $57,645 0 $0 16 $106,998 7 $65,839 APPLICATIONS DENIED 23 $123,956 247 $97,469 607 $115,935 135 $34,251 0 $0 41 $73,432 26 $61,523 APPLICATIONS WITHDRAWN 36 $137,464 225 $117,509 486 $124,119 40 $138,798 0 $0 35 $102,787 4 $101,470 FILES CLOSED FOR INCOMPLETENESS 7 $110,806 72 $100,112 79 $122,461 3 $17,473 0 $0 5 $78,006 0 $0
Aggregated Statistics For Year 2004(Based on 10 partial tracts) A) FHA, FSA/RHS & VA B) Conventional C) Refinancings D) Home Improvement Loans F) Non-occupant Loans on G) Loans On Manufactured Number Average Value Number Average Value Number Average Value Number Average Value Number Average Value Number Average Value
LOANS ORIGINATED 517 $123,099 1,338 $106,698 925 $112,261 91 $42,054 160 $115,867 10 $76,493 APPLICATIONS APPROVED, NOT ACCEPTED 9 $115,497 101 $106,375 161 $109,623 16 $38,328 6 $95,550 7 $60,597 APPLICATIONS DENIED 60 $119,724 196 $92,913 610 $116,451 96 $29,935 26 $90,027 26 $56,455 APPLICATIONS WITHDRAWN 39 $115,793 127 $101,858 436 $115,139 22 $50,139 19 $103,119 2 $96,380 FILES CLOSED FOR INCOMPLETENESS 5 $148,300 52 $102,901 65 $123,678 4 $105,410 5 $98,632 0 $0
Aggregated Statistics For Year 2003(Based on 10 partial tracts) A) FHA, FSA/RHS & VA B) Conventional C) Refinancings D) Home Improvement Loans E) Loans on Dwellings For 5+ Families F) Non-occupant Loans on Number Average Value Number Average Value Number Average Value Number Average Value Number Average Value Number Average Value
LOANS ORIGINATED 689 $115,713 819 $108,704 1,944 $107,799 63 $22,253 0 $0 138 $88,025 APPLICATIONS APPROVED, NOT ACCEPTED 10 $118,395 59 $99,572 251 $109,192 20 $20,312 0 $0 9 $85,598 APPLICATIONS DENIED 72 $106,844 127 $100,092 533 $104,224 69 $16,580 1 $1,000 16 $80,233 APPLICATIONS WITHDRAWN 36 $125,840 88 $114,658 434 $114,174 5 $27,918 0 $0 14 $82,571 FILES CLOSED FOR INCOMPLETENESS 7 $132,950 33 $98,729 63 $108,257 5 $30,732 0 $0 5 $89,246
Aggregated Statistics For Year 2002(Based on 8 partial tracts) A) FHA, FSA/RHS & VA B) Conventional C) Refinancings D) Home Improvement Loans F) Non-occupant Loans on Number Average Value Number Average Value Number Average Value Number Average Value Number Average Value
LOANS ORIGINATED 458 $110,615 514 $98,989 962 $105,942 59 $18,161 99 $85,382 APPLICATIONS APPROVED, NOT ACCEPTED 2 $151,675 43 $98,094 133 $102,575 19 $15,582 8 $66,258 APPLICATIONS DENIED 41 $109,636 81 $79,888 346 $120,429 53 $11,027 13 $159,282 APPLICATIONS WITHDRAWN 39 $119,502 67 $105,567 208 $116,227 3 $33,417 12 $177,784 FILES CLOSED FOR INCOMPLETENESS 0 $0 21 $94,886 58 $119,987 0 $0 0 $0
Aggregated Statistics For Year 2001(Based on 8 partial tracts) A) FHA, FSA/RHS & VA B) Conventional C) Refinancings D) Home Improvement Loans E) Loans on Dwellings For 5+ Families F) Non-occupant Loans on Number Average Value Number Average Value Number Average Value Number Average Value Number Average Value Number Average Value
LOANS ORIGINATED 466 $112,579 440 $98,150 954 $104,833 59 $16,632 1 $16,676,800 91 $88,544 APPLICATIONS APPROVED, NOT ACCEPTED 6 $106,195 32 $91,282 103 $144,501 21 $17,627 0 $0 4 $61,288 APPLICATIONS DENIED 63 $107,273 86 $72,922 329 $99,062 53 $15,355 0 $0 6 $56,082 APPLICATIONS WITHDRAWN 40 $113,409 38 $103,163 213 $97,449 6 $27,337 0 $0 7 $77,153 FILES CLOSED FOR INCOMPLETENESS 1 $128,150 11 $114,028 32 $90,552 0 $0 0 $0 0 $0
Aggregated Statistics For Year 2000(Based on 8 partial tracts) A) FHA, FSA/RHS & VA B) Conventional C) Refinancings D) Home Improvement Loans F) Non-occupant Loans on Number Average Value Number Average Value Number Average Value Number Average Value Number Average Value
LOANS ORIGINATED 341 $109,003 478 $99,090 256 $100,262 82 $21,728 59 $75,204 APPLICATIONS APPROVED, NOT ACCEPTED 10 $76,350 64 $87,147 79 $87,984 32 $18,385 4 $77,545 APPLICATIONS DENIED 60 $98,421 132 $65,608 272 $79,384 71 $19,186 11 $47,586 APPLICATIONS WITHDRAWN 46 $99,296 39 $102,283 165 $73,836 5 $39,486 2 $57,720 FILES CLOSED FOR INCOMPLETENESS 2 $94,775 8 $84,820 29 $86,476 0 $0 1 $57,600
Aggregated Statistics For Year 1999(Based on 5 partial tracts) A) FHA, FSA/RHS & VA B) Conventional C) Refinancings D) Home Improvement Loans E) Loans on Dwellings For 5+ Families F) Non-occupant Loans on Number Average Value Number Average Value Number Average Value Number Average Value Number Average Value Number Average Value
LOANS ORIGINATED 281 $108,257 277 $96,991 254 $94,076 63 $16,038 1 $86,890 29 $102,768 APPLICATIONS APPROVED, NOT ACCEPTED 4 $98,638 35 $81,606 79 $86,145 14 $12,022 0 $0 3 $66,433 APPLICATIONS DENIED 31 $101,253 62 $81,933 154 $98,999 44 $16,312 0 $0 9 $65,558 APPLICATIONS WITHDRAWN 29 $105,344 34 $103,405 92 $80,922 11 $40,753 0 $0 3 $53,853 FILES CLOSED FOR INCOMPLETENESS 1 $60,740 7 $107,647 22 $122,476 0 $0 0 $0 2 $230,755
Private Mortgage Insurance Companies Aggregated Statistics For Year 2009(Based on 10 partial tracts) A) Conventional B) Refinancings C) Non-occupant Loans on Number Average Value Number Average Value Number Average Value
LOANS ORIGINATED 62 $173,454 72 $190,111 4 $150,985 APPLICATIONS APPROVED, NOT ACCEPTED 20 $191,396 25 $171,946 6 $141,172 APPLICATIONS DENIED 4 $203,412 8 $176,380 0 $0 APPLICATIONS WITHDRAWN 8 $197,292 2 $202,390 2 $146,940 FILES CLOSED FOR INCOMPLETENESS 5 $115,546 5 $186,066 2 $154,260
Aggregated Statistics For Year 2008(Based on 10 partial tracts) A) Conventional B) Refinancings C) Non-occupant Loans on Number Average Value Number Average Value Number Average Value
LOANS ORIGINATED 223 $169,724 82 $178,988 22 $142,772 APPLICATIONS APPROVED, NOT ACCEPTED 69 $172,814 31 $209,304 4 $140,232 APPLICATIONS DENIED 16 $162,424 4 $192,212 10 $142,078 APPLICATIONS WITHDRAWN 9 $166,777 2 $262,025 1 $229,900 FILES CLOSED FOR INCOMPLETENESS 6 $174,283 3 $186,207 0 $0
Aggregated Statistics For Year 2007(Based on 10 partial tracts) A) Conventional B) Refinancings C) Non-occupant Loans on Number Average Value Number Average Value Number Average Value
LOANS ORIGINATED 466 $160,442 107 $164,611 32 $144,638 APPLICATIONS APPROVED, NOT ACCEPTED 44 $170,359 22 $155,435 6 $137,135 APPLICATIONS DENIED 8 $194,649 7 $141,753 2 $181,060 APPLICATIONS WITHDRAWN 18 $178,152 5 $182,450 2 $128,945 FILES CLOSED FOR INCOMPLETENESS 3 $126,327 0 $0 0 $0
Aggregated Statistics For Year 2006(Based on 10 partial tracts) A) Conventional B) Refinancings C) Non-occupant Loans on Number Average Value Number Average Value Number Average Value
LOANS ORIGINATED 234 $154,877 84 $143,142 40 $124,481 APPLICATIONS APPROVED, NOT ACCEPTED 28 $166,557 17 $143,920 8 $98,372 APPLICATIONS DENIED 1 $191,780 5 $185,144 4 $159,918 APPLICATIONS WITHDRAWN 8 $153,844 5 $187,232 0 $0 FILES CLOSED FOR INCOMPLETENESS 0 $0 1 $49,180 0 $0
Aggregated Statistics For Year 2005(Based on 10 partial tracts) A) Conventional B) Refinancings C) Non-occupant Loans on Number Average Value Number Average Value Number Average Value
LOANS ORIGINATED 232 $142,971 92 $139,830 42 $101,292 APPLICATIONS APPROVED, NOT ACCEPTED 19 $144,427 36 $137,081 7 $133,136 APPLICATIONS DENIED 3 $154,140 2 $145,245 1 $229,950 APPLICATIONS WITHDRAWN 8 $151,649 4 $126,422 2 $181,660 FILES CLOSED FOR INCOMPLETENESS 0 $0 1 $277,550 0 $0
Aggregated Statistics For Year 2004(Based on 10 partial tracts) A) Conventional B) Refinancings C) Non-occupant Loans on D) Loans On Manufactured Number Average Value Number Average Value Number Average Value Number Average Value
LOANS ORIGINATED 179 $143,354 114 $130,519 19 $101,118 1 $35,630 APPLICATIONS APPROVED, NOT ACCEPTED 28 $153,494 42 $128,763 4 $115,990 0 $0 APPLICATIONS DENIED 0 $0 0 $0 0 $0 0 $0 APPLICATIONS WITHDRAWN 10 $149,904 11 $121,126 2 $78,830 0 $0 FILES CLOSED FOR INCOMPLETENESS 0 $0 0 $0 0 $0 0 $0
Aggregated Statistics For Year 2003(Based on 10 partial tracts) A) Conventional B) Refinancings C) Non-occupant Loans on Number Average Value Number Average Value Number Average Value
LOANS ORIGINATED 183 $132,379 359 $124,268 17 $102,951 APPLICATIONS APPROVED, NOT ACCEPTED 27 $120,429 47 $126,873 8 $85,014 APPLICATIONS DENIED 0 $0 4 $121,850 0 $0 APPLICATIONS WITHDRAWN 4 $157,175 10 $158,355 1 $75,050 FILES CLOSED FOR INCOMPLETENESS 0 $0 3 $121,907 0 $0
Aggregated Statistics For Year 2002(Based on 8 partial tracts) A) Conventional B) Refinancings C) Non-occupant Loans on Number Average Value Number Average Value Number Average Value
LOANS ORIGINATED 137 $123,747 187 $120,778 14 $89,887 APPLICATIONS APPROVED, NOT ACCEPTED 18 $122,223 21 $118,474 2 $87,610 APPLICATIONS DENIED 2 $74,295 1 $144,680 1 $136,050 APPLICATIONS WITHDRAWN 1 $66,770 5 $147,168 0 $0 FILES CLOSED FOR INCOMPLETENESS 0 $0 1 $210,840 0 $0
Aggregated Statistics For Year 2001(Based on 8 partial tracts) A) Conventional B) Refinancings C) Non-occupant Loans on Number Average Value Number Average Value Number Average Value
LOANS ORIGINATED 137 $121,979 151 $121,847 8 $114,764 APPLICATIONS APPROVED, NOT ACCEPTED 18 $129,177 18 $115,889 1 $102,440 APPLICATIONS DENIED 0 $0 1 $188,470 0 $0 APPLICATIONS WITHDRAWN 0 $0 3 $96,930 0 $0 FILES CLOSED FOR INCOMPLETENESS 0 $0 1 $115,550 0 $0
Aggregated Statistics For Year 2000(Based on 8 partial tracts) A) Conventional B) Refinancings C) Non-occupant Loans on Number Average Value Number Average Value Number Average Value
LOANS ORIGINATED 146 $125,433 31 $109,424 4 $83,222 APPLICATIONS APPROVED, NOT ACCEPTED 13 $118,051 8 $116,580 0 $0 APPLICATIONS DENIED 5 $116,010 5 $131,694 0 $0 APPLICATIONS WITHDRAWN 0 $0 1 $231,090 0 $0 FILES CLOSED FOR INCOMPLETENESS 0 $0 0 $0 0 $0
Aggregated Statistics For Year 1999(Based on 5 partial tracts) A) Conventional B) Refinancings C) Non-occupant Loans on Number Average Value Number Average Value Number Average Value
LOANS ORIGINATED 68 $120,830 39 $105,494 3 $76,713 APPLICATIONS APPROVED, NOT ACCEPTED 7 $119,771 7 $131,153 0 $0 APPLICATIONS DENIED 2 $122,625 2 $81,150 0 $0 APPLICATIONS WITHDRAWN 0 $0 2 $100,450 0 $0 FILES CLOSED FOR INCOMPLETENESS 0 $0 0 $0 0 $0
2002 - 2018 National Fire Incident Reporting System (NFIRS) incidents See full 2006 National Fire Incident Reporting System statistics for zip code 37128, Tennessee
Most common first names in zip code 37128 among deceased individuals Name Count Lived (average)
William 28 73.3 years James 27 73.1 years Robert 25 70.3 years John 23 77.0 years Mary 23 82.0 years Charles 13 68.7 years Frances 13 84.2 years Betty 13 68.8 years Thomas 11 71.1 years George 10 77.2 years
Most common last names in zip code 37128 among deceased individuals Last name Count Lived (average)
Smith 18 73.7 years Adams 8 70.6 years Brown 6 69.6 years Martin 6 77.0 years Williams 6 81.5 years Jones 6 76.0 years Hoover 5 85.6 years Carter 5 72.8 years Mcdonald 5 78.0 years Davis 5 73.0 years
Businesses in zip code 37128
Name Count Name Count
AT&T 1 Papa John's Pizza 1 AutoZone 1 Pizza Hut 1 CVS 2 Publix Super Markets 2 Dairy Queen 1 Rite Aid 1 Domino's Pizza 1 SAS Shoes 1 FedEx 1 SONIC Drive-In 1 Hardee's 1 Subway 1 Kohl's 1 Taco Bell 1 Kroger 1 U-Haul 1 Little Caesars Pizza 1 UPS 1 McDonald's 1 Waffle House 1 Nike 1 Walgreens 2
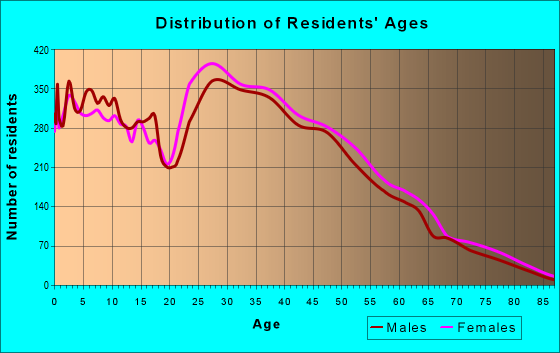
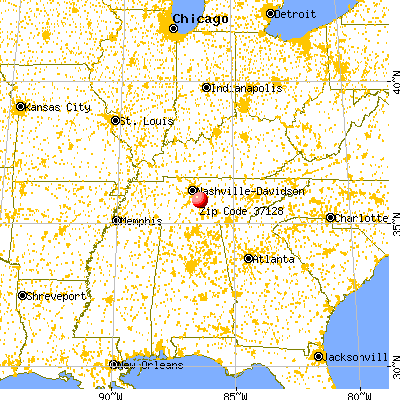


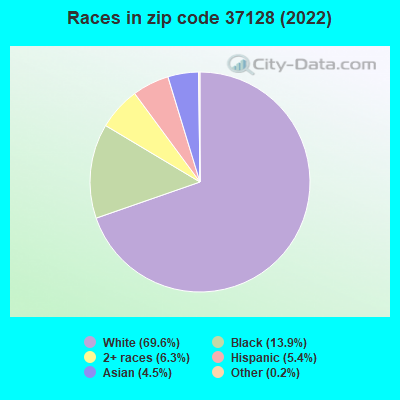


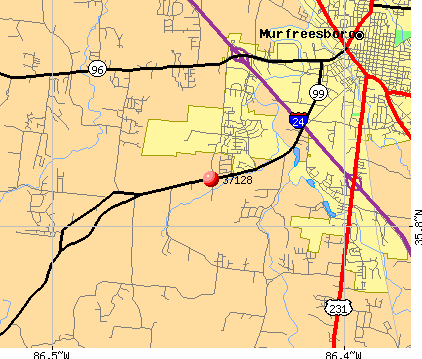 Nearest zip codes: 37153, 37132, 37060, 37129, 37037, 37127.
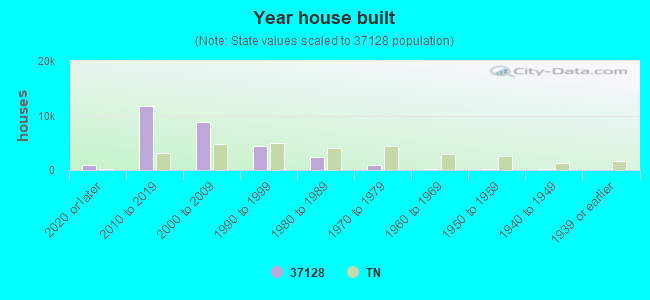
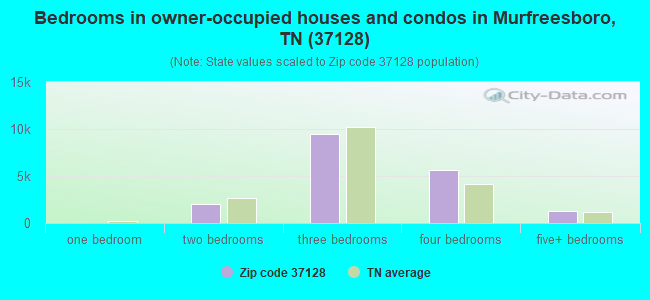
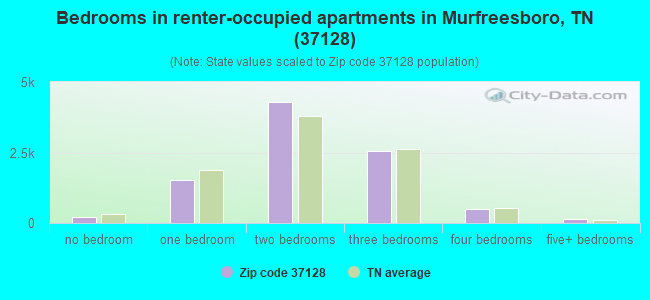
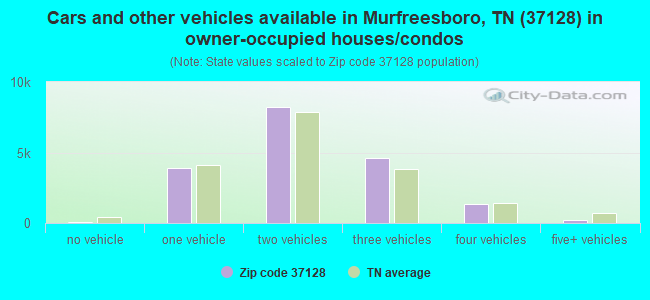
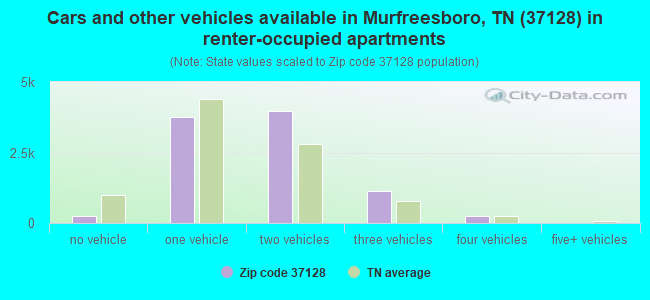


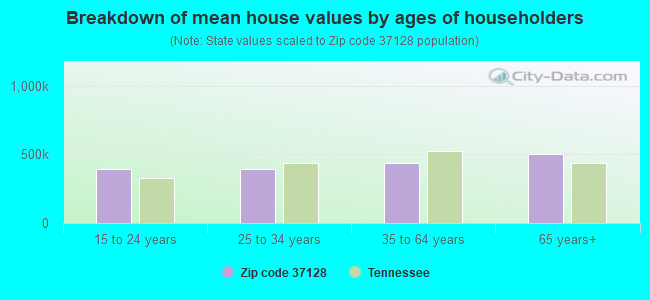


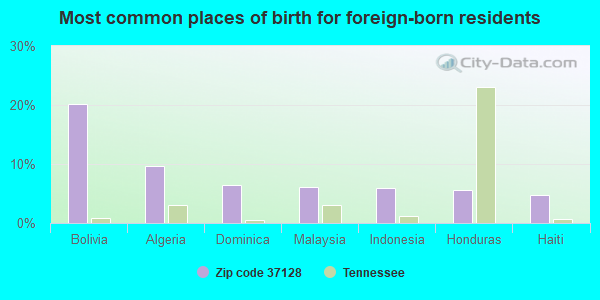
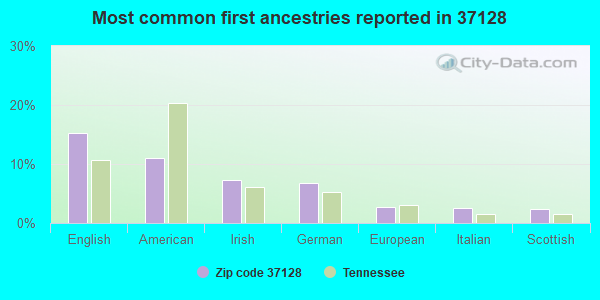
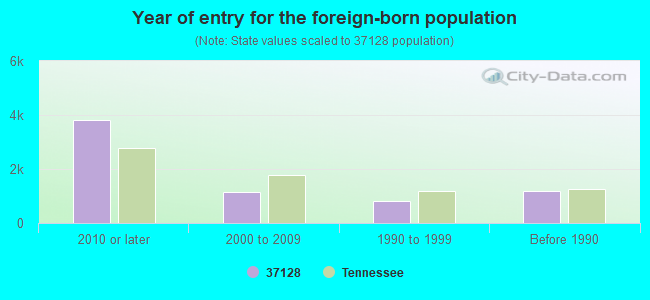
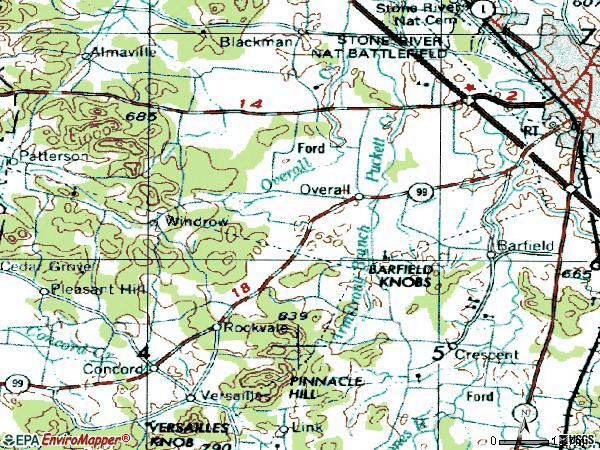

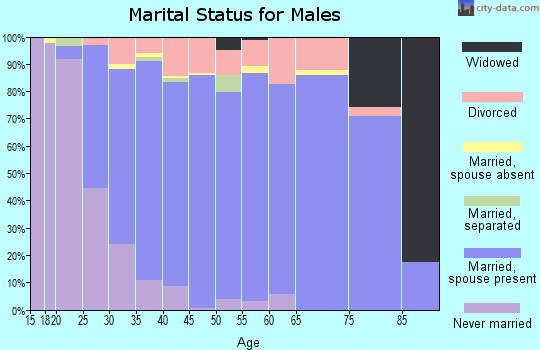

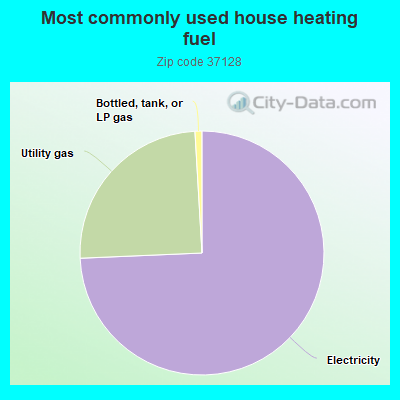
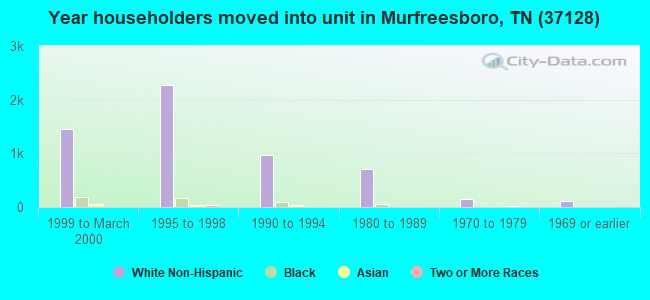
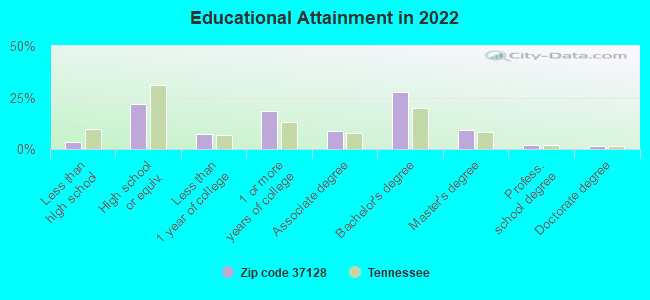
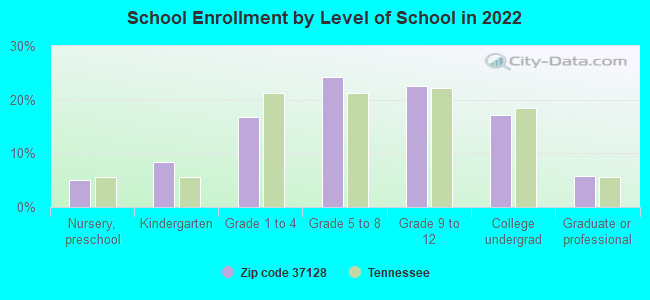
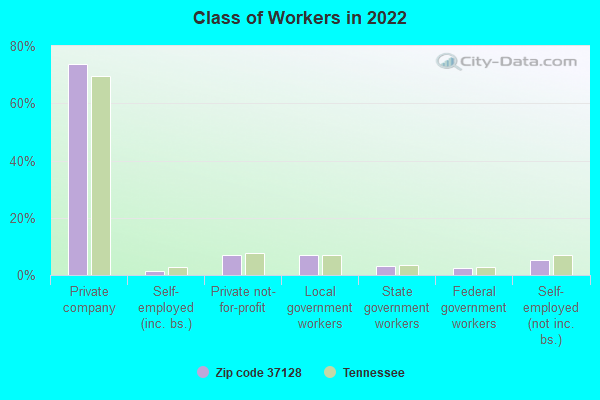


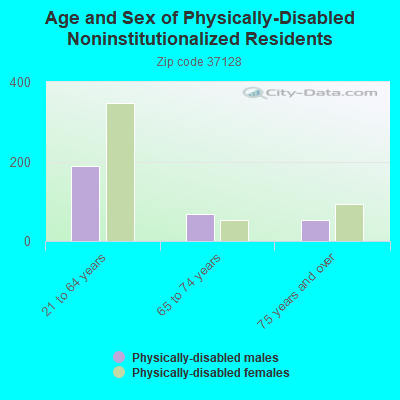

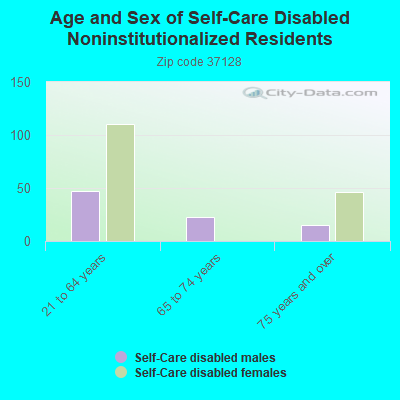
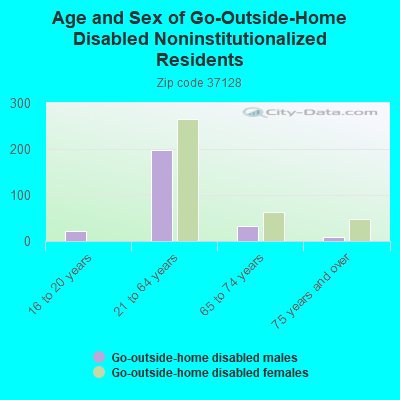

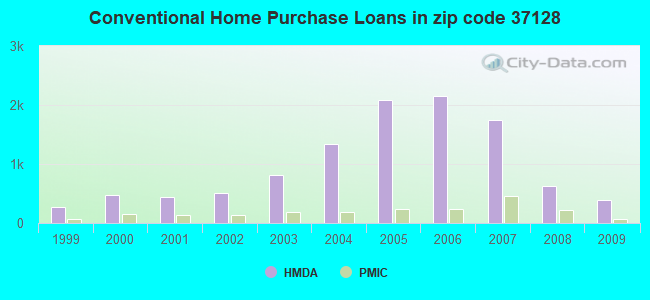
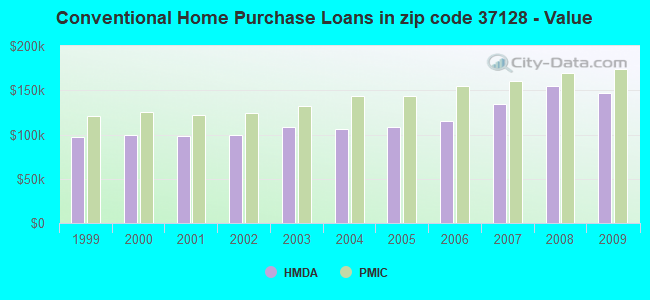
 Based on the data from the years 2002 - 2018 the average number of fires per year is 97. The highest number of reported fire incidents - 180 took place in 2010, and the least - 21 in 2002. The data has a rising trend.
 When looking into fire subcategories, the most reports belonged to: Outside Fires (45.4%), and Structure Fires (35.2%).