Estimated zip code population in 2022: 3,027 Zip code population in 2010: 2,114 Zip code population in 2000: 1,219
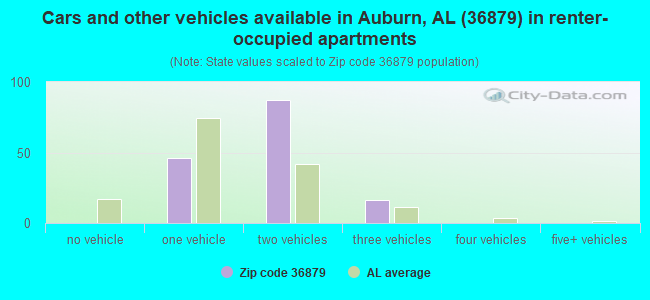
Houses and condos: 1,057 Renter-occupied apartments: 149
% of renters here:
14%
State:
30%
March 2022 cost of living index in zip code 36879: 81.1 (low, U.S. average is 100)
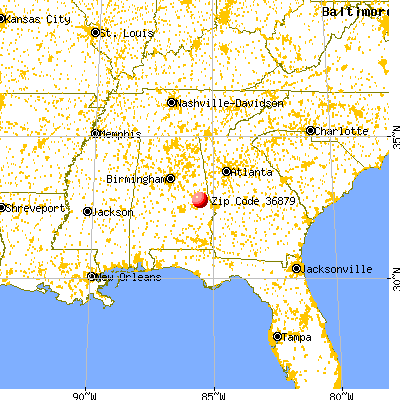
Land area: 88.0 sq. mi. Water area: 0.2 sq. mi.
Population density: 34 people per square mile
(very low).
OSM Map
General Map
Google Map
MSN Map
OSM Map
General Map
Google Map
MSN Map
OSM Map
General Map
Google Map
MSN Map
OSM Map
General Map
Google Map
MSN Map
Please wait while loading the map...
Real estate property taxes paid for housing units in 2022:
This zip code:
0.3% ($1,097)
Alabama:
0.4% ($718)
Median real estate property taxes paid for housing units with mortgages in 2022: $1,340 (0.4%) Median real estate property taxes paid for housing units with no mortgage in 2022: $548 (0.2%)
Business Search- 14 Million verified businesses
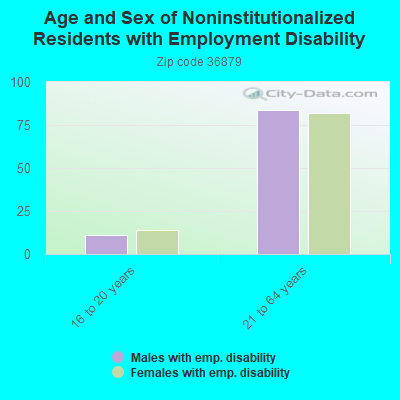
Males: 1,832
(60.6%)
Females: 1,193
(39.4%)
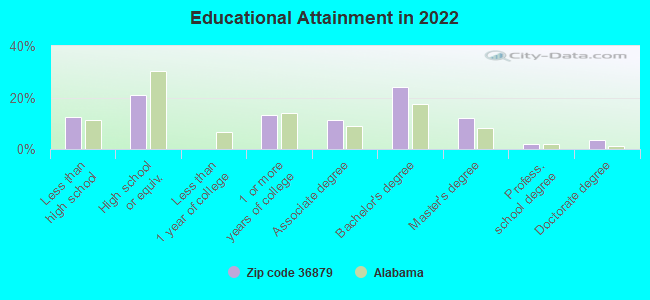
For population 25 years and over in 36879:
High school or higher: 87.5%
Bachelor's degree or higher: 41.6%
Graduate or professional degree: 17.5%
Unemployed: 3.2%
Mean travel time to work (commute): 26.1 minutes
For population 15 years and over in 36879:
Never married: 29.8%
Now married: 61.5%
Separated: 0.0%
Widowed: 3.6%
Divorced: 5.1%
Zip code 36879 compared to state average:
Median household income above state average.
Median house value above state average.
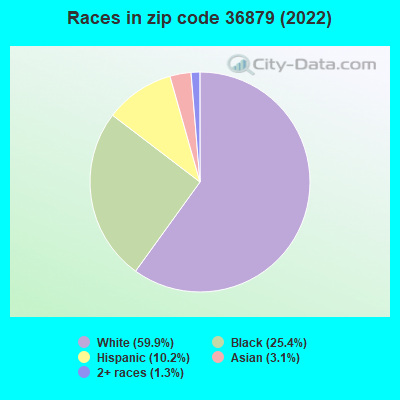
Hispanic race population percentage above state average.
Median age above state average.
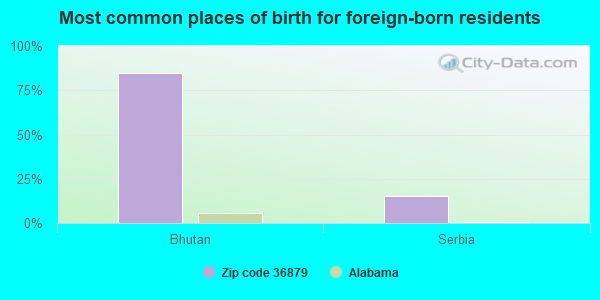
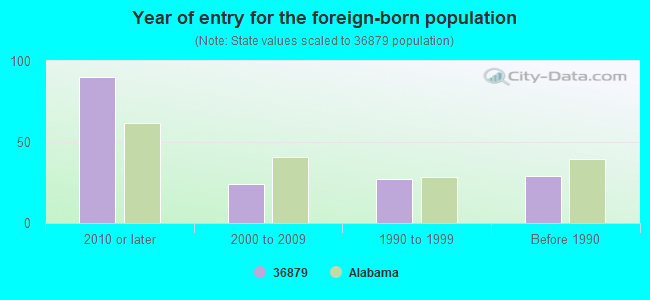
Foreign-born population percentage below state average.
Renting percentage below state average.
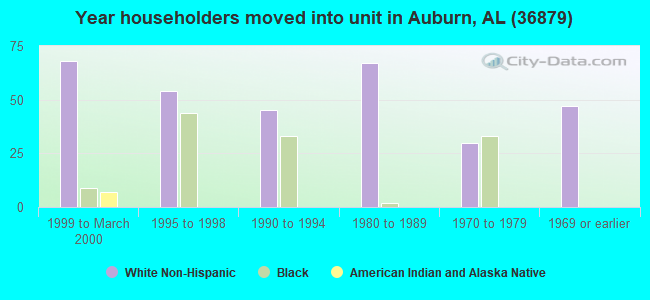
Length of stay since moving in significantly above state average.
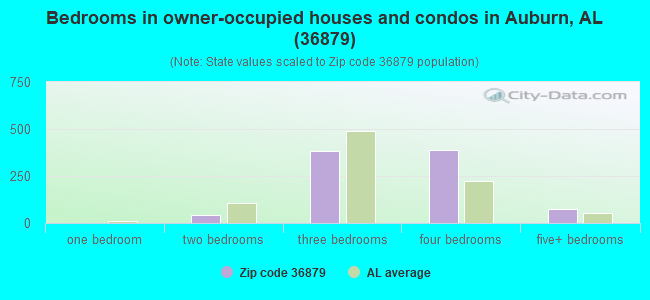
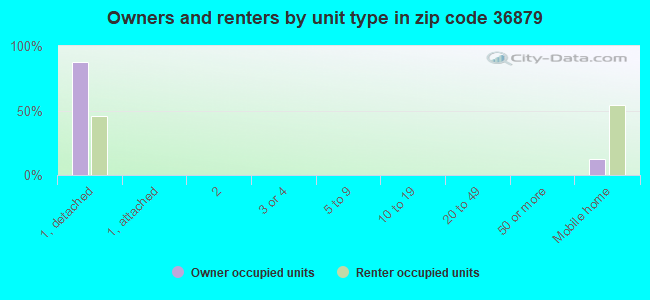
Number of rooms per house above state average.
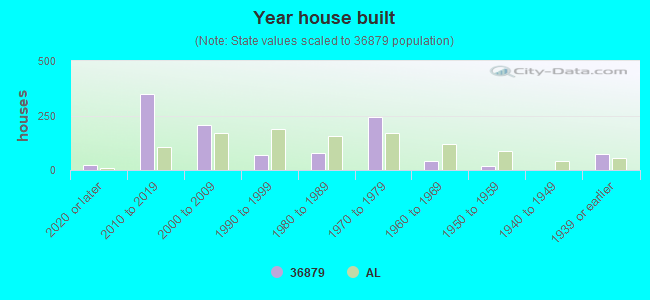
House age below state average.
Percentage of population with a bachelor's degree or higher above state average.
Averages for the 2020 tax year for zip code 36879, filed in 2021:
Average Adjusted Gross Income (AGI) in 2020: $94,343 (Individual Income Tax Returns)
Here:
$94,343
State:
$63,984
Salary/wage: $78,638 (reported on 83.7% of returns)
Here:
$78,638
State:
$52,834
(% of AGI for various income ranges: 1336.2% for AGIs below $25k, 4172.7% for AGIs $25k-50k, 6865.0% for AGIs $50k-75k, 10031.4% for AGIs $75k-100k, 19962.9% for AGIs $100k-200k, 79023.3% for AGIs over 200k)
Taxable interest for individuals: $804 (reported on 39.8% of returns)
This zip code:
$804
Alabama:
$1,615
(% of AGI for various income ranges: 2.9% for AGIs below $25k, 46.0% for AGIs $25k-50k, 65.0% for AGIs $50k-75k, 42.9% for AGIs $75k-100k, 53.5% for AGIs $100k-200k, 440.0% for AGIs over 200k)
Ordinary dividends: $4,484 (reported on 25.2% of returns)
Here:
$4,484
State:
$7,660
(% of AGI for various income ranges: 20.0% for AGIs below $25k, 75.3% for AGIs $25k-50k, 102.0% for AGIs $50k-75k, 71.4% for AGIs $75k-100k, 180.6% for AGIs $100k-200k, 2566.7% for AGIs over 200k)
Net capital gain/loss in AGI: +$16,148 (reported on 22.0% of returns)
Here:
+$16,148
State:
+$23,528
(% of AGI for various income ranges: 1.2% for AGIs below $25k, 63.3% for AGIs $25k-50k, 124.0% for AGIs $50k-75k, 241.4% for AGIs $75k-100k, 346.5% for AGIs $100k-200k, 11266.7% for AGIs over 200k)
Profit/loss from business: +$12,485 (reported on 21.1% of returns)
Here:
+$12,485
State:
+$9,534
(% of AGI for various income ranges: 50.4% for AGIs below $25k, 169.3% for AGIs $25k-50k, 525.0% for AGIs $50k-75k, 464.3% for AGIs $75k-100k, 820.0% for AGIs $100k-200k, 2090.0% for AGIs over 200k)
Taxable individual retirement arrangement distribution: $16,230 (reported on 8.1% of returns)
36879:
$16,230
Alabama:
$19,004
(% of AGI for various income ranges: 89.6% for AGIs below $25k, 419.0% for AGIs $50k-75k, 581.8% for AGIs $100k-200k)
Total itemized deductions: $41,688 (reported on 13.8% of returns)
Here:
$41,688
State:
$37,338
(% of AGI for various income ranges: 1311.0% for AGIs $50k-75k, 1091.2% for AGIs $100k-200k, 13070.0% for AGIs over 200k)
Charity contributions: $15,627 (reported on 12.2% of returns)
Here:
$15,627
State:
$18,005
(% of AGI for various income ranges: 356.0% for AGIs $50k-75k, 253.5% for AGIs $100k-200k, 5190.0% for AGIs over 200k)
Taxes paid: $7,612 (reported on 13.8% of returns)
36879:
$7,612
State:
$6,484
(% of AGI for various income ranges: 198.0% for AGIs $50k-75k, 293.5% for AGIs $100k-200k, 1990.0% for AGIs over 200k)
Earned income credit: $2,362 (reported on 13.0% of returns)
Here:
$2,362
State:
$2,628
(% of AGI for various income ranges: 107.5% for AGIs below $25k, 80.0% for AGIs $25k-50k)
Percentage of individuals using paid preparers for their 2020 taxes: 92.7%
Here:
93%
State:
93%
(% for various income ranges: 93.9% for AGIs below $25k, 91.3% for AGIs $25k-50k, 93.3% for AGIs $50k-75k, 90.9% for AGIs $75k-100k, 93.5% for AGIs $100k-200k, 90.0% for AGIs over 200k)
Averages for the 2012 tax year for zip code 36879, filed in 2013:
Average Adjusted Gross Income (AGI) in 2012: $57,507 (Individual Income Tax Returns)
Here:
$57,507
State:
$52,001
Salary/wage: $50,300 (reported on 84.1% of returns)
Here:
$50,300
State:
$43,822
(% of AGI for various income ranges: 81.0% for AGIs below $25k, 80.3% for AGIs $25k-50k, 84.0% for AGIs $50k-75k, 74.7% for AGIs $75k-100k, 98.0% for AGIs $100k-200k)
Taxable interest for individuals: $638 (reported on 35.4% of returns)
This zip code:
$638
Alabama:
$1,592
(% of AGI for various income ranges: 0.5% for AGIs below $25k, 0.5% for AGIs $25k-50k, 0.3% for AGIs $50k-75k, 0.4% for AGIs $75k-100k, 0.5% for AGIs $100k-200k)
Ordinary dividends: $2,138 (reported on 15.9% of returns)
Here:
$2,138
State:
$5,697
(% of AGI for various income ranges: 1.1% for AGIs below $25k, 1.1% for AGIs $25k-50k, 1.1% for AGIs $75k-100k, 0.6% for AGIs $100k-200k)
Net capital gain/loss in AGI: +$542 (reported on 14.6% of returns)
Here:
+$542
State:
+$13,286
(% of AGI for various income ranges: 0.4% for AGIs $25k-50k, 0.4% for AGIs $50k-75k)
Profit/loss from business: +$7,631 (reported on 19.5% of returns)
Here:
+$7,631
State:
+$9,151
(% of AGI for various income ranges: 6.5% for AGIs below $25k, 3.2% for AGIs $25k-50k, 2.6% for AGIs $50k-75k, 3.5% for AGIs $100k-200k)
Taxable individual retirement arrangement distribution: $11,933 (reported on 7.3% of returns)
36879:
$11,933
Alabama:
$14,992
Total itemized deductions: $22,852 (23% of AGI, reported on 35.4% of returns)
Here:
$22,852
State:
$21,388
Here:
22.5% of AGI
State:
20.1% of AGI
(% of AGI for various income ranges: 9.9% for AGIs below $25k, 14.1% for AGIs $25k-50k, 14.1% for AGIs $50k-75k, 18.2% for AGIs $75k-100k, 19.8% for AGIs $100k-200k)
Charity contributions: $5,023 (reported on 31.7% of returns)
Here:
$5,023
State:
$5,925
(% of AGI for various income ranges: 3.4% for AGIs $25k-50k, 2.2% for AGIs $50k-75k, 3.1% for AGIs $75k-100k, 4.5% for AGIs $100k-200k)
Taxes paid: $5,903 (reported on 35.4% of returns)
36879:
$5,903
State:
$5,272
(% of AGI for various income ranges: 1.4% for AGIs below $25k, 2.5% for AGIs $25k-50k, 3.2% for AGIs $50k-75k, 4.2% for AGIs $75k-100k, 6.3% for AGIs $100k-200k)
Earned income credit: $2,378 (reported on 22.0% of returns)
Here:
$2,378
State:
$2,646
(% of AGI for various income ranges: 9.1% for AGIs below $25k, 1.1% for AGIs $25k-50k)
Percentage of individuals using paid preparers for their 2012 taxes: 63.4%
Here:
63%
State:
60%
(% for various income ranges: 64.5% for AGIs below $25k, 68.4% for AGIs $25k-50k, 60.0% for AGIs $50k-75k, 57.1% for AGIs $75k-100k, 69.2% for AGIs $100k-200k)
Averages for the 2004 tax year for zip code 36879, filed in 2005:
Average Adjusted Gross Income (AGI) in 2004: $34,844 (Individual Income Tax Returns)
Here:
$34,844
State:
$42,302
Salary/wage: $32,703 (reported on 84.8% of returns)
Here:
$32,703
State:
$36,626
(% of AGI for various income ranges: 86.2% for AGIs below $10k, 82.9% for AGIs $10k-25k, 82.7% for AGIs $25k-50k, 81.3% for AGIs $50k-75k, 85.4% for AGIs $75k-100k, 67.1% for AGIs over 100k)
Taxable interest for individuals: $854 (reported on 32.5% of returns)
This zip code:
$854
Alabama:
$1,827
(% of AGI for various income ranges: 3.8% for AGIs below $10k, 0.5% for AGIs $10k-25k, 0.8% for AGIs $25k-50k, 1.0% for AGIs $50k-75k, 0.4% for AGIs $75k-100k, 0.7% for AGIs over 100k)
Taxable dividends: $3,265 (reported on 16.6% of returns)
Here:
$3,265
State:
$4,206
(% of AGI for various income ranges: 4.1% for AGIs below $10k, 1.5% for AGIs $10k-25k, 0.5% for AGIs $25k-50k, 0.9% for AGIs $50k-75k, 0.2% for AGIs $75k-100k, 4.0% for AGIs over 100k)
Net capital gain/loss: +$4,309 (reported on 11.5% of returns)
Here:
+$4,309
State:
+$13,031
(% of AGI for various income ranges: -1.2% for AGIs below $10k, -0.2% for AGIs $25k-50k, 0.3% for AGIs $50k-75k, 6.5% for AGIs over 100k)
Profit/loss from business: +$5,627 (reported on 14.0% of returns)
Here:
+$5,627
State:
+$8,302
(% of AGI for various income ranges: 22.5% for AGIs below $10k, 5.2% for AGIs $10k-25k, 3.3% for AGIs $25k-50k, 0.0% for AGIs $75k-100k)
Total itemized deductions: $15,127 (23% of AGI, reported on 24.0% of returns)
Here:
$15,127
State:
$17,623
Here:
23.2% of AGI
State:
20.8% of AGI
(% of AGI for various income ranges: 6.8% for AGIs $10k-25k, 11.1% for AGIs $25k-50k, 8.8% for AGIs $50k-75k, 12.2% for AGIs $75k-100k, 13.6% for AGIs over 100k)
Charity contributions deductions: $3,372 (5% of AGI, reported on 21.8% of returns)
Here:
$3,372
State:
$4,768
Here:
5.1% of AGI
State:
5.4% of AGI
(% of AGI for various income ranges: 1.0% for AGIs $10k-25k, 2.1% for AGIs $25k-50k, 1.2% for AGIs $50k-75k, 2.6% for AGIs $75k-100k, 3.7% for AGIs over 100k)
Total tax: $4,625 (reported on 66.3% of returns)
36879:
$4,625
State:
$6,905
(% of AGI for various income ranges: 2.0% for AGIs below $10k, 3.0% for AGIs $10k-25k, 6.2% for AGIs $25k-50k, 8.8% for AGIs $50k-75k, 10.6% for AGIs $75k-100k, 15.4% for AGIs over 100k)
Earned income credit: $1,966 (reported on 29.6% of returns)
Here:
$1,966
State:
$2,048
Percentage of individuals using paid preparers for their 2004 taxes: 67.0%
Here:
67%
State:
65%
(% for various income ranges: 59.8% for AGIs below $10k, 69.5% for AGIs $10k-25k, 70.9% for AGIs $25k-50k, 62.5% for AGIs $50k-75k, 73.7% for AGIs $75k-100k, 62.5% for AGIs over 100k)
Likely homosexual households (counted as self-reported same-sex unmarried-partner households)
Lesbian couples: 1.4% of all households
Gay men: 0.0% of all households
Household received Food Stamps/SNAP in the past 12 months: 38 Household did not receive Food Stamps/SNAP in the past 12 months: 983
Women who had a birth in the past 12 months: 88 (100 now married, 0 unmarried) Women who did not have a birth in the past 12 months: 488 (378 now married, 107 unmarried)
Housing units in zip code 36879 with a mortgage: 591 (18 second mortgage, 13 both second mortgage and home equity loan) Houses without a mortgage: 65
Median monthly owner costs for units with a mortgage: $1,725 Median monthly owner costs for units without a mortgage: $271
Residents with income below the poverty level in 2022:
This zip code:
0.5%
Whole state:
16.2%
Residents with income below 50% of the poverty level in 2022:
This zip code:
0.3%
Whole state:
8.6%
Median number of rooms in houses and condos:
Here:
7.6
State:
6.5
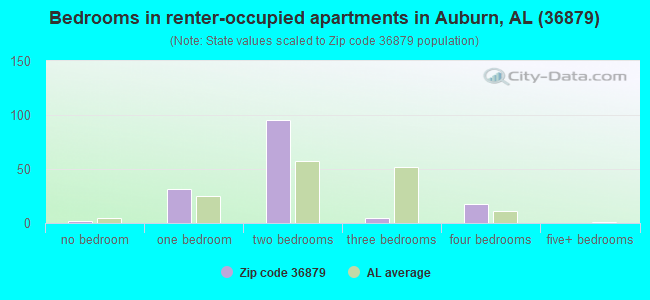
Median number of rooms in apartments:
Here:
4.6
State:
4.7
Notable locations in this zip code not listed on our city pages
Churches in zip code 36879 include: Mount Olive Church (A), Mount Sinai Church (B), Mount Traveler Church (C), New Canaan Church (D), Peace and Goodwill Church (E), Macon Spring Church (F), Gold Hill Methodist Church (G), New Harmony Church (H), Allens Chapel (I). Display/hide their locations on the map
Cemeteries: Waverly Cemetery (1), Daniel-Caldwell Cemetery (2), Peace and Goodwill Cemetery (3), Ridge Grove Cemetery (4), Rowells Cemetery (5), Maddox Family Cemetery (6), Oak Bowery Cemetery (7). Display/hide their locations on the map
Streams, rivers, and creeks: Seroyer Branch (A), Little Loblockee Creek (B), Pretty Creek (C), Gin Branch (D), Emfinger Branch (E), Swingle Creek (F), Webb Branch (G). Display/hide their locations on the map
A T & T (ON TALLAPOOSA COUNTY RD 18 in ROXANA, AL)
(Resource Conservation and Recovery Act (tracking hazardous waste))
Housing units lacking complete plumbing facilities: 1.7% Housing units lacking complete kitchen facilities: 0.6%
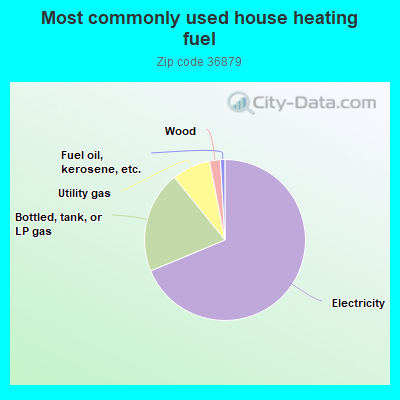
68.8%Electricity
20.5%Bottled, tank, or LP gas
7.7%Utility gas
2.2%Wood
0.9%Fuel oil, kerosene, etc.
Population in 1990: 1,689.
Place of birth for U.S.-born residents:
This state: 1,568
Northeast: 160
Midwest: 199
South: 737
West: 220
67% of the 36879 zip code residents lived in the same house 5 years ago. Out of people who lived in different houses, 44% lived in this county. Out of people who lived in different counties, 50% lived in Alabama.
89% of the 36879 zip code residents lived in the same house 1 year ago. Out of people who lived in different houses, 47% moved from this county. Out of people who lived in different houses, 18% moved from different county within same state. Out of people who lived in different houses, 8% moved from different state. Out of people who lived in different houses, 24% moved from abroad.
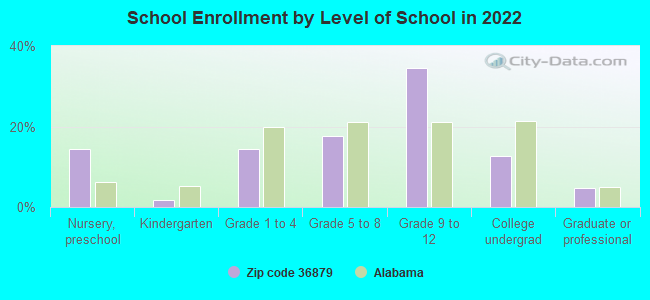
Private vs. public school enrollment:
Students in private schools in grades 1 to 8 (elementary and middle school): 44
Here:
20.0%
Alabama:
14.7%
Students in private schools in grades 9 to 12 (high school): 57
Here:
23.8%
Alabama:
16.3%
Students in private undergraduate colleges:
Here:
0.0%
Alabama:
14.6%
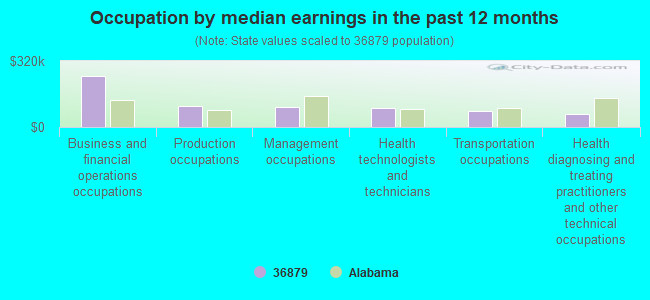
Occupation by median earnings in the past 12 months ($)
246,914Business and financial operations occupations
102,835Production occupations
95,418Management occupations
94,246Health technologists and technicians
78,043Transportation occupations
64,083Health diagnosing and treating practitioners and other technical occupations
Companies with federal contracts located in this zip code:
SOUTHEASTERN POND MANAGEMENT I (9944 HIGHWAY 280 W in WAVERLY, AL; small business)
$23,622 with Army for Water Quality Support Services. Taking place in GA. Signed on 2004-05-14. Completion date: 2004-07-15.
Top industries in this zip code by the number of employees in 2005:
Accommodation and Food Services: Full-Service Restaurants (10-19 employees: 1 establishment)
Construction: Electrical Contractors (5-9: 1)
Other Services (except Public Administration): Religious Organizations (1-4: 2)
Administrative and Support and Waste Management and Remediation Services: Landscaping Services (1-4: 1)
Real Estate and Rental and Leasing: Lessors of Residential Buildings and Dwellings (1-4: 1)
Construction: New Multifamily Housing Construction (except Operative Builders) (1-4: 1)
Fatal accident statistics in 2012:
Fatal accident count: 1
Vehicles involved in fatal accidents: 1
Fatal accidents caused by drunken drivers: 1
Fatalities: 1
Persons involved in fatal accidents: 2
Pedestrians involved in fatal accidents: 0
Fatal accident statistics in 2010:
Fatal accident count: 1
Vehicles involved in fatal accidents: 1
Fatal accidents caused by drunken drivers: 0
Fatalities: 1
Persons involved in fatal accidents: 3
Pedestrians involved in fatal accidents: 0
Home Mortgage Disclosure Act Aggregated Statistics For Year 2009 (Based on 1 partial tract)
A) FHA, FSA/RHS & VA Home Purchase Loans
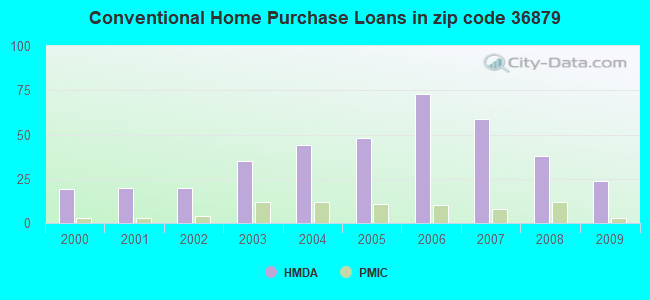
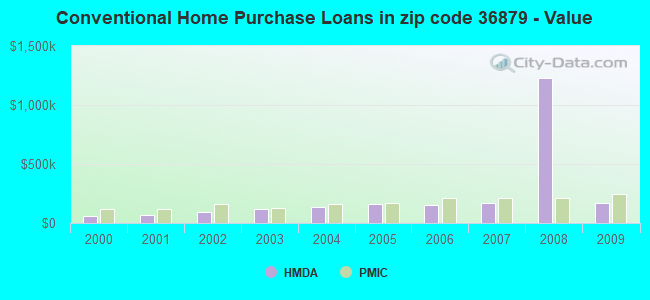
B) Conventional Home Purchase Loans
C) Refinancings
D) Home Improvement Loans
F) Non-occupant Loans on < 5 Family Dwellings (A B C & D)
G) Loans On Manufactured Home Dwelling (A B C & D)
Number
Average Value
Number
Average Value
Number
Average Value
Number
Average Value
Number
Average Value
Number
Average Value
LOANS ORIGINATED
12
$164,794
24
$171,098
56
$226,904
5
$98,652
5
$240,628
7
$41,853
APPLICATIONS APPROVED, NOT ACCEPTED
0
$0
1
$113,810
1
$210,710
0
$0
0
$0
1
$10,990
APPLICATIONS DENIED
1
$224,800
2
$65,775
15
$200,815
1
$68,450
1
$127,050
3
$38,123
APPLICATIONS WITHDRAWN
1
$83,100
2
$227,755
12
$204,491
0
$0
1
$189,580
0
$0
FILES CLOSED FOR INCOMPLETENESS
0
$0
1
$108,740
3
$270,527
0
$0
0
$0
0
$0
Aggregated Statistics For Year 2008 (Based on 1 partial tract)
A) FHA, FSA/RHS & VA Home Purchase Loans
B) Conventional Home Purchase Loans
C) Refinancings
D) Home Improvement Loans
F) Non-occupant Loans on < 5 Family Dwellings (A B C & D)
G) Loans On Manufactured Home Dwelling (A B C & D)
Number
Average Value
Number
Average Value
Number
Average Value
Number
Average Value
Number
Average Value
Number
Average Value
LOANS ORIGINATED
9
$211,338
38
$1,227,582
33
$2,289,743
5
$58,480
11
$688,449
11
$5,706,909
APPLICATIONS APPROVED, NOT ACCEPTED
1
$183,670
2
$147,610
3
$173,433
0
$0
1
$90,990
1
$54,930
APPLICATIONS DENIED
1
$223,110
3
$102,350
12
$190,593
5
$81,918
2
$131,415
4
$40,635
APPLICATIONS WITHDRAWN
2
$157,190
4
$199,795
6
$209,303
1
$66,760
0
$0
0
$0
FILES CLOSED FOR INCOMPLETENESS
0
$0
1
$98,030
3
$178,317
1
$79,440
0
$0
0
$0
Aggregated Statistics For Year 2007 (Based on 1 partial tract)
A) FHA, FSA/RHS & VA Home Purchase Loans
B) Conventional Home Purchase Loans
C) Refinancings
D) Home Improvement Loans
F) Non-occupant Loans on < 5 Family Dwellings (A B C & D)
G) Loans On Manufactured Home Dwelling (A B C & D)
Number
Average Value
Number
Average Value
Number
Average Value
Number
Average Value
Number
Average Value
Number
Average Value
LOANS ORIGINATED
3
$107,610
59
$168,375
25
$148,039
3
$33,803
12
$121,507
12
$33,992
APPLICATIONS APPROVED, NOT ACCEPTED
0
$0
3
$130,710
3
$103,667
1
$20,560
1
$44,790
1
$24,790
APPLICATIONS DENIED
0
$0
6
$121,553
15
$127,929
3
$58,123
2
$221,135
3
$34,273
APPLICATIONS WITHDRAWN
0
$0
4
$216,065
4
$210,782
1
$79,440
0
$0
0
$0
FILES CLOSED FOR INCOMPLETENESS
0
$0
0
$0
1
$148,170
0
$0
0
$0
0
$0
Aggregated Statistics For Year 2006 (Based on 1 partial tract)
A) FHA, FSA/RHS & VA Home Purchase Loans
B) Conventional Home Purchase Loans
C) Refinancings
D) Home Improvement Loans
F) Non-occupant Loans on < 5 Family Dwellings (A B C & D)
G) Loans On Manufactured Home Dwelling (A B C & D)
Number
Average Value
Number
Average Value
Number
Average Value
Number
Average Value
Number
Average Value
Number
Average Value
LOANS ORIGINATED
3
$106,200
73
$156,749
23
$172,621
4
$30,775
20
$117,554
11
$31,525
APPLICATIONS APPROVED, NOT ACCEPTED
0
$0
9
$163,323
3
$97,093
1
$44,790
5
$158,034
1
$37,750
APPLICATIONS DENIED
1
$67,040
5
$157,922
13
$156,105
4
$56,975
0
$0
3
$57,653
APPLICATIONS WITHDRAWN
0
$0
5
$139,724
8
$174,654
0
$0
1
$150,150
2
$87,325
FILES CLOSED FOR INCOMPLETENESS
0
$0
1
$83,950
2
$188,315
0
$0
0
$0
0
$0
Aggregated Statistics For Year 2005 (Based on 1 partial tract)
A) FHA, FSA/RHS & VA Home Purchase Loans
B) Conventional Home Purchase Loans
C) Refinancings
D) Home Improvement Loans
F) Non-occupant Loans on < 5 Family Dwellings (A B C & D)
G) Loans On Manufactured Home Dwelling (A B C & D)
Number
Average Value
Number
Average Value
Number
Average Value
Number
Average Value
Number
Average Value
Number
Average Value
LOANS ORIGINATED
1
$151,270
48
$162,547
23
$154,249
5
$103,272
12
$94,205
7
$24,186
APPLICATIONS APPROVED, NOT ACCEPTED
0
$0
2
$79,860
3
$166,110
1
$12,960
1
$54,090
1
$59,720
APPLICATIONS DENIED
0
$0
5
$84,792
11
$125,817
5
$31,832
1
$63,660
4
$34,508
APPLICATIONS WITHDRAWN
1
$65,640
4
$219,092
10
$154,484
2
$107,610
0
$0
2
$74,510
FILES CLOSED FOR INCOMPLETENESS
0
$0
1
$262,260
2
$184,230
0
$0
0
$0
0
$0
Aggregated Statistics For Year 2004 (Based on 1 partial tract)
A) FHA, FSA/RHS & VA Home Purchase Loans
B) Conventional Home Purchase Loans
C) Refinancings
D) Home Improvement Loans
F) Non-occupant Loans on < 5 Family Dwellings (A B C & D)
G) Loans On Manufactured Home Dwelling (A B C & D)
Number
Average Value
Number
Average Value
Number
Average Value
Number
Average Value
Number
Average Value
Number
Average Value
LOANS ORIGINATED
1
$188,740
44
$138,808
18
$141,085
3
$32,770
14
$99,460
6
$24,085
APPLICATIONS APPROVED, NOT ACCEPTED
0
$0
4
$169,795
2
$184,230
1
$36,900
1
$91,270
1
$47,040
APPLICATIONS DENIED
0
$0
6
$142,633
11
$89,171
2
$13,100
1
$53,800
4
$37,115
APPLICATIONS WITHDRAWN
0
$0
4
$145,145
6
$113,995
1
$33,800
0
$0
1
$81,130
FILES CLOSED FOR INCOMPLETENESS
1
$30,710
0
$0
3
$132,963
1
$91,550
1
$125,640
1
$38,030
Aggregated Statistics For Year 2003 (Based on 1 partial tract)
A) FHA, FSA/RHS & VA Home Purchase Loans
B) Conventional Home Purchase Loans
C) Refinancings
D) Home Improvement Loans
F) Non-occupant Loans on < 5 Family Dwellings (A B C & D)
Number
Average Value
Number
Average Value
Number
Average Value
Number
Average Value
Number
Average Value
LOANS ORIGINATED
1
$82,820
35
$119,223
35
$128,117
1
$10,990
12
$86,599
APPLICATIONS APPROVED, NOT ACCEPTED
0
$0
3
$96,903
2
$137,470
0
$0
1
$74,090
APPLICATIONS DENIED
0
$0
7
$35,011
8
$100,779
1
$13,520
1
$62,820
APPLICATIONS WITHDRAWN
0
$0
1
$217,190
7
$82,377
0
$0
1
$35,210
FILES CLOSED FOR INCOMPLETENESS
0
$0
0
$0
2
$94,510
0
$0
0
$0
Aggregated Statistics For Year 2002 (Based on 1 partial tract)
B) Conventional Home Purchase Loans
C) Refinancings
D) Home Improvement Loans
F) Non-occupant Loans on < 5 Family Dwellings (A B C & D)
Number
Average Value
Number
Average Value
Number
Average Value
Number
Average Value
LOANS ORIGINATED
20
$96,342
16
$116,483
5
$31,268
4
$86,412
APPLICATIONS APPROVED, NOT ACCEPTED
4
$49,790
1
$137,470
0
$0
0
$0
APPLICATIONS DENIED
10
$43,551
5
$77,186
1
$2,250
1
$62,540
APPLICATIONS WITHDRAWN
1
$43,660
3
$122,633
1
$12,680
0
$0
FILES CLOSED FOR INCOMPLETENESS
0
$0
2
$116,060
0
$0
0
$0
Aggregated Statistics For Year 2001 (Based on 1 partial tract)
A) FHA, FSA/RHS & VA Home Purchase Loans
B) Conventional Home Purchase Loans
C) Refinancings
D) Home Improvement Loans
F) Non-occupant Loans on < 5 Family Dwellings (A B C & D)
Number
Average Value
Number
Average Value
Number
Average Value
Number
Average Value
Number
Average Value
LOANS ORIGINATED
1
$137,190
20
$65,298
22
$113,448
3
$6,853
7
$80,767
APPLICATIONS APPROVED, NOT ACCEPTED
0
$0
4
$38,735
2
$32,960
0
$0
1
$17,180
APPLICATIONS DENIED
0
$0
15
$33,091
8
$94,334
2
$23,665
3
$32,490
APPLICATIONS WITHDRAWN
0
$0
1
$74,090
3
$109,393
0
$0
0
$0
FILES CLOSED FOR INCOMPLETENESS
0
$0
0
$0
1
$38,590
0
$0
0
$0
Aggregated Statistics For Year 2000 (Based on 1 partial tract)
A) FHA, FSA/RHS & VA Home Purchase Loans
B) Conventional Home Purchase Loans
C) Refinancings
D) Home Improvement Loans
F) Non-occupant Loans on < 5 Family Dwellings (A B C & D)


 Nearest zip codes: 36850, 36865, 36832, 36849, 36801, 36830.