Estimated zip code population in 2022: 2,958 Zip code population in 2010: 2,645 Zip code population in 2000: 2,523
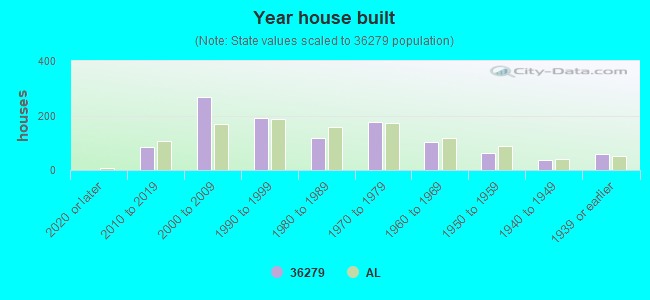
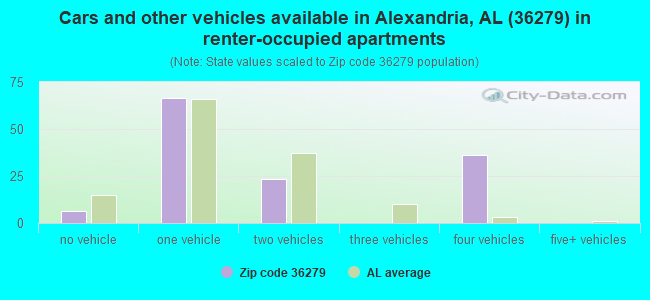
Houses and condos: 1,116 Renter-occupied apartments: 128
% of renters here:
12%
State:
30%
March 2022 cost of living index in zip code 36279: 82.7 (low, U.S. average is 100)
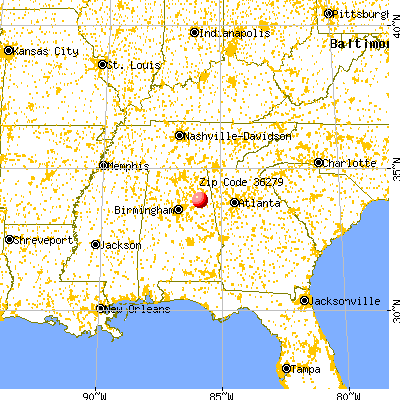
Land area: 29.7 sq. mi. Water area: 0.3 sq. mi.
Population density: 100 people per square mile
(very low).
OSM Map
General Map
Google Map
MSN Map
OSM Map
General Map
Google Map
MSN Map
OSM Map
General Map
Google Map
MSN Map
OSM Map
General Map
Google Map
MSN Map
Please wait while loading the map...
Real estate property taxes paid for housing units in 2022:
This zip code:
0.3% ($558)
Alabama:
0.4% ($718)
Median real estate property taxes paid for housing units with mortgages in 2022: $590 (0.3%) Median real estate property taxes paid for housing units with no mortgage in 2022: $531 (0.4%)
Business Search- 14 Million verified businesses
Males: 1,263
(42.7%)
Females: 1,696
(57.3%)
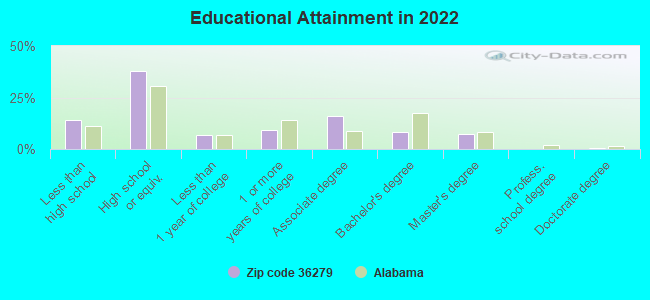
For population 25 years and over in 36279:
High school or higher: 86.0%
Bachelor's degree or higher: 16.1%
Graduate or professional degree: 7.7%
Unemployed: 3.9%
Mean travel time to work (commute): 29.2 minutes
For population 15 years and over in 36279:
Never married: 15.5%
Now married: 59.6%
Separated: 1.2%
Widowed: 7.8%
Divorced: 15.9%
Zip code 36279 compared to state average:
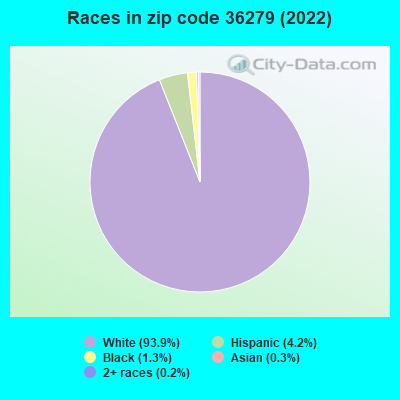
Black race population percentage significantly below state average.
Foreign-born population percentage significantly below state average.
Renting percentage significantly below state average.
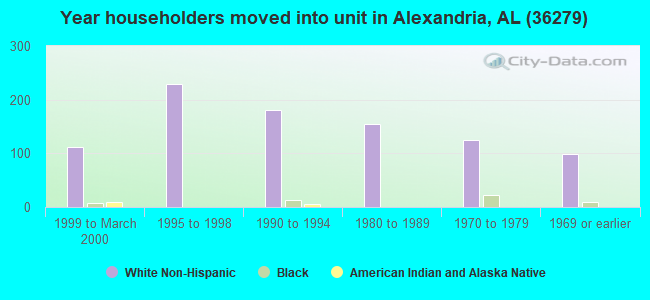
Length of stay since moving in significantly above state average.
Number of college students below state average.
Percentage of population with a bachelor's degree or higher below state average.
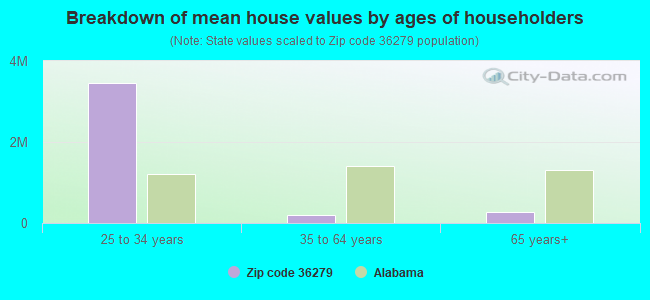
Estimated median house/condo value in 2022: $174,808
36279:
$174,808
Alabama:
$200,900
According to our research of Alabama and other state lists, there were 3 registered sex offenders living in 36279 zip code as of May 31, 2024. The ratio of all residents to sex offenders in zip code 36279 is 851 to 1. The ratio of registered sex offenders to all residents in this zip code is lower than the state average.
Median resident age:
This zip code:
41.0 years
Alabama median age:
39.6 years
Average household size:
This zip code:
2.9 people
Alabama:
2.5 people
Averages for the 2020 tax year for zip code 36279, filed in 2021:
Average Adjusted Gross Income (AGI) in 2020: $49,614 (Individual Income Tax Returns)
Here:
$49,614
State:
$63,984
Salary/wage: $46,269 (reported on 81.1% of returns)
Here:
$46,269
State:
$52,834
(% of AGI for various income ranges: 1132.9% for AGIs below $25k, 4202.9% for AGIs $25k-50k, 6122.0% for AGIs $50k-75k, 9045.6% for AGIs $75k-100k, 17650.0% for AGIs $100k-200k)
Taxable interest for individuals: $732 (reported on 27.9% of returns)
This zip code:
$732
Alabama:
$1,615
(% of AGI for various income ranges: 12.5% for AGIs below $25k, 22.1% for AGIs $25k-50k, 32.0% for AGIs $50k-75k, 11.1% for AGIs $75k-100k, 121.2% for AGIs $100k-200k)
Ordinary dividends: $1,938 (reported on 7.2% of returns)
Here:
$1,938
State:
$7,660
(% of AGI for various income ranges: 27.9% for AGIs $25k-50k, 10.0% for AGIs $50k-75k, 97.5% for AGIs $100k-200k)
Net capital gain/loss in AGI: +$4,317 (reported on 5.4% of returns)
Here:
+$4,317
State:
+$23,528
(% of AGI for various income ranges: 39.2% for AGIs $25k-50k, 206.2% for AGIs $100k-200k)
Profit/loss from business: +$8,539 (reported on 16.2% of returns)
Here:
+$8,539
State:
+$9,534
(% of AGI for various income ranges: 213.6% for AGIs below $25k, 108.7% for AGIs $25k-50k, 206.0% for AGIs $50k-75k, 115.6% for AGIs $75k-100k, 460.0% for AGIs $100k-200k)
Taxable individual retirement arrangement distribution: $9,200 (reported on 6.3% of returns)
36279:
$9,200
Alabama:
$19,004
(% of AGI for various income ranges: 38.6% for AGIs below $25k, 130.0% for AGIs $25k-50k, 248.9% for AGIs $75k-100k)
Total itemized deductions: $30,800 (reported on 7.2% of returns)
Here:
$30,800
State:
$37,338
(% of AGI for various income ranges: 696.7% for AGIs $25k-50k, 792.0% for AGIs $50k-75k)
Charity contributions: $10,275 (reported on 7.2% of returns)
Here:
$10,275
State:
$18,005
(% of AGI for various income ranges: 342.5% for AGIs $25k-50k)
Taxes paid: $3,380 (reported on 4.5% of returns)
36279:
$3,380
State:
$6,484
(% of AGI for various income ranges: 16.2% for AGIs $25k-50k, 130.0% for AGIs $50k-75k)
Earned income credit: $2,086 (reported on 19.8% of returns)
Here:
$2,086
State:
$2,628
(% of AGI for various income ranges: 105.0% for AGIs below $25k, 68.8% for AGIs $25k-50k)
Percentage of individuals using paid preparers for their 2020 taxes: 91.9%
Here:
92%
State:
93%
(% for various income ranges: 97.3% for AGIs below $25k, 80.6% for AGIs $25k-50k, 92.9% for AGIs $50k-75k, 100.0% for AGIs $75k-100k, 100.0% for AGIs $100k-200k)
Averages for the 2012 tax year for zip code 36279, filed in 2013:
Average Adjusted Gross Income (AGI) in 2012: $40,467 (Individual Income Tax Returns)
Here:
$40,467
State:
$52,001
Salary/wage: $38,312 (reported on 84.0% of returns)
Here:
$38,312
State:
$43,822
(% of AGI for various income ranges: 71.4% for AGIs below $25k, 77.4% for AGIs $25k-50k, 79.8% for AGIs $50k-75k, 84.0% for AGIs $75k-100k, 83.4% for AGIs $100k-200k)
Taxable interest for individuals: $484 (reported on 30.2% of returns)
This zip code:
$484
Alabama:
$1,592
(% of AGI for various income ranges: 0.7% for AGIs below $25k, 0.3% for AGIs $25k-50k, 0.5% for AGIs $50k-75k, 0.3% for AGIs $75k-100k, 0.1% for AGIs $100k-200k)
Ordinary dividends: $962 (reported on 7.5% of returns)
Here:
$962
State:
$5,697
(% of AGI for various income ranges: 0.2% for AGIs below $25k, 0.4% for AGIs $50k-75k, 0.2% for AGIs $75k-100k)
Net capital gain/loss in AGI: +$2,750 (reported on 3.8% of returns)
Here:
+$2,750
State:
+$13,286
Profit/loss from business: +$6,067 (reported on 14.2% of returns)
Here:
+$6,067
State:
+$9,151
(% of AGI for various income ranges: 5.4% for AGIs below $25k, 3.1% for AGIs $25k-50k, 1.3% for AGIs $50k-75k, 2.0% for AGIs $75k-100k)
Taxable individual retirement arrangement distribution: $7,586 (reported on 6.6% of returns)
36279:
$7,586
Alabama:
$14,992
Total itemized deductions: $18,682 (26% of AGI, reported on 20.8% of returns)
Here:
$18,682
State:
$21,388
Here:
26.1% of AGI
State:
20.1% of AGI
(% of AGI for various income ranges: 5.8% for AGIs below $25k, 10.2% for AGIs $25k-50k, 9.0% for AGIs $50k-75k, 10.9% for AGIs $75k-100k, 11.1% for AGIs $100k-200k)
Charity contributions: $5,439 (reported on 17.0% of returns)
Here:
$5,439
State:
$5,925
(% of AGI for various income ranges: 2.7% for AGIs $25k-50k, 2.3% for AGIs $50k-75k, 2.6% for AGIs $75k-100k, 3.0% for AGIs $100k-200k)
Taxes paid: $3,377 (reported on 20.8% of returns)
36279:
$3,377
State:
$5,272
(% of AGI for various income ranges: 0.5% for AGIs below $25k, 0.8% for AGIs $25k-50k, 1.7% for AGIs $50k-75k, 2.8% for AGIs $75k-100k, 2.8% for AGIs $100k-200k)
Earned income credit: $2,381 (reported on 24.5% of returns)
Here:
$2,381
State:
$2,646
(% of AGI for various income ranges: 8.2% for AGIs below $25k, 1.3% for AGIs $25k-50k)
Percentage of individuals using paid preparers for their 2012 taxes: 68.9%
Here:
69%
State:
60%
(% for various income ranges: 65.9% for AGIs below $25k, 66.7% for AGIs $25k-50k, 76.5% for AGIs $50k-75k, 75.0% for AGIs $75k-100k, 71.4% for AGIs $100k-200k)
Averages for the 2004 tax year for zip code 36279, filed in 2005:
Average Adjusted Gross Income (AGI) in 2004: $33,613 (Individual Income Tax Returns)
Here:
$33,613
State:
$42,302
Salary/wage: $33,648 (reported on 84.5% of returns)
Here:
$33,648
State:
$36,626
(% of AGI for various income ranges: 95.7% for AGIs below $10k, 71.4% for AGIs $10k-25k, 84.8% for AGIs $25k-50k, 86.4% for AGIs $50k-75k, 89.3% for AGIs $75k-100k, 87.5% for AGIs over 100k)
Taxable interest for individuals: $780 (reported on 39.0% of returns)
This zip code:
$780
Alabama:
$1,827
(% of AGI for various income ranges: 3.3% for AGIs below $10k, 1.5% for AGIs $10k-25k, 1.0% for AGIs $25k-50k, 0.7% for AGIs $50k-75k, 0.4% for AGIs $75k-100k, 0.7% for AGIs over 100k)
Taxable dividends: $667 (reported on 9.5% of returns)
Here:
$667
State:
$4,206
(% of AGI for various income ranges: 0.5% for AGIs below $10k, 0.3% for AGIs $10k-25k, 0.1% for AGIs $25k-50k, 0.1% for AGIs $50k-75k, 0.4% for AGIs $75k-100k)
Net capital gain/loss: +$868 (reported on 6.9% of returns)
Here:
+$868
State:
+$13,031
(% of AGI for various income ranges: 0.1% for AGIs $10k-25k, 0.4% for AGIs $25k-50k, 0.3% for AGIs $50k-75k, -0.2% for AGIs $75k-100k)
Profit/loss from business: +$4,084 (reported on 16.1% of returns)
Here:
+$4,084
State:
+$8,302
(% of AGI for various income ranges: 9.1% for AGIs below $10k, 5.3% for AGIs $10k-25k, 1.8% for AGIs $25k-50k, 1.5% for AGIs $50k-75k)
IRA payment deduction: $2,640 (reported on 2.3% of returns)
36279:
$2,640
Alabama:
$3,006
Total itemized deductions: $14,074 (24% of AGI, reported on 23.2% of returns)
Here:
$14,074
State:
$17,623
Here:
24.2% of AGI
State:
20.8% of AGI
(% of AGI for various income ranges: 7.7% for AGIs $10k-25k, 7.9% for AGIs $25k-50k, 10.4% for AGIs $50k-75k, 13.2% for AGIs $75k-100k, 12.4% for AGIs over 100k)
Charity contributions deductions: $3,632 (6% of AGI, reported on 20.2% of returns)
Here:
$3,632
State:
$4,768
Here:
6.0% of AGI
State:
5.4% of AGI
(% of AGI for various income ranges: 1.3% for AGIs $10k-25k, 1.1% for AGIs $25k-50k, 2.3% for AGIs $50k-75k, 4.1% for AGIs $75k-100k, 3.4% for AGIs over 100k)
Total tax: $3,489 (reported on 72.4% of returns)
36279:
$3,489
State:
$6,905
(% of AGI for various income ranges: 4.0% for AGIs below $10k, 3.5% for AGIs $10k-25k, 5.6% for AGIs $25k-50k, 8.4% for AGIs $50k-75k, 10.0% for AGIs $75k-100k, 13.8% for AGIs over 100k)
Earned income credit: $1,758 (reported on 22.8% of returns)
Here:
$1,758
State:
$2,048
Percentage of individuals using paid preparers for their 2004 taxes: 75.1%
Here:
75%
State:
65%
(% for various income ranges: 67.3% for AGIs below $10k, 77.4% for AGIs $10k-25k, 77.3% for AGIs $25k-50k, 79.8% for AGIs $50k-75k, 68.4% for AGIs $75k-100k, 79.2% for AGIs over 100k)
Household received Food Stamps/SNAP in the past 12 months: 77 Household did not receive Food Stamps/SNAP in the past 12 months: 939
Women who had a birth in the past 12 months: 10 (0 now married, 8 unmarried) Women who did not have a birth in the past 12 months: 565 (296 now married, 268 unmarried)
Housing units in zip code 36279 with a mortgage: 398 Houses without a mortgage: 17
Median monthly owner costs for units with a mortgage: $1,286 Median monthly owner costs for units without a mortgage: $350
Residents with income below the poverty level in 2022:
This zip code:
8.5%
Whole state:
16.2%
Residents with income below 50% of the poverty level in 2022:
This zip code:
3.0%
Whole state:
8.6%
Median number of rooms in houses and condos:
Here:
6.8
State:
6.5
Median number of rooms in apartments:
Here:
5.1
State:
4.7
Notable locations in this zip code not listed on our city pages
Churches in zip code 36279 include: Mount View Missionary Baptist Church (A), Mountain View Church (B), Wellington Church (C), Wellington Baptist Church (D), Fairview Missionary Baptist Church (E), Shiloh Primitive Baptist Church (F), Hopewell Church (G), Duke Missionary Baptist Church (H), Union Methodist Church (I). Display/hide their locations on the map
Lakes and reservoirs: Boozers Lake (A), Coleys Lake (B), Coley Lake (C), Patterson Lake (D), Bonners Lake (E), Church Lake (F), Kellys Lake (G), Crystal Springs Lake (H). Display/hide their locations on the map
Size of family households: 376 2-persons, 179 3-persons, 135 4-persons, 69 5-persons, 40 6-persons
Size of nonfamily households: 215 1-person
582 married couples with children.
228 single-parent households (83 men, 145 women).
98.7% of residents of 36279 zip code speak English at home.
0.7% of residents speak Spanish at home (100% very well).
0.3% of residents speak Asian or Pacific Island language at home (100% not well).
Foreign born population: 30 (1.0%) (0.0% of them are naturalized citizens)
:
1.0%
Whole state:
3.8%
61%Honduras
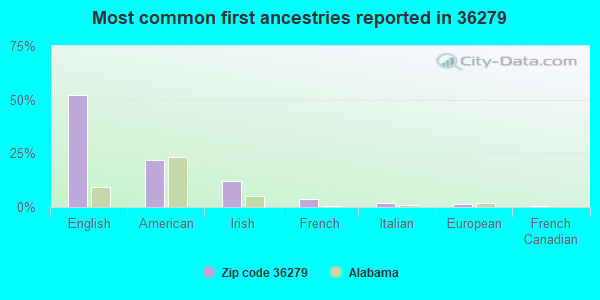
52%English
22%American
12%Irish
4%French
2%Italian
1%European
1%French Canadian
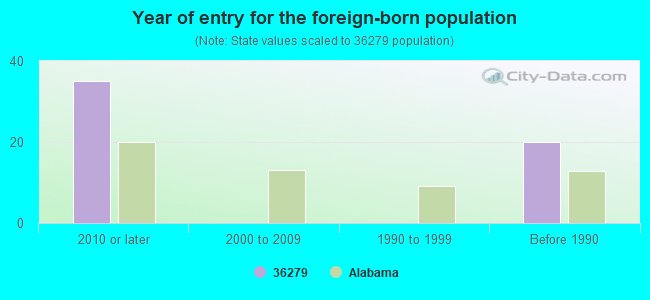
Year of entry for the foreign-born population
352010 or later
02000 to 2009
01990 to 1999
20Before 1990
Facilities with environmental interests located in this zip code:
CALHOUN COUNTY WTP (CALHOUN COUNTY WATER AUTHORITY in WELLINGTON, AL)
National Pollutant Discharge Elimination System NON-MAJOR (Tracking pollutant discharge elimination systems) - permit Business SIC classification: WATER SUPPLY Alternative names: CALHOUN COUNTY WATER TRMT PLT
NATIONAL PETROLEUM EQUIPMENT INC (37 SAXONS LAKESIDE DRIVE in WELLINGTON, AL)
BONDS ROAD BRIDGE (CALHOUN COUNTY COMMISSION in WELLINGTON, AL)
National Pollutant Discharge Elimination System NON-MAJOR (Tracking pollutant discharge elimination systems) - permit Business SIC classification: BRIDGE, TUNNEL, AND ELEVATED HIGHWAY CONSTRUCTION Alternative names: CALHOUN COMM BONDS ROAD BRIDGE
Housing units lacking complete plumbing facilities: 0.8% Housing units lacking complete kitchen facilities: 0.4%
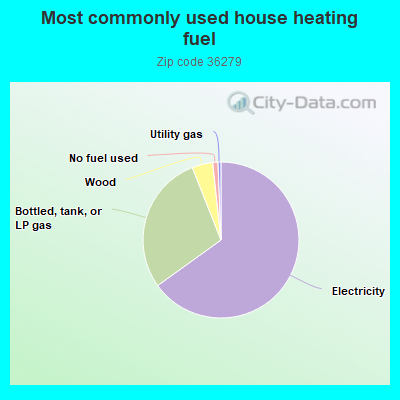
65.2%Electricity
29.0%Bottled, tank, or LP gas
4.3%Wood
1.1%No fuel used
0.6%Utility gas
Population in 1990: 2,137. Population change in the 1990s: +386 (+18.1%).
Place of birth for U.S.-born residents:
This state: 2,300
Northeast: 55
Midwest: 108
South: 370
West: 54
70% of the 36279 zip code residents lived in the same house 5 years ago. Out of people who lived in different houses, 57% lived in this county. Out of people who lived in different counties, 50% lived in Alabama.
91% of the 36279 zip code residents lived in the same house 1 year ago. Out of people who lived in different houses, 27% moved from this county. Out of people who lived in different houses, 64% moved from different county within same state. Out of people who lived in different houses, 4% moved from different state. Out of people who lived in different houses, 6% moved from abroad.
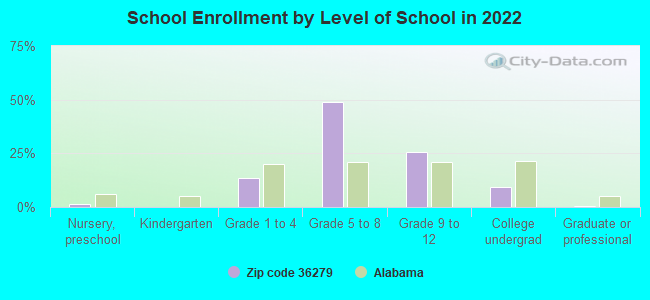
Private vs. public school enrollment:
Students in private schools in grades 1 to 8 (elementary and middle school):
Here:
0.0%
Alabama:
14.7%
Students in private schools in grades 9 to 12 (high school): 29
Here:
15.7%
Alabama:
16.3%
Students in private undergraduate colleges:
Here:
0.0%
Alabama:
14.6%
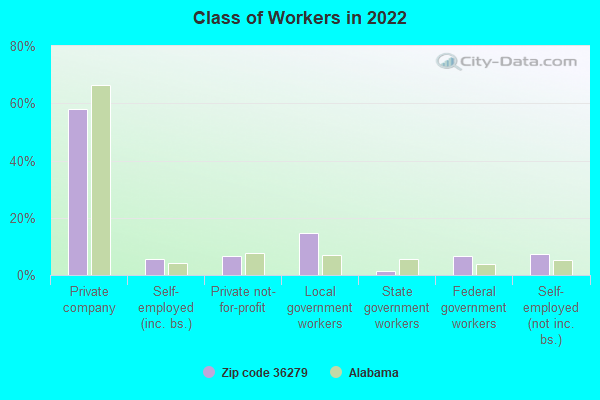
Occupation by median earnings in the past 12 months ($)
117,133Health diagnosing and treating practitioners and other technical occupations
73,624Sales and related occupations
69,016Installation, maintenance, and repair occupations
51,159Computer and mathematical occupations
45,078Office and administrative support occupations
42,591Management occupations
Top industries in this zip code by the number of employees in 2005:
Health Care and Social Assistance: Outpatient Mental Health and Substance Abuse Centers (20-49 employees: 1 establishment, 10-19 employees: 1 establishment)
Construction: New Single-Family Housing Construction (except Operative Builders) (10-19: 1, 5-9: 1, 1-4: 1)
Other Services (except Public Administration): Religious Organizations (5-9: 1, 1-4: 1)
Administrative and Support and Waste Management and Remediation Services: Janitorial Services (5-9: 1)
Construction: Residential Remodelers (1-4: 1)
Information: Book Publishers (1-4: 1)
Construction: Other Building Equipment Contractors (1-4: 1)
Fatal accident statistics in 2013:
Fatal accident count: 1
Vehicles involved in fatal accidents: 3
Fatal accidents caused by drunken drivers: 1
Fatalities: 1
Persons involved in fatal accidents: 3
Pedestrians involved in fatal accidents: 0
Fatal accident statistics in 2012:
Fatal accident count: 1
Vehicles involved in fatal accidents: 3
Fatal accidents caused by drunken drivers: 0
Fatalities: 1
Persons involved in fatal accidents: 4
Pedestrians involved in fatal accidents: 0
Home Mortgage Disclosure Act Aggregated Statistics For Year 2009 (Based on 2 partial tracts)
A) FHA, FSA/RHS & VA Home Purchase Loans
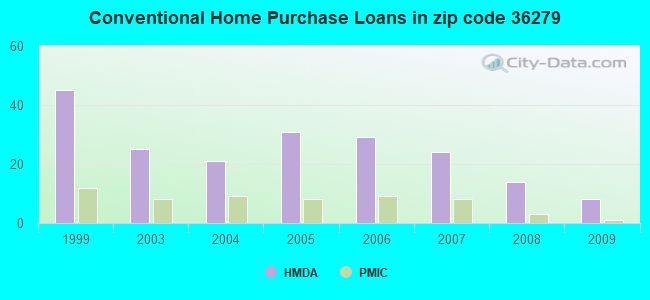
B) Conventional Home Purchase Loans
C) Refinancings
D) Home Improvement Loans
F) Non-occupant Loans on < 5 Family Dwellings (A B C & D)
G) Loans On Manufactured Home Dwelling (A B C & D)
Number
Average Value
Number
Average Value
Number
Average Value
Number
Average Value
Number
Average Value
Number
Average Value
LOANS ORIGINATED
6
$126,508
8
$125,728
49
$126,495
5
$55,364
3
$55,380
4
$45,325
APPLICATIONS APPROVED, NOT ACCEPTED
0
$0
1
$97,210
4
$135,525
0
$0
0
$0
1
$13,870
APPLICATIONS DENIED
2
$144,210
5
$38,164
20
$117,431
5
$30,486
2
$52,410
6
$53,658
APPLICATIONS WITHDRAWN
1
$118,300
1
$152,290
13
$125,901
0
$0
0
$0
0
$0
FILES CLOSED FOR INCOMPLETENESS
0
$0
0
$0
4
$132,810
0
$0
0
$0
1
$25,560
Aggregated Statistics For Year 2008 (Based on 2 partial tracts)
A) FHA, FSA/RHS & VA Home Purchase Loans
B) Conventional Home Purchase Loans
C) Refinancings
D) Home Improvement Loans
F) Non-occupant Loans on < 5 Family Dwellings (A B C & D)
G) Loans On Manufactured Home Dwelling (A B C & D)
Number
Average Value
Number
Average Value
Number
Average Value
Number
Average Value
Number
Average Value
Number
Average Value
LOANS ORIGINATED
6
$148,850
14
$94,616
41
$123,555
6
$53,873
4
$69,975
7
$51,946
APPLICATIONS APPROVED, NOT ACCEPTED
0
$0
3
$124,950
6
$124,900
1
$53,800
1
$16,080
3
$63,713
APPLICATIONS DENIED
1
$105,330
4
$125,418
22
$119,028
7
$60,127
0
$0
5
$49,614
APPLICATIONS WITHDRAWN
1
$60,280
2
$115,335
7
$122,686
1
$86,130
0
$0
0
$0
FILES CLOSED FOR INCOMPLETENESS
1
$103,060
1
$87,450
3
$106,397
1
$47,090
0
$0
1
$34,410
Aggregated Statistics For Year 2007 (Based on 2 partial tracts)
A) FHA, FSA/RHS & VA Home Purchase Loans
B) Conventional Home Purchase Loans
C) Refinancings
D) Home Improvement Loans
F) Non-occupant Loans on < 5 Family Dwellings (A B C & D)
G) Loans On Manufactured Home Dwelling (A B C & D)
Number
Average Value
Number
Average Value
Number
Average Value
Number
Average Value
Number
Average Value
Number
Average Value
LOANS ORIGINATED
4
$113,422
24
$105,105
32
$111,415
7
$47,940
4
$97,410
10
$47,393
APPLICATIONS APPROVED, NOT ACCEPTED
0
$0
4
$113,222
5
$108,118
0
$0
1
$47,880
3
$73,523
APPLICATIONS DENIED
1
$124,270
10
$92,992
24
$101,672
8
$45,920
2
$63,040
8
$63,394
APPLICATIONS WITHDRAWN
0
$0
2
$117,240
10
$128,833
1
$27,160
0
$0
1
$52,860
FILES CLOSED FOR INCOMPLETENESS
0
$0
1
$121,190
4
$161,550
0
$0
1
$33,310
0
$0
Aggregated Statistics For Year 2006 (Based on 2 partial tracts)
A) FHA, FSA/RHS & VA Home Purchase Loans
B) Conventional Home Purchase Loans
C) Refinancings
D) Home Improvement Loans
F) Non-occupant Loans on < 5 Family Dwellings (A B C & D)
G) Loans On Manufactured Home Dwelling (A B C & D)
Number
Average Value
Number
Average Value
Number
Average Value
Number
Average Value
Number
Average Value
Number
Average Value
LOANS ORIGINATED
3
$126,567
29
$97,918
39
$103,235
9
$42,071
3
$74,117
12
$46,648
APPLICATIONS APPROVED, NOT ACCEPTED
0
$0
8
$70,395
12
$85,538
2
$14,440
0
$0
7
$56,217
APPLICATIONS DENIED
1
$80,750
13
$77,666
25
$105,551
6
$50,440
2
$44,150
11
$57,582
APPLICATIONS WITHDRAWN
1
$87,610
3
$86,603
16
$103,989
1
$83,950
1
$62,680
1
$113,950
FILES CLOSED FOR INCOMPLETENESS
0
$0
2
$86,020
6
$130,333
0
$0
0
$0
1
$34,010
Aggregated Statistics For Year 2005 (Based on 2 partial tracts)
A) FHA, FSA/RHS & VA Home Purchase Loans
B) Conventional Home Purchase Loans
C) Refinancings
D) Home Improvement Loans
F) Non-occupant Loans on < 5 Family Dwellings (A B C & D)
G) Loans On Manufactured Home Dwelling (A B C & D)
Number
Average Value
Number
Average Value
Number
Average Value
Number
Average Value
Number
Average Value
Number
Average Value
LOANS ORIGINATED
3
$111,673
31
$102,629
41
$91,685
7
$41,789
5
$51,322
10
$56,738
APPLICATIONS APPROVED, NOT ACCEPTED
0
$0
7
$81,169
8
$88,529
0
$0
1
$92,360
5
$55,060
APPLICATIONS DENIED
1
$106,880
17
$76,875
28
$91,321
10
$37,044
1
$116,360
15
$52,013
APPLICATIONS WITHDRAWN
0
$0
3
$123,423
18
$104,984
2
$128,990
0
$0
2
$52,530
FILES CLOSED FOR INCOMPLETENESS
0
$0
1
$45,790
5
$114,664
1
$12,830
0
$0
0
$0
Aggregated Statistics For Year 2004 (Based on 2 partial tracts)
A) FHA, FSA/RHS & VA Home Purchase Loans
B) Conventional Home Purchase Loans
C) Refinancings
D) Home Improvement Loans
F) Non-occupant Loans on < 5 Family Dwellings (A B C & D)
G) Loans On Manufactured Home Dwelling (A B C & D)
Number
Average Value
Number
Average Value
Number
Average Value
Number
Average Value
Number
Average Value
Number
Average Value
LOANS ORIGINATED
4
$103,868
21
$97,571
42
$88,928
6
$27,627
2
$88,515
8
$56,560
APPLICATIONS APPROVED, NOT ACCEPTED
1
$53,900
5
$61,658
14
$72,575
1
$61,880
0
$0
4
$60,805
APPLICATIONS DENIED
0
$0
11
$66,011
29
$79,865
7
$25,891
2
$63,795
13
$55,704
APPLICATIONS WITHDRAWN
0
$0
2
$133,670
11
$97,538
1
$105,400
1
$46,070
1
$103,520
FILES CLOSED FOR INCOMPLETENESS
0
$0
2
$92,670
19
$91,395
1
$11,570
0
$0
2
$56,150
Aggregated Statistics For Year 2003 (Based on 2 partial tracts)
A) FHA, FSA/RHS & VA Home Purchase Loans
B) Conventional Home Purchase Loans
C) Refinancings
D) Home Improvement Loans
F) Non-occupant Loans on < 5 Family Dwellings (A B C & D)
Number
Average Value
Number
Average Value
Number
Average Value
Number
Average Value
Number
Average Value
LOANS ORIGINATED
5
$116,924
25
$76,060
62
$94,104
5
$24,136
3
$72,597
APPLICATIONS APPROVED, NOT ACCEPTED
0
$0
5
$40,968
12
$83,898
0
$0
1
$29,210
APPLICATIONS DENIED
1
$74,970
10
$53,638
36
$80,668
5
$25,430
1
$8,380
APPLICATIONS WITHDRAWN
0
$0
2
$59,670
18
$84,896
1
$25,770
0
$0
FILES CLOSED FOR INCOMPLETENESS
0
$0
1
$76,120
6
$74,475
0
$0
0
$0
Aggregated Statistics For Year 1999 (Based on 1 partial tract)
A) FHA, FSA/RHS & VA Home Purchase Loans
B) Conventional Home Purchase Loans
C) Refinancings
D) Home Improvement Loans
F) Non-occupant Loans on < 5 Family Dwellings (A B C & D)


 Nearest zip codes: 35905, 36265, 36250, 35907, 36277, 35903.