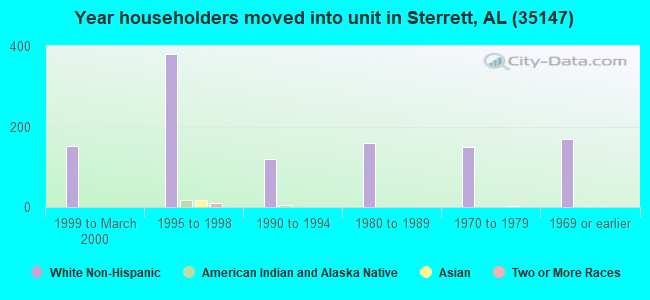
Estimated zip code population in 2022: 6,524 Zip code population in 2010: 5,468 Zip code population in 2000: 3,146
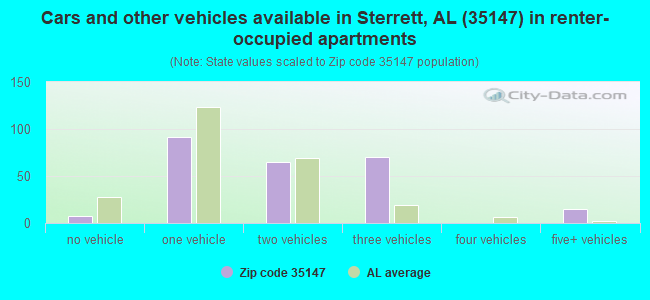
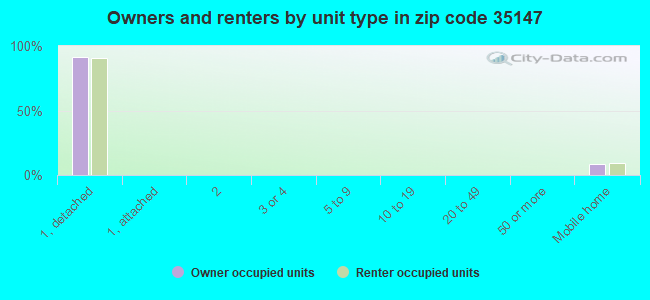
Houses and condos: 2,421 Renter-occupied apartments: 245
% of renters here:
10%
State:
30%
March 2022 cost of living index in zip code 35147: 89.8 (less than average, U.S. average is 100)
Land area: 68.0 sq. mi. Water area: 1.2 sq. mi.
Population density: 96 people per square mile
(very low).
OSM Map
General Map
Google Map
MSN Map
OSM Map
General Map
Google Map
MSN Map
OSM Map
General Map
Google Map
MSN Map
OSM Map
General Map
Google Map
MSN Map
Please wait while loading the map...
Real estate property taxes paid for housing units in 2022:
This zip code:
0.4% ($1,147)
Alabama:
0.4% ($718)
Median real estate property taxes paid for housing units with mortgages in 2022: $1,212 (0.4%) Median real estate property taxes paid for housing units with no mortgage in 2022: $966 (0.3%)
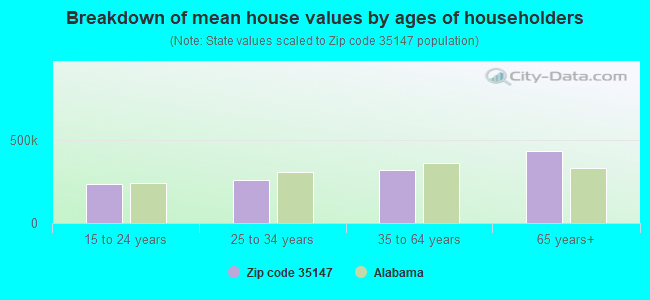
Estimated median house/condo value in 2022: $310,421
35147:
$310,421
Alabama:
$200,900
According to our research of Alabama and other state lists, there were 11 registered sex offenders living in 35147 zip code as of May 31, 2024. The ratio of all residents to sex offenders in zip code 35147 is 535 to 1. The ratio of registered sex offenders to all residents in this zip code is lower than the state average.
Median resident age:
This zip code:
37.9 years
Alabama median age:
39.6 years
Average household size:
This zip code:
2.8 people
Alabama:
2.5 people
Averages for the 2020 tax year for zip code 35147, filed in 2021:
Average Adjusted Gross Income (AGI) in 2020: $75,832 (Individual Income Tax Returns)
Here:
$75,832
State:
$63,984
Salary/wage: $65,127 (reported on 84.3% of returns)
Here:
$65,127
State:
$52,834
(% of AGI for various income ranges: 1261.3% for AGIs below $25k, 3871.1% for AGIs $25k-50k, 6721.3% for AGIs $50k-75k, 9925.8% for AGIs $75k-100k, 19035.9% for AGIs $100k-200k, 74380.0% for AGIs over 200k)
Taxable interest for individuals: $1,214 (reported on 30.2% of returns)
This zip code:
$1,214
Alabama:
$1,615
(% of AGI for various income ranges: 13.0% for AGIs below $25k, 12.2% for AGIs $25k-50k, 22.3% for AGIs $50k-75k, 22.6% for AGIs $75k-100k, 75.2% for AGIs $100k-200k, 1560.0% for AGIs over 200k)
Ordinary dividends: $8,674 (reported on 16.1% of returns)
Here:
$8,674
State:
$7,660
(% of AGI for various income ranges: 38.3% for AGIs below $25k, 19.7% for AGIs $25k-50k, 55.3% for AGIs $50k-75k, 47.9% for AGIs $75k-100k, 174.4% for AGIs $100k-200k, 8020.0% for AGIs over 200k)
Net capital gain/loss in AGI: +$15,741 (reported on 15.3% of returns)
Here:
+$15,741
State:
+$23,528
(% of AGI for various income ranges: 19.3% for AGIs below $25k, 34.3% for AGIs $25k-50k, 68.3% for AGIs $50k-75k, 66.8% for AGIs $75k-100k, 330.0% for AGIs $100k-200k, 14616.7% for AGIs over 200k)
Profit/loss from business: +$12,543 (reported on 21.1% of returns)
Here:
+$12,543
State:
+$9,534
(% of AGI for various income ranges: 200.7% for AGIs below $25k, 350.5% for AGIs $25k-50k, 275.7% for AGIs $50k-75k, 467.4% for AGIs $75k-100k, 490.7% for AGIs $100k-200k, 3790.0% for AGIs over 200k)
Taxable individual retirement arrangement distribution: $22,672 (reported on 7.4% of returns)
35147:
$22,672
Alabama:
$19,004
(% of AGI for various income ranges: 77.8% for AGIs below $25k, 65.4% for AGIs $25k-50k, 288.7% for AGIs $50k-75k, 968.5% for AGIs $100k-200k)
Total itemized deductions: $33,370 (reported on 9.5% of returns)
Here:
$33,370
State:
$37,338
(% of AGI for various income ranges: 164.6% for AGIs $25k-50k, 235.3% for AGIs $50k-75k, 291.1% for AGIs $75k-100k, 981.5% for AGIs $100k-200k, 10523.3% for AGIs over 200k)
Charity contributions: $16,800 (reported on 8.3% of returns)
Here:
$16,800
State:
$18,005
(% of AGI for various income ranges: 20.2% for AGIs below $25k, 63.0% for AGIs $50k-75k, 72.6% for AGIs $75k-100k, 348.1% for AGIs $100k-200k, 6666.7% for AGIs over 200k)
Taxes paid: $6,448 (reported on 9.5% of returns)
35147:
$6,448
State:
$6,484
(% of AGI for various income ranges: 19.2% for AGIs $25k-50k, 54.0% for AGIs $50k-75k, 69.5% for AGIs $75k-100k, 219.3% for AGIs $100k-200k, 1753.3% for AGIs over 200k)
Earned income credit: $2,274 (reported on 12.8% of returns)
Here:
$2,274
State:
$2,628
(% of AGI for various income ranges: 94.8% for AGIs below $25k, 72.7% for AGIs $25k-50k)
Percentage of individuals using paid preparers for their 2020 taxes: 91.7%
Here:
92%
State:
93%
(% for various income ranges: 88.2% for AGIs below $25k, 90.0% for AGIs $25k-50k, 92.5% for AGIs $50k-75k, 96.2% for AGIs $75k-100k, 93.6% for AGIs $100k-200k, 100.0% for AGIs over 200k)
Averages for the 2012 tax year for zip code 35147, filed in 2013:
Average Adjusted Gross Income (AGI) in 2012: $67,888 (Individual Income Tax Returns)
Here:
$67,888
State:
$52,001
Salary/wage: $60,724 (reported on 88.1% of returns)
Here:
$60,724
State:
$43,822
(% of AGI for various income ranges: 75.4% for AGIs below $25k, 83.0% for AGIs $25k-50k, 82.4% for AGIs $50k-75k, 86.5% for AGIs $75k-100k, 84.0% for AGIs $100k-200k, 55.1% for AGIs over 200k)
Taxable interest for individuals: $907 (reported on 32.9% of returns)
This zip code:
$907
Alabama:
$1,592
(% of AGI for various income ranges: 0.4% for AGIs below $25k, 0.3% for AGIs $25k-50k, 0.3% for AGIs $50k-75k, 0.2% for AGIs $75k-100k, 0.4% for AGIs $100k-200k, 0.9% for AGIs over 200k)
Ordinary dividends: $3,047 (reported on 17.4% of returns)
Here:
$3,047
State:
$5,697
(% of AGI for various income ranges: 1.1% for AGIs below $25k, 0.3% for AGIs $25k-50k, 0.4% for AGIs $50k-75k, 0.8% for AGIs $75k-100k, 1.0% for AGIs $100k-200k, 0.8% for AGIs over 200k)
Net capital gain/loss in AGI: +$2,741 (reported on 12.3% of returns)
Here:
+$2,741
State:
+$13,286
(% of AGI for various income ranges: 0.3% for AGIs $100k-200k, 2.4% for AGIs over 200k)
Profit/loss from business: +$9,702 (reported on 20.1% of returns)
Here:
+$9,702
State:
+$9,151
(% of AGI for various income ranges: 12.5% for AGIs below $25k, 5.2% for AGIs $25k-50k, 4.7% for AGIs $50k-75k, 1.6% for AGIs $75k-100k, 1.8% for AGIs $100k-200k)
Taxable individual retirement arrangement distribution: $14,722 (reported on 8.2% of returns)
35147:
$14,722
Alabama:
$14,992
(% of AGI for various income ranges: 3.4% for AGIs below $25k, 1.0% for AGIs $25k-50k, 2.5% for AGIs $50k-75k, 2.5% for AGIs $75k-100k, 2.0% for AGIs $100k-200k)
Total itemized deductions: $20,599 (20% of AGI, reported on 49.3% of returns)
Here:
$20,599
State:
$21,388
Here:
20.4% of AGI
State:
20.1% of AGI
(% of AGI for various income ranges: 11.7% for AGIs below $25k, 14.9% for AGIs $25k-50k, 16.3% for AGIs $50k-75k, 15.1% for AGIs $75k-100k, 15.8% for AGIs $100k-200k, 13.0% for AGIs over 200k)
Charity contributions: $4,367 (reported on 42.5% of returns)
Here:
$4,367
State:
$5,925
(% of AGI for various income ranges: 1.0% for AGIs below $25k, 2.1% for AGIs $25k-50k, 2.4% for AGIs $50k-75k, 2.5% for AGIs $75k-100k, 3.4% for AGIs $100k-200k, 2.9% for AGIs over 200k)
Taxes paid: $5,352 (reported on 48.9% of returns)
35147:
$5,352
State:
$5,272
(% of AGI for various income ranges: 1.5% for AGIs below $25k, 2.4% for AGIs $25k-50k, 3.5% for AGIs $50k-75k, 3.7% for AGIs $75k-100k, 4.7% for AGIs $100k-200k, 4.5% for AGIs over 200k)
Earned income credit: $2,418 (reported on 15.1% of returns)
Here:
$2,418
State:
$2,646
(% of AGI for various income ranges: 7.9% for AGIs below $25k, 1.1% for AGIs $25k-50k)
Percentage of individuals using paid preparers for their 2012 taxes: 52.1%
Here:
52%
State:
60%
(% for various income ranges: 49.2% for AGIs below $25k, 59.2% for AGIs $25k-50k, 50.0% for AGIs $50k-75k, 48.3% for AGIs $75k-100k, 50.0% for AGIs $100k-200k, 66.7% for AGIs over 200k)
Averages for the 2004 tax year for zip code 35147, filed in 2005:
Average Adjusted Gross Income (AGI) in 2004: $57,226 (Individual Income Tax Returns)
Here:
$57,226
State:
$42,302
Salary/wage: $51,585 (reported on 88.1% of returns)
Here:
$51,585
State:
$36,626
(% of AGI for various income ranges: 103.2% for AGIs below $10k, 77.5% for AGIs $10k-25k, 85.6% for AGIs $25k-50k, 83.1% for AGIs $50k-75k, 87.1% for AGIs $75k-100k, 71.6% for AGIs over 100k)
Taxable interest for individuals: $1,329 (reported on 42.6% of returns)
This zip code:
$1,329
Alabama:
$1,827
(% of AGI for various income ranges: 2.1% for AGIs below $10k, 2.0% for AGIs $10k-25k, 0.8% for AGIs $25k-50k, 1.0% for AGIs $50k-75k, 0.9% for AGIs $75k-100k, 0.9% for AGIs over 100k)
Taxable dividends: $2,396 (reported on 21.0% of returns)
Here:
$2,396
State:
$4,206
(% of AGI for various income ranges: 2.6% for AGIs below $10k, 0.2% for AGIs $10k-25k, 0.7% for AGIs $25k-50k, 1.1% for AGIs $50k-75k, 0.4% for AGIs $75k-100k, 1.1% for AGIs over 100k)
Net capital gain/loss: +$4,657 (reported on 16.8% of returns)
Here:
+$4,657
State:
+$13,031
(% of AGI for various income ranges: -0.2% for AGIs below $10k, -0.4% for AGIs $10k-25k, -0.2% for AGIs $25k-50k, 0.1% for AGIs $50k-75k, 1.0% for AGIs $75k-100k, 3.0% for AGIs over 100k)
Profit/loss from business: +$10,331 (reported on 18.1% of returns)
Here:
+$10,331
State:
+$8,302
(% of AGI for various income ranges: 10.8% for AGIs below $10k, 10.8% for AGIs $10k-25k, 4.4% for AGIs $25k-50k, 3.6% for AGIs $50k-75k, 0.4% for AGIs $75k-100k, 2.7% for AGIs over 100k)
IRA payment deduction: $3,216 (reported on 2.1% of returns)
35147:
$3,216
Alabama:
$3,006
Total itemized deductions: $17,615 (21% of AGI, reported on 48.4% of returns)
Here:
$17,615
State:
$17,623
Here:
21.5% of AGI
State:
20.8% of AGI
(% of AGI for various income ranges: 11.3% for AGIs below $10k, 10.6% for AGIs $10k-25k, 14.3% for AGIs $25k-50k, 16.4% for AGIs $50k-75k, 18.6% for AGIs $75k-100k, 13.6% for AGIs over 100k)
Charity contributions deductions: $3,373 (4% of AGI, reported on 43.4% of returns)
Here:
$3,373
State:
$4,768
Here:
4.0% of AGI
State:
5.4% of AGI
(% of AGI for various income ranges: 2.0% for AGIs $10k-25k, 1.9% for AGIs $25k-50k, 2.9% for AGIs $50k-75k, 3.1% for AGIs $75k-100k, 2.6% for AGIs over 100k)
Total tax: $7,740 (reported on 84.6% of returns)
35147:
$7,740
State:
$6,905
(% of AGI for various income ranges: 3.9% for AGIs below $10k, 5.0% for AGIs $10k-25k, 7.5% for AGIs $25k-50k, 9.1% for AGIs $50k-75k, 9.7% for AGIs $75k-100k, 15.8% for AGIs over 100k)
Earned income credit: $1,719 (reported on 10.9% of returns)
Here:
$1,719
State:
$2,048
Percentage of individuals using paid preparers for their 2004 taxes: 58.1%
Here:
58%
State:
65%
(% for various income ranges: 54.3% for AGIs below $10k, 61.9% for AGIs $10k-25k, 60.9% for AGIs $25k-50k, 54.1% for AGIs $50k-75k, 56.6% for AGIs $75k-100k, 57.9% for AGIs over 100k)
Likely homosexual households (counted as self-reported same-sex unmarried-partner households)
Lesbian couples: 0.1% of all households
Gay men: 0.5% of all households
Household received Food Stamps/SNAP in the past 12 months: 44 Household did not receive Food Stamps/SNAP in the past 12 months: 2,309
Women who had a birth in the past 12 months: 130 (148 now married, 0 unmarried) Women who did not have a birth in the past 12 months: 1,369 (639 now married, 729 unmarried)
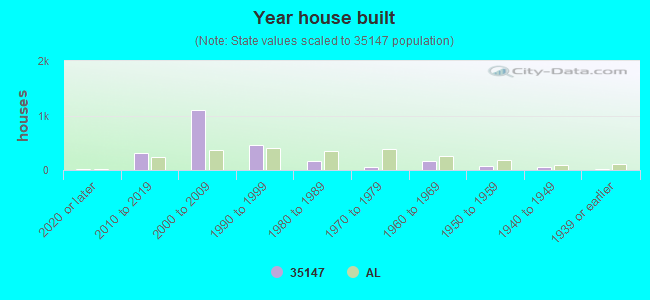
Housing units in zip code 35147 with a mortgage: 1,463 (71 second mortgage, 9 home equity loan, 48 both second mortgage and home equity loan) Houses without a mortgage: 52
Median monthly owner costs for units with a mortgage: $1,442 Median monthly owner costs for units without a mortgage: $427
Residents with income below the poverty level in 2022:
This zip code:
7.0%
Whole state:
16.2%
Residents with income below 50% of the poverty level in 2022:
This zip code:
2.6%
Whole state:
8.6%
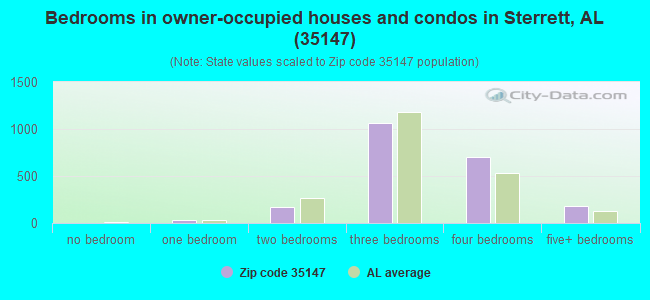
Median number of rooms in houses and condos:
Here:
6.7
State:
6.5
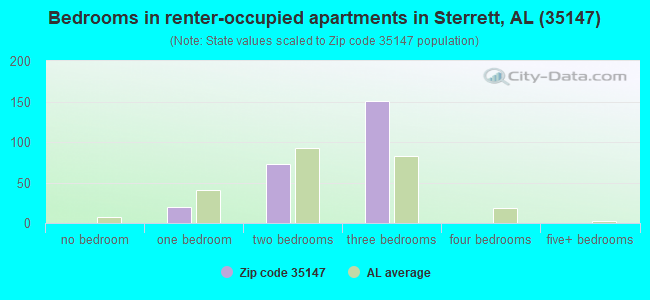
Median number of rooms in apartments:
Here:
5.2
State:
4.7
Notable locations in this zip code not listed on our city pages
Notable locations in zip code 35147: Cahaba River Youth Camp (A), Days Crossroads (B), Cahaba Valley Country Club (C), Westover Junction (D), Lowery (E), Westover Volunteer Fire Department (F), Vandiver Volunteer Fire and Rescue Department Station 2 (G), Westover Fire and Rescue Department (H). Display/hide their locations on the map
Churches in zip code 35147 include: Mount Signal Church (A), Mount Tabor Church (B), Mount Zion Church (C), Pleasant Site Church (D), Brashers Chapel Church (E), Faulkner Church (F), Church of God of Prophecy (G), Westover Church (H), Beulah Church (I). Display/hide their locations on the map
Cemeteries: Beulah Cemetery (1), Vandiver Negro Cemetery (2), Brasher Cemetery (3), Lawleys Chapel Cemetery (4), Overton Cemetery (5), Pleasant Grove Cemetery (6), Old Sterrett Cemetery (7). Display/hide their locations on the map
Reservoirs: Shelton Lake (A), Lake Dewitt (B), Hall Lake (C), Yielding Lake (D), Twin Pine Lake (E), Lake Gorman (F). Display/hide their locations on the map
Streams, rivers, and creeks: Spradley Branch (A), Indian Creek (B), Hurricane Creek (C), Howard Branch (D), Holmes Branch (E), Gum Branch (F), Buckhorn Branch (G), Brasher Branch (H), Bob Hood Branch (I). Display/hide their locations on the map
In group quarters: 15 (-1 institutionalized population)
Size of family households: 741 2-persons, 476 3-persons, 395 4-persons, 95 5-persons, 37 6-persons, 19 7-or-more-persons
Size of nonfamily households: 527 1-person, 68 2-persons, 12 4-persons
1,005 married couples with children.
321 single-parent households (126 men, 195 women).
94.3% of residents of 35147 zip code speak English at home.
4.0% of residents speak Spanish at home (46% very well, 30% well, 19% not well, 5% not at all).
1.5% of residents speak other Indo-European language at home (100% very well).
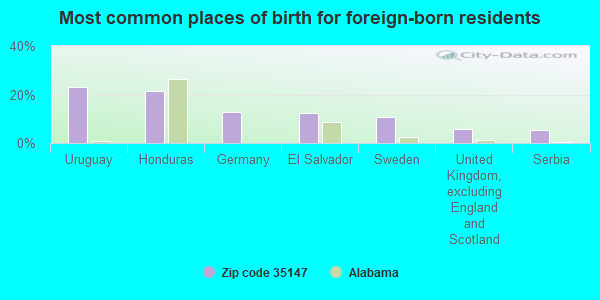
Foreign born population: 260 (4.0%) (40.0% of them are naturalized citizens)
This zip code:
4.0%
Whole state:
3.8%
23%Uruguay
22%Honduras
13%Germany
12%El Salvador
11%Sweden
6%United Kingdom, excluding England and Scotland
5%Serbia
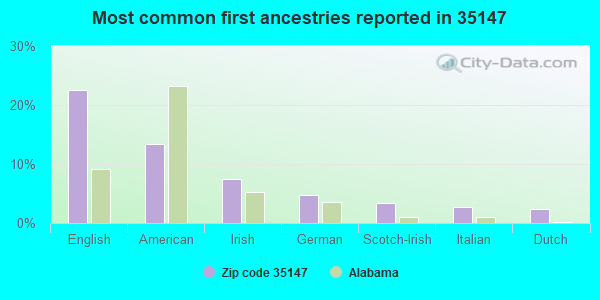
22%English
13%American
8%Irish
5%German
3%Scotch-Irish
3%Italian
2%Dutch
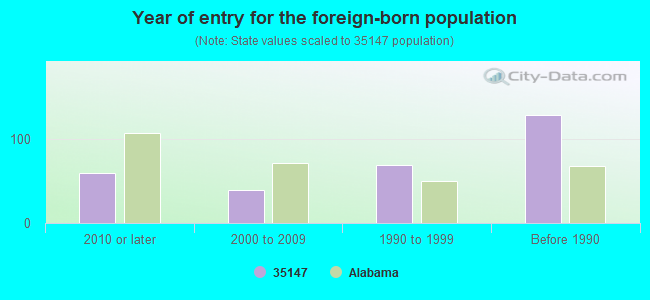
Year of entry for the foreign-born population
592010 or later
392000 to 2009
691990 to 1999
128Before 1990
Facilities with environmental interests located in this zip code:
NEW OFFICE WAREHOUSE (S INSTALLATIONS AND SVC INC in STERRETT, AL)
National Pollutant Discharge Elimination System NON-MAJOR (Tracking pollutant discharge elimination systems) - permit Business SIC classification: GENERAL CONTRACTORS-INDUSTRIAL BUILDINGS AND WAREHOUSES Alternative names: SO INSTALL SVCS NEW OFC WHSE
Housing units lacking complete plumbing facilities: 1.0% Housing units lacking complete kitchen facilities: 1.0%
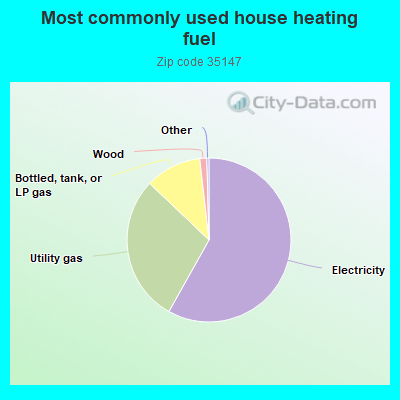
58.2%Electricity
29.0%Utility gas
11.1%Bottled, tank, or LP gas
1.4%Wood
Population in 1990: 617. Population change in the 1990s: +2,529 (+409.9%).
Place of birth for U.S.-born residents:
This state: 4,428
Northeast: 70
Midwest: 314
South: 1,342
West: 59
55% of the 35147 zip code residents lived in the same house 5 years ago. Out of people who lived in different houses, 49% lived in this county. Out of people who lived in different counties, 50% lived in Alabama.
85% of the 35147 zip code residents lived in the same house 1 year ago. Out of people who lived in different houses, 19% moved from this county. Out of people who lived in different houses, 65% moved from different county within same state. Out of people who lived in different houses, 19% moved from different state.
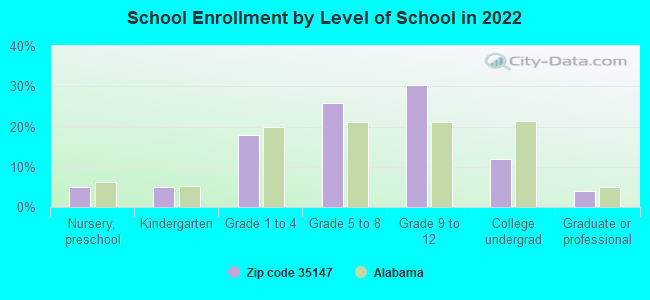
Private vs. public school enrollment:
Students in private schools in grades 1 to 8 (elementary and middle school): 205
Here:
31.7%
Alabama:
14.7%
Students in private schools in grades 9 to 12 (high school): 120
Here:
27.4%
Alabama:
16.3%
Students in private undergraduate colleges: 36
Here:
21.2%
Alabama:
14.6%
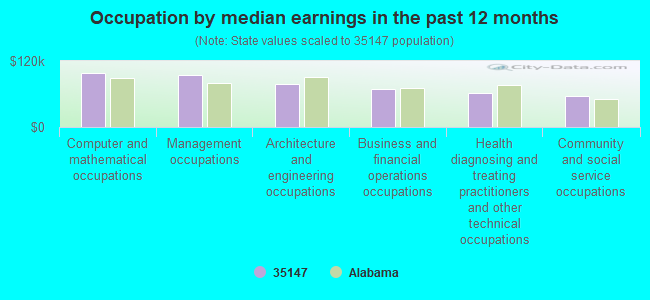
Occupation by median earnings in the past 12 months ($)
98,493Computer and mathematical occupations
94,617Management occupations
78,320Architecture and engineering occupations
68,993Business and financial operations occupations
61,289Health diagnosing and treating practitioners and other technical occupations
56,786Community and social service occupations
Top industries in this zip code by the number of employees in 2005:
Accommodation and Food Services: Hotels (except Casino Hotels) and Motels (50-99 employees: 1 establishment)
Construction: Other Building Finishing Contractors (20-49: 1)
Other Services (except Public Administration): Computer and Office Machine Repair and Maintenance (20-49: 1)
Wholesale Trade: Petroleum and Petroleum Products Merchant Wholesalers (except Bulk Stations and Terminals) (10-19: 1, 5-9: 1)
Other Services (except Public Administration): Religious Organizations (10-19: 1, 1-4: 1)
Administrative and Support and Waste Management and Remediation Services: Landscaping Services (5-9: 1, 1-4: 4)
Construction: Framing Contractors (10-19: 1)
Other Services (except Public Administration): Commercial and Industrial Machinery and Equipment (except Automotive and Electronic) Repair and Maintenance (10-19: 1)
Construction: New Single-Family Housing Construction (except Operative Builders) (1-4: 5)
People in group quarters in 2010:
10 people in group homes for juveniles (non-correctional)
People in group quarters in 2000:
8 people in other workers' dormitories
6 people in unknown juvenile institutions
Fatal accident statistics in 2014:
Fatal accident count: 2
Vehicles involved in fatal accidents: 3
Fatal accidents caused by drunken drivers: 1
Fatalities: 2
Persons involved in fatal accidents: 4
Pedestrians involved in fatal accidents: 0
Fatal accident statistics in 2011:
Fatal accident count: 1
Vehicles involved in fatal accidents: 2
Fatal accidents caused by drunken drivers: 1
Fatalities: 1
Persons involved in fatal accidents: 3
Pedestrians involved in fatal accidents: 0
Home Mortgage Disclosure Act Aggregated Statistics For Year 2009 (Based on 2 partial tracts)
A) FHA, FSA/RHS & VA Home Purchase Loans
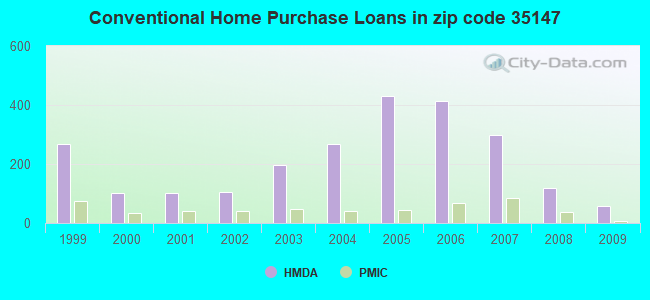
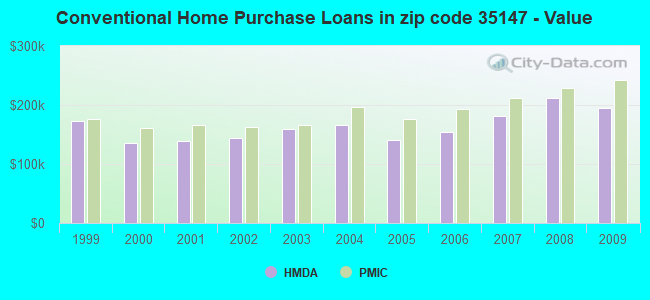
B) Conventional Home Purchase Loans
C) Refinancings
D) Home Improvement Loans
F) Non-occupant Loans on < 5 Family Dwellings (A B C & D)
G) Loans On Manufactured Home Dwelling (A B C & D)
Number
Average Value
Number
Average Value
Number
Average Value
Number
Average Value
Number
Average Value
Number
Average Value
LOANS ORIGINATED
87
$179,117
59
$195,686
299
$222,879
11
$99,746
10
$244,396
8
$63,828
APPLICATIONS APPROVED, NOT ACCEPTED
5
$189,906
1
$272,800
26
$175,056
2
$17,740
1
$191,490
3
$31,293
APPLICATIONS DENIED
14
$143,230
13
$164,239
94
$215,137
10
$48,917
2
$176,960
11
$77,376
APPLICATIONS WITHDRAWN
15
$160,900
11
$178,269
95
$214,280
4
$106,760
4
$192,525
3
$56,613
FILES CLOSED FOR INCOMPLETENESS
3
$139,233
2
$158,150
13
$177,132
1
$9,570
1
$16,330
0
$0
Aggregated Statistics For Year 2008 (Based on 2 partial tracts)
A) FHA, FSA/RHS & VA Home Purchase Loans
B) Conventional Home Purchase Loans
C) Refinancings
D) Home Improvement Loans
E) Loans on Dwellings For 5+ Families
F) Non-occupant Loans on < 5 Family Dwellings (A B C & D)
G) Loans On Manufactured Home Dwelling (A B C & D)
Number
Average Value
Number
Average Value
Number
Average Value
Number
Average Value
Number
Average Value
Number
Average Value
Number
Average Value
LOANS ORIGINATED
58
$179,699
117
$212,630
161
$211,450
19
$36,111
1
$239,360
13
$153,202
8
$45,946
APPLICATIONS APPROVED, NOT ACCEPTED
2
$137,140
8
$204,046
22
$185,357
2
$41,050
0
$0
3
$115,503
4
$37,382
APPLICATIONS DENIED
5
$165,390
25
$173,072
77
$193,944
12
$78,948
0
$0
2
$174,310
11
$71,543
APPLICATIONS WITHDRAWN
9
$178,497
14
$250,249
52
$237,462
1
$172,340
0
$0
4
$236,170
3
$72,013
FILES CLOSED FOR INCOMPLETENESS
1
$129,550
4
$190,065
13
$228,426
2
$18,520
0
$0
1
$69,840
0
$0
Aggregated Statistics For Year 2007 (Based on 2 partial tracts)
A) FHA, FSA/RHS & VA Home Purchase Loans
B) Conventional Home Purchase Loans
C) Refinancings
D) Home Improvement Loans
F) Non-occupant Loans on < 5 Family Dwellings (A B C & D)
G) Loans On Manufactured Home Dwelling (A B C & D)
Number
Average Value
Number
Average Value
Number
Average Value
Number
Average Value
Number
Average Value
Number
Average Value
LOANS ORIGINATED
13
$195,061
297
$180,888
155
$198,929
21
$55,434
19
$218,648
9
$49,152
APPLICATIONS APPROVED, NOT ACCEPTED
1
$68,710
28
$144,016
37
$133,871
5
$62,112
1
$72,780
6
$53,137
APPLICATIONS DENIED
0
$0
34
$180,339
95
$186,212
28
$89,184
3
$199,017
13
$57,351
APPLICATIONS WITHDRAWN
2
$117,875
26
$169,785
57
$222,285
12
$104,947
4
$290,278
1
$70,960
FILES CLOSED FOR INCOMPLETENESS
0
$0
10
$200,495
18
$192,986
0
$0
1
$114,890
1
$101,380
Aggregated Statistics For Year 2006 (Based on 2 partial tracts)
A) FHA, FSA/RHS & VA Home Purchase Loans
B) Conventional Home Purchase Loans
C) Refinancings
D) Home Improvement Loans
F) Non-occupant Loans on < 5 Family Dwellings (A B C & D)
G) Loans On Manufactured Home Dwelling (A B C & D)
Number
Average Value
Number
Average Value
Number
Average Value
Number
Average Value
Number
Average Value
Number
Average Value
LOANS ORIGINATED
17
$176,384
415
$154,494
147
$185,321
24
$88,165
25
$158,678
9
$63,922
APPLICATIONS APPROVED, NOT ACCEPTED
2
$230,360
51
$136,392
31
$131,024
5
$46,900
5
$160,056
5
$52,500
APPLICATIONS DENIED
1
$86,170
39
$140,887
89
$181,721
18
$61,266
7
$129,214
12
$66,988
APPLICATIONS WITHDRAWN
2
$176,000
47
$143,280
63
$204,835
4
$107,150
3
$135,407
2
$58,030
FILES CLOSED FOR INCOMPLETENESS
0
$0
15
$211,051
25
$217,776
2
$116,580
2
$117,145
0
$0
Aggregated Statistics For Year 2005 (Based on 2 partial tracts)
A) FHA, FSA/RHS & VA Home Purchase Loans
B) Conventional Home Purchase Loans
C) Refinancings
D) Home Improvement Loans
F) Non-occupant Loans on < 5 Family Dwellings (A B C & D)
G) Loans On Manufactured Home Dwelling (A B C & D)
Number
Average Value
Number
Average Value
Number
Average Value
Number
Average Value
Number
Average Value
Number
Average Value
LOANS ORIGINATED
19
$148,548
432
$139,920
169
$171,037
17
$22,165
30
$110,828
11
$38,352
APPLICATIONS APPROVED, NOT ACCEPTED
0
$0
23
$111,362
30
$154,763
5
$48,210
2
$136,270
5
$34,722
APPLICATIONS DENIED
2
$155,660
46
$124,914
91
$169,203
18
$74,117
3
$225,383
19
$55,473
APPLICATIONS WITHDRAWN
1
$144,180
42
$127,201
70
$175,590
15
$116,947
5
$62,628
4
$71,150
FILES CLOSED FOR INCOMPLETENESS
1
$144,180
13
$159,051
21
$200,135
2
$48,650
2
$111,015
0
$0
Aggregated Statistics For Year 2004 (Based on 2 partial tracts)
A) FHA, FSA/RHS & VA Home Purchase Loans
B) Conventional Home Purchase Loans
C) Refinancings
D) Home Improvement Loans
E) Loans on Dwellings For 5+ Families
F) Non-occupant Loans on < 5 Family Dwellings (A B C & D)
G) Loans On Manufactured Home Dwelling (A B C & D)
Number
Average Value
Number
Average Value
Number
Average Value
Number
Average Value
Number
Average Value
Number
Average Value
Number
Average Value
LOANS ORIGINATED
14
$146,975
268
$166,222
159
$164,711
13
$49,980
1
$40,550
18
$117,403
18
$42,032
APPLICATIONS APPROVED, NOT ACCEPTED
0
$0
27
$107,234
27
$123,714
5
$30,864
0
$0
1
$14,560
10
$48,303
APPLICATIONS DENIED
1
$137,420
37
$117,972
69
$133,635
21
$37,604
0
$0
2
$86,170
16
$46,507
APPLICATIONS WITHDRAWN
1
$78,850
25
$123,165
59
$151,029
4
$65,538
0
$0
3
$60,170
5
$47,724
FILES CLOSED FOR INCOMPLETENESS
0
$0
4
$145,698
27
$159,633
1
$27,030
0
$0
0
$0
2
$86,885
Aggregated Statistics For Year 2003 (Based on 2 partial tracts)
A) FHA, FSA/RHS & VA Home Purchase Loans
B) Conventional Home Purchase Loans
C) Refinancings
D) Home Improvement Loans
F) Non-occupant Loans on < 5 Family Dwellings (A B C & D)
Number
Average Value
Number
Average Value
Number
Average Value
Number
Average Value
Number
Average Value
LOANS ORIGINATED
17
$157,434
197
$159,895
351
$173,961
22
$47,170
13
$165,828
APPLICATIONS APPROVED, NOT ACCEPTED
0
$0
21
$120,149
36
$141,558
2
$14,775
1
$106,440
APPLICATIONS DENIED
2
$79,460
30
$114,504
84
$128,955
9
$47,144
2
$193,395
APPLICATIONS WITHDRAWN
1
$156,010
16
$117,062
50
$149,794
2
$94,055
1
$118,490
FILES CLOSED FOR INCOMPLETENESS
0
$0
3
$101,027
11
$138,938
1
$33,790
0
$0
Aggregated Statistics For Year 2002 (Based on 1 partial tract)
A) FHA, FSA/RHS & VA Home Purchase Loans
B) Conventional Home Purchase Loans
C) Refinancings
D) Home Improvement Loans
F) Non-occupant Loans on < 5 Family Dwellings (A B C & D)
Number
Average Value
Number
Average Value
Number
Average Value
Number
Average Value
Number
Average Value
LOANS ORIGINATED
8
$149,319
105
$143,353
142
$155,784
11
$30,105
7
$96,387
APPLICATIONS APPROVED, NOT ACCEPTED
1
$55,190
14
$79,572
17
$159,253
1
$46,750
1
$76,600
APPLICATIONS DENIED
4
$85,325
24
$64,040
32
$121,405
8
$70,259
2
$83,635
APPLICATIONS WITHDRAWN
1
$90,110
11
$164,301
24
$131,765
1
$28,160
2
$51,815
FILES CLOSED FOR INCOMPLETENESS
0
$0
3
$171,400
11
$148,685
0
$0
1
$141,930
Aggregated Statistics For Year 2001 (Based on 1 partial tract)
A) FHA, FSA/RHS & VA Home Purchase Loans
B) Conventional Home Purchase Loans
C) Refinancings
D) Home Improvement Loans
F) Non-occupant Loans on < 5 Family Dwellings (A B C & D)
Number
Average Value
Number
Average Value
Number
Average Value
Number
Average Value
Number
Average Value
LOANS ORIGINATED
8
$156,851
102
$139,315
144
$151,724
11
$25,242
8
$116,160
APPLICATIONS APPROVED, NOT ACCEPTED
0
$0
10
$78,679
18
$119,774
1
$22,530
1
$91,240
APPLICATIONS DENIED
1
$108,130
23
$71,061
41
$97,489
5
$12,616
1
$128,970
APPLICATIONS WITHDRAWN
0
$0
6
$147,465
22
$115,149
1
$34,920
0
$0
FILES CLOSED FOR INCOMPLETENESS
0
$0
3
$154,693
7
$133,317
0
$0
0
$0
Aggregated Statistics For Year 2000 (Based on 1 partial tract)
A) FHA, FSA/RHS & VA Home Purchase Loans
B) Conventional Home Purchase Loans
C) Refinancings
D) Home Improvement Loans
E) Loans on Dwellings For 5+ Families
F) Non-occupant Loans on < 5 Family Dwellings (A B C & D)
Number
Average Value
Number
Average Value
Number
Average Value
Number
Average Value
Number
Average Value
Number
Average Value
LOANS ORIGINATED
7
$112,881
102
$135,709
30
$114,480
11
$20,941
1
$203,320
2
$111,795
APPLICATIONS APPROVED, NOT ACCEPTED
2
$33,790
10
$101,376
5
$75,468
2
$30,415
0
$0
0
$0
APPLICATIONS DENIED
1
$42,240
37
$48,983
14
$85,486
6
$7,415
0
$0
4
$46,182
APPLICATIONS WITHDRAWN
1
$43,370
8
$181,772
4
$102,925
0
$0
0
$0
0
$0
FILES CLOSED FOR INCOMPLETENESS
0
$0
1
$191,490
5
$117,596
0
$0
0
$0
0
$0
Aggregated Statistics For Year 1999 (Based on 2 partial tracts)
A) FHA, FSA/RHS & VA Home Purchase Loans
B) Conventional Home Purchase Loans
C) Refinancings
D) Home Improvement Loans
F) Non-occupant Loans on < 5 Family Dwellings (A B C & D)

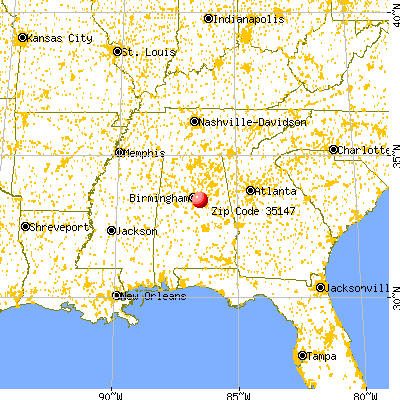


 Nearest zip codes: 35176, 35094, 35078, 35178, 35242, 35186.