Estimated zip code population in 2022: 8,098 Zip code population in 2010: 7,407 Zip code population in 2000: 7,403
Houses and condos: 7,342 Renter-occupied apartments: 379
% of renters here:
9%
State:
33%
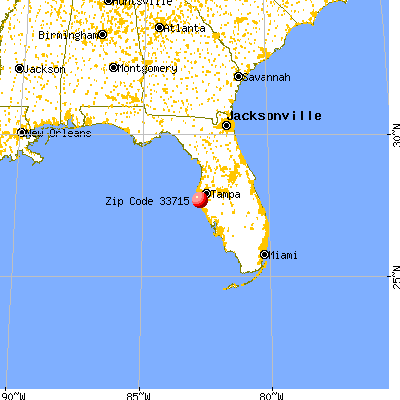
March 2022 cost of living index in zip code 33715: 103.0 (near average, U.S. average is 100)
Land area: 3.6 sq. mi. Water area: 9.1 sq. mi.
Population density: 2,219 people per square mile
(low).
OSM Map
General Map
Google Map
MSN Map
OSM Map
General Map
Google Map
MSN Map
OSM Map
General Map
Google Map
MSN Map
OSM Map
General Map
Google Map
MSN Map
Please wait while loading the map...
Real estate property taxes paid for housing units in 2022:
This zip code:
0.9% ($5,103)
Florida:
0.7% ($2,529)
Median real estate property taxes paid for housing units with mortgages in 2022: $5,209 (0.9%) Median real estate property taxes paid for housing units with no mortgage in 2022: $4,922 (0.9%)
Estimated median house/condo value in 2022: $559,749
33715:
$559,749
Florida:
$354,100
According to our research of Florida and other state lists, there were 2 registered sex offenders living in 33715 zip code as of June 05, 2024. The ratio of all residents to sex offenders in zip code 33715 is 3,605 to 1. The ratio of registered sex offenders to all residents in this zip code is much lower than the state average.
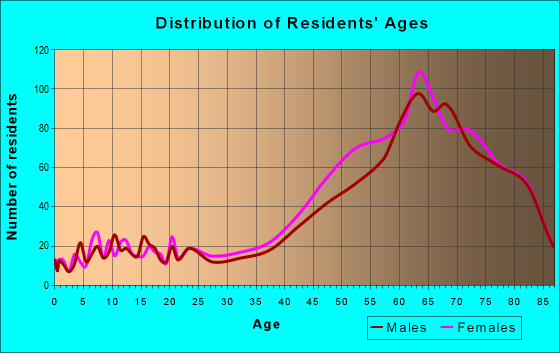
Median resident age:
This zip code:
63.0 years
Florida median age:
42.7 years
Average household size:
This zip code:
2.0 people
Florida:
2.5 people
Averages for the 2020 tax year for zip code 33715, filed in 2021:
Average Adjusted Gross Income (AGI) in 2020: $275,188 (Individual Income Tax Returns)
Here:
$275,188
State:
$82,200
Salary/wage: $156,294 (reported on 55.3% of returns)
Here:
$156,294
State:
$58,347
(% of AGI for various income ranges: 887.5% for AGIs below $25k, 2344.9% for AGIs $25k-50k, 4459.3% for AGIs $50k-75k, 6697.0% for AGIs $75k-100k, 12727.0% for AGIs $100k-200k, 127535.9% for AGIs over 200k)
Taxable interest for individuals: $7,094 (reported on 63.1% of returns)
This zip code:
$7,094
Florida:
$4,272
(% of AGI for various income ranges: 85.0% for AGIs below $25k, 121.1% for AGIs $25k-50k, 260.7% for AGIs $50k-75k, 439.0% for AGIs $75k-100k, 658.7% for AGIs $100k-200k, 6408.2% for AGIs over 200k)
Ordinary dividends: $21,874 (reported on 56.9% of returns)
Here:
$21,874
State:
$15,863
(% of AGI for various income ranges: 251.1% for AGIs below $25k, 403.7% for AGIs $25k-50k, 645.6% for AGIs $50k-75k, 1238.5% for AGIs $75k-100k, 1834.3% for AGIs $100k-200k, 17759.5% for AGIs over 200k)
Net capital gain/loss in AGI: +$138,033 (reported on 54.4% of returns)
Here:
+$138,033
State:
+$62,983
(% of AGI for various income ranges: 45.5% for AGIs below $25k, 232.0% for AGIs $25k-50k, 748.9% for AGIs $50k-75k, 1036.0% for AGIs $75k-100k, 2432.0% for AGIs $100k-200k, 141293.2% for AGIs over 200k)
Profit/loss from business: +$29,504 (reported on 18.3% of returns)
Here:
+$29,504
State:
+$9,719
(% of AGI for various income ranges: 170.2% for AGIs below $25k, 373.4% for AGIs $25k-50k, 427.0% for AGIs $50k-75k, 648.0% for AGIs $75k-100k, 683.3% for AGIs $100k-200k, 7252.3% for AGIs over 200k)
Taxable individual retirement arrangement distribution: $36,524 (reported on 28.0% of returns)
33715:
$36,524
Florida:
$24,823
(% of AGI for various income ranges: 270.5% for AGIs below $25k, 621.4% for AGIs $25k-50k, 1090.0% for AGIs $50k-75k, 1884.0% for AGIs $75k-100k, 3252.4% for AGIs $100k-200k, 8873.6% for AGIs over 200k)
Self-employed (Keogh) retirement plans: $32,933 (reported on 1.4% of returns)
33715:
$32,933
Florida:
$29,694
(% of AGI for various income ranges: 898.2% for AGIs over 200k)
Total itemized deductions: $44,646 (reported on 22.0% of returns)
Here:
$44,646
State:
$45,393
(% of AGI for various income ranges: 268.6% for AGIs below $25k, 463.7% for AGIs $25k-50k, 614.1% for AGIs $50k-75k, 1199.5% for AGIs $75k-100k, 1859.1% for AGIs $100k-200k, 12475.5% for AGIs over 200k)
Charity contributions: $17,365 (reported on 19.3% of returns)
Here:
$17,365
State:
$20,178
(% of AGI for various income ranges: 13.2% for AGIs below $25k, 26.9% for AGIs $25k-50k, 101.1% for AGIs $50k-75k, 248.0% for AGIs $75k-100k, 367.8% for AGIs $100k-200k, 5442.7% for AGIs over 200k)
Taxes paid: $8,348 (reported on 21.8% of returns)
33715:
$8,348
State:
$6,967
(% of AGI for various income ranges: 51.8% for AGIs below $25k, 83.7% for AGIs $25k-50k, 139.3% for AGIs $50k-75k, 319.5% for AGIs $75k-100k, 485.4% for AGIs $100k-200k, 1891.8% for AGIs over 200k)
Earned income credit: $1,093 (reported on 3.2% of returns)
Here:
$1,093
State:
$2,306
(% of AGI for various income ranges: 34.8% for AGIs below $25k)
Percentage of individuals using paid preparers for their 2020 taxes: 90.4%
Here:
90%
State:
92%
(% for various income ranges: 88.2% for AGIs below $25k, 89.7% for AGIs $25k-50k, 90.4% for AGIs $50k-75k, 88.4% for AGIs $75k-100k, 90.5% for AGIs $100k-200k, 93.5% for AGIs over 200k)
Averages for the 2012 tax year for zip code 33715, filed in 2013:
Average Adjusted Gross Income (AGI) in 2012: $178,080 (Individual Income Tax Returns)
Here:
$178,080
State:
$60,316
Salary/wage: $106,969 (reported on 58.9% of returns)
Here:
$106,969
State:
$45,277
(% of AGI for various income ranges: 47.7% for AGIs below $25k, 47.4% for AGIs $25k-50k, 41.8% for AGIs $50k-75k, 36.2% for AGIs $75k-100k, 46.1% for AGIs $100k-200k, 31.6% for AGIs over 200k)
Taxable interest for individuals: $7,627 (reported on 63.3% of returns)
This zip code:
$7,627
Florida:
$3,587
(% of AGI for various income ranges: 5.6% for AGIs below $25k, 3.0% for AGIs $25k-50k, 2.9% for AGIs $50k-75k, 2.4% for AGIs $75k-100k, 2.7% for AGIs $100k-200k, 2.6% for AGIs over 200k)
Ordinary dividends: $21,804 (reported on 52.6% of returns)
Here:
$21,804
State:
$12,831
(% of AGI for various income ranges: 11.5% for AGIs below $25k, 5.5% for AGIs $25k-50k, 5.8% for AGIs $50k-75k, 5.0% for AGIs $75k-100k, 5.2% for AGIs $100k-200k, 6.8% for AGIs over 200k)
Net capital gain/loss in AGI: +$70,312 (reported on 50.5% of returns)
Here:
+$70,312
State:
+$33,493
(% of AGI for various income ranges: 0.3% for AGIs $25k-50k, 1.9% for AGIs $50k-75k, 1.9% for AGIs $75k-100k, 3.8% for AGIs $100k-200k, 27.7% for AGIs over 200k)
Profit/loss from business: +$23,421 (reported on 17.7% of returns)
Here:
+$23,421
State:
+$10,012
(% of AGI for various income ranges: 7.8% for AGIs below $25k, 4.0% for AGIs $25k-50k, 3.3% for AGIs $50k-75k, 2.7% for AGIs $75k-100k, 3.0% for AGIs $100k-200k, 1.9% for AGIs over 200k)
Taxable individual retirement arrangement distribution: $31,988 (reported on 31.5% of returns)
33715:
$31,988
Florida:
$21,544
(% of AGI for various income ranges: 13.1% for AGIs below $25k, 8.8% for AGIs $25k-50k, 9.2% for AGIs $50k-75k, 11.5% for AGIs $75k-100k, 11.2% for AGIs $100k-200k, 3.4% for AGIs over 200k)
Self-employment retirement plans: $19,783 (reported on 1.6% of returns)
33715:
$19,783
Florida:
$20,611
Total itemized deductions: $36,539 (12% of AGI, reported on 51.6% of returns)
Here:
$36,539
State:
$25,533
Here:
12.4% of AGI
State:
18.0% of AGI
(% of AGI for various income ranges: 34.9% for AGIs below $25k, 18.1% for AGIs $25k-50k, 17.0% for AGIs $50k-75k, 14.4% for AGIs $75k-100k, 14.4% for AGIs $100k-200k, 8.0% for AGIs over 200k)
Charity contributions: $7,620 (reported on 45.1% of returns)
Here:
$7,620
State:
$5,698
(% of AGI for various income ranges: 1.9% for AGIs below $25k, 1.9% for AGIs $25k-50k, 2.0% for AGIs $50k-75k, 1.8% for AGIs $75k-100k, 1.9% for AGIs $100k-200k, 1.9% for AGIs over 200k)
Taxes paid: $12,837 (reported on 51.3% of returns)
33715:
$12,837
State:
$6,203
(% of AGI for various income ranges: 7.8% for AGIs below $25k, 4.9% for AGIs $25k-50k, 4.7% for AGIs $50k-75k, 4.4% for AGIs $75k-100k, 4.9% for AGIs $100k-200k, 3.2% for AGIs over 200k)
Earned income credit: $1,180 (reported on 3.9% of returns)
Here:
$1,180
State:
$2,372
(% of AGI for various income ranges: 1.6% for AGIs below $25k)
Percentage of individuals using paid preparers for their 2012 taxes: 65.9%
Here:
66%
State:
54%
(% for various income ranges: 58.9% for AGIs below $25k, 59.0% for AGIs $25k-50k, 64.0% for AGIs $50k-75k, 66.0% for AGIs $75k-100k, 67.1% for AGIs $100k-200k, 85.5% for AGIs over 200k)
Averages for the 2004 tax year for zip code 33715, filed in 2005:
Average Adjusted Gross Income (AGI) in 2004: $145,442 (Individual Income Tax Returns)
Here:
$145,442
State:
$50,523
Salary/wage: $91,223 (reported on 60.7% of returns)
Here:
$91,223
State:
$39,563
(% of AGI for various income ranges: 38.7% for AGIs $10k-25k, 48.6% for AGIs $25k-50k, 44.4% for AGIs $50k-75k, 48.4% for AGIs $75k-100k, 35.3% for AGIs over 100k)
Taxable interest for individuals: $6,695 (reported on 74.3% of returns)
This zip code:
$6,695
Florida:
$3,211
(% of AGI for various income ranges: 9.8% for AGIs $10k-25k, 5.4% for AGIs $25k-50k, 6.2% for AGIs $50k-75k, 4.0% for AGIs $75k-100k, 2.7% for AGIs over 100k)
Taxable dividends: $11,551 (reported on 60.1% of returns)
Here:
$11,551
State:
$6,129
(% of AGI for various income ranges: 9.9% for AGIs $10k-25k, 6.1% for AGIs $25k-50k, 5.5% for AGIs $50k-75k, 6.2% for AGIs $75k-100k, 4.3% for AGIs over 100k)
Net capital gain/loss: +$38,983 (reported on 57.4% of returns)
Here:
+$38,983
State:
+$27,205
(% of AGI for various income ranges: 1.6% for AGIs $10k-25k, 1.6% for AGIs $25k-50k, 2.2% for AGIs $50k-75k, 4.2% for AGIs $75k-100k, 18.0% for AGIs over 100k)
Profit/loss from business: +$19,593 (reported on 17.6% of returns)
Here:
+$19,593
State:
+$10,634
(% of AGI for various income ranges: 4.7% for AGIs $10k-25k, 3.3% for AGIs $25k-50k, 3.8% for AGIs $50k-75k, 2.6% for AGIs $75k-100k, 2.1% for AGIs over 100k)
IRA payment deduction: $3,931 (reported on 4.5% of returns)
33715:
$3,931
Florida:
$3,082
(% of AGI for various income ranges: 0.5% for AGIs $10k-25k, 0.3% for AGIs $25k-50k, 0.4% for AGIs $50k-75k, 0.2% for AGIs $75k-100k, 0.1% for AGIs over 100k)
Self-employed pension: $18,955 (reported on 1.7% of returns)
Here:
$18,955
Florida:
$15,857
Total itemized deductions: $29,985 (15% of AGI, reported on 57.5% of returns)
Here:
$29,985
State:
$20,370
Here:
14.8% of AGI
State:
20.7% of AGI
(% of AGI for various income ranges: 38.5% for AGIs $10k-25k, 23.5% for AGIs $25k-50k, 19.7% for AGIs $50k-75k, 18.1% for AGIs $75k-100k, 9.3% for AGIs over 100k)
Charity contributions deductions: $7,049 (4% of AGI, reported on 51.1% of returns)
Here:
$7,049
State:
$4,064
Here:
3.5% of AGI
State:
3.8% of AGI
(% of AGI for various income ranges: 3.0% for AGIs $10k-25k, 2.1% for AGIs $25k-50k, 2.2% for AGIs $50k-75k, 2.0% for AGIs $75k-100k, 2.5% for AGIs over 100k)
Total tax: $33,939 (reported on 84.3% of returns)
33715:
$33,939
State:
$9,431
(% of AGI for various income ranges: 5.2% for AGIs $10k-25k, 7.6% for AGIs $25k-50k, 10.5% for AGIs $50k-75k, 11.6% for AGIs $75k-100k, 21.6% for AGIs over 100k)
Earned income credit: $705 (reported on 2.7% of returns)
Here:
$705
State:
$1,808
Percentage of individuals using paid preparers for their 2004 taxes: 67.2%
Here:
67%
State:
60%
(% for various income ranges: 64.3% for AGIs below $10k, 63.5% for AGIs $10k-25k, 63.6% for AGIs $25k-50k, 61.6% for AGIs $50k-75k, 64.0% for AGIs $75k-100k, 76.3% for AGIs over 100k)
Likely homosexual households (counted as self-reported same-sex unmarried-partner households)
Lesbian couples: 0.3% of all households
Gay men: 0.2% of all households
Household received Food Stamps/SNAP in the past 12 months: 14 Household did not receive Food Stamps/SNAP in the past 12 months: 4,101
Women who had a birth in the past 12 months: 32 (34 now married, 0 unmarried) Women who did not have a birth in the past 12 months: 844 (342 now married, 501 unmarried)
Housing units in zip code 33715 with a mortgage: 1,626 (149 second mortgage, 133 both second mortgage and home equity loan) Houses without a mortgage: 60
Median monthly owner costs for units with a mortgage: $2,893 Median monthly owner costs for units without a mortgage: $1,190
Residents with income below the poverty level in 2022:
This zip code:
3.8%
Whole state:
12.7%
Residents with income below 50% of the poverty level in 2022:
This zip code:
1.6%
Whole state:
6.6%
Median number of rooms in houses and condos:
Here:
5.3
State:
5.9
Median number of rooms in apartments:
Here:
4.2
State:
4.2
Notable locations in this zip code not listed on our city pages
Size of family households: 1,981 2-persons, 292 3-persons, 248 4-persons, 48 5-persons, 5 6-persons, 13 7-or-more-persons
Size of nonfamily households: 1,221 1-person, 237 2-persons, 33 3-persons
619 married couples with children.
225 single-parent households (33 men, 192 women).
90.3% of residents of 33715 zip code speak English at home.
5.0% of residents speak Spanish at home (86% very well, 11% well, 3% not at all).
3.6% of residents speak other Indo-European language at home (81% very well, 11% well, 6% not well, 2% not at all).
0.8% of residents speak Asian or Pacific Island language at home (87% very well, 13% well).
1.0% of residents speak other language at home (75% very well, 14% well, 10% not well).
Foreign born population: 900 (11.1%) (71.3% of them are naturalized citizens)
This zip code:
11.1%
Whole state:
21.7%
11%Malaysia
8%Sweden
8%Uruguay
7%Croatia
6%United Kingdom, excluding England and Scotland
5%Egypt
4%Algeria
17%Italian
13%Irish
11%German
10%English
7%American
5%Czechoslovakian
3%Polish
Year of entry for the foreign-born population
2092010 or later
912000 to 2009
1431990 to 1999
572Before 1990
Facilities with environmental interests located in this zip code:
7 - ELEVEN STORE #29301 (150 PINELLAS BAYWAY in TIERRA VERDE, FL)
STATE MASTER (FDM) - WAFR-FLG910318, INDUSTRIAL WASTEWATER PROGRAM, WAFR-FLG911899, National Pollutant Discharge Elimination System NON-MAJOR (Tracking pollutant discharge elimination systems) - permit Business SIC classification: GASOLINE SERVICE STATIONS Organizations: 7-ELEVEN INC, WILLO SMITH (CONTACT/OWNER)
, 7-ELEVEN INC (CONTACT/PERMIT)
, SHAW ENVIRONMENTAL, INC. (ENGINEER)
PINELLAS BAYWAY SIDEWALK IMPRO ( in ST PETERSBURG, FL)
National Pollutant Discharge Elimination System NON-MAJOR (Tracking pollutant discharge elimination systems) - permit Organizations: PETER YAUCH (CONTACT/OWNER)
RECLAIMED WTR DIST SYSTEM (1641 PINELLAS BAYWAY in TIERRA VERDE, FL)
National Pollutant Discharge Elimination System NON-MAJOR (Tracking pollutant discharge elimination systems) - permit Alternative names: WESTRA CONSTRUCTION CORP
Housing units lacking complete kitchen facilities: 0.8%
95.1%Electricity
3.1%Utility gas
1.0%No fuel used
0.8%Bottled, tank, or LP gas
Population in 1990: 3,877. Population change in the 1990s: +3,526 (+90.9%).
Place of birth for U.S.-born residents:
This state: 1,469
Northeast: 2,380
Midwest: 1,674
South: 1,231
West: 287
48% of the 33715 zip code residents lived in the same house 5 years ago. Out of people who lived in different houses, 39% lived in this county. Out of people who lived in different counties, 50% lived in Florida.
88% of the 33715 zip code residents lived in the same house 1 year ago. Out of people who lived in different houses, 45% moved from this county. Out of people who lived in different houses, 15% moved from different county within same state. Out of people who lived in different houses, 28% moved from different state. Out of people who lived in different houses, 13% moved from abroad.
Private vs. public school enrollment:
Students in private schools in grades 1 to 8 (elementary and middle school): 32
Here:
9.7%
Florida:
15.8%
Students in private schools in grades 9 to 12 (high school): 77
Here:
43.4%
Florida:
12.9%
Students in private undergraduate colleges: 33
Here:
14.8%
Florida:
23.6%
Occupation by median earnings in the past 12 months ($)
133,849Computer and mathematical occupations
127,042Architecture and engineering occupations
124,938Health diagnosing and treating practitioners and other technical occupations
118,612Sales and related occupations
112,599Management occupations
83,783Community and social service occupations
Companies with federal contracts located in this zip code:
TAMPA BAYWATCH, INC (3000 PINELLAS BAYWAY SOUTH in TIERRA VERDE, FL) : $150,000 in 4 contractsfrom 2002 to 2004
$60,000 with Air Force for Other Environmental Services, Studies, and Analytical Support. Signed on 2002-09-27. Completion date: 2003-06-25.
$30,000 with Air Force for Other Natural Resources and Conservation Services. Signed on 2004-06-18. Completion date: 2005-06-18.
$30,000 with Air Force for Other Environmental Services, Studies, and Analytical Support. Signed on 2003-09-29. Completion date: 2004-12-31.
$30,000, same as above.Signed on 2003-05-09. Completion date: 2004-12-31.
FIELD FORENSICS INC (1583 PINELLAS BAYWAY SOUTH in SAINT PETERSBU, FL; small business) : $132,961 in 3 contractsfrom 2002 to 2004
$60,585 with Department of Defense for Combination and Miscellaneous Instruments. Signed on 2002-06-05. Completion date: 2002-07-12.
$36,396 with Virginia Contracting Activity for Chemical Weapons and Equipment. Signed on 2004-03-03. Completion date: 2004-09-09.
$35,980 with Department of Defense for Medical and Surgical Instruments, Equipment, and Supplies. Taking place in AL. Signed on 2003-07-07. Completion date: 2003-08-08.
Top industries in this zip code by the number of employees in 2005:
Administrative and Support and Waste Management and Remediation Services: Professional Employer Organizations (50-99: 1, 1-4: 3)
Other Services (except Public Administration): Other Similar Organizations (except Business, Professional, Labor, and Political Organizations) (50-99: 1, 1-4: 1)
Arts, Entertainment, and Recreation: Golf Courses and Country Clubs (50-99: 1)
Real Estate and Rental and Leasing: Offices of Real Estate Agents and Brokers (10-19: 1, 5-9: 1, 1-4: 13)
Other Services (except Public Administration): Beauty Salons (10-19: 2, 5-9: 1, 1-4: 2)
Management of Companies and Enterprises: Corporate, Subsidiary, and Regional Managing Offices (20-49: 1, 1-4: 1)
Administrative and Support and Waste Management and Remediation Services: Landscaping Services (20-49: 1)
Wholesale Trade: Fish and Seafood Merchant Wholesalers (20-49: 1)
Home Mortgage Disclosure Act Aggregated Statistics For Year 2009 (Based on 16 partial tracts)
A) FHA, FSA/RHS & VA Home Purchase Loans
B) Conventional Home Purchase Loans
C) Refinancings
D) Home Improvement Loans
E) Loans on Dwellings For 5+ Families
F) Non-occupant Loans on < 5 Family Dwellings (A B C & D)
Number
Average Value
Number
Average Value
Number
Average Value
Number
Average Value
Number
Average Value
Number
Average Value
LOANS ORIGINATED
6
$262,160
66
$244,004
93
$248,925
4
$84,445
1
$44,900
64
$211,867
APPLICATIONS APPROVED, NOT ACCEPTED
1
$292,880
9
$237,251
12
$226,360
1
$8,710
0
$0
9
$184,827
APPLICATIONS DENIED
3
$188,327
8
$236,496
50
$256,740
1
$83,780
0
$0
21
$202,847
APPLICATIONS WITHDRAWN
4
$246,298
11
$229,147
32
$280,395
2
$206,420
0
$0
14
$230,405
FILES CLOSED FOR INCOMPLETENESS
1
$147,440
2
$254,005
11
$294,584
0
$0
0
$0
5
$206,422
Aggregated Statistics For Year 2008 (Based on 16 partial tracts)
A) FHA, FSA/RHS & VA Home Purchase Loans
B) Conventional Home Purchase Loans
C) Refinancings
D) Home Improvement Loans
F) Non-occupant Loans on < 5 Family Dwellings (A B C & D)
Number
Average Value
Number
Average Value
Number
Average Value
Number
Average Value
Number
Average Value
LOANS ORIGINATED
0
$0
56
$292,602
74
$289,146
5
$186,450
52
$246,208
APPLICATIONS APPROVED, NOT ACCEPTED
0
$0
6
$399,215
15
$238,993
0
$0
5
$541,120
APPLICATIONS DENIED
1
$146,770
11
$394,992
42
$315,505
3
$314,993
23
$257,182
APPLICATIONS WITHDRAWN
1
$157,500
12
$399,104
23
$252,986
2
$117,285
14
$197,039
FILES CLOSED FOR INCOMPLETENESS
0
$0
6
$383,132
10
$262,450
0
$0
8
$227,784
Aggregated Statistics For Year 2007 (Based on 16 partial tracts)
B) Conventional Home Purchase Loans
C) Refinancings
D) Home Improvement Loans
E) Loans on Dwellings For 5+ Families
F) Non-occupant Loans on < 5 Family Dwellings (A B C & D)
Number
Average Value
Number
Average Value
Number
Average Value
Number
Average Value
Number
Average Value
LOANS ORIGINATED
88
$338,009
133
$321,958
9
$239,931
0
$0
93
$302,887
APPLICATIONS APPROVED, NOT ACCEPTED
11
$346,250
27
$288,285
3
$96,510
0
$0
11
$229,025
APPLICATIONS DENIED
31
$502,304
87
$412,728
8
$188,912
0
$0
39
$320,992
APPLICATIONS WITHDRAWN
8
$599,326
43
$422,709
4
$495,780
1
$80,420
14
$439,029
FILES CLOSED FOR INCOMPLETENESS
7
$665,604
13
$579,775
0
$0
0
$0
5
$303,600
Aggregated Statistics For Year 2006 (Based on 16 partial tracts)
A) FHA, FSA/RHS & VA Home Purchase Loans
B) Conventional Home Purchase Loans
C) Refinancings
D) Home Improvement Loans
F) Non-occupant Loans on < 5 Family Dwellings (A B C & D)
G) Loans On Manufactured Home Dwelling (A B C & D)
Number
Average Value
Number
Average Value
Number
Average Value
Number
Average Value
Number
Average Value
Number
Average Value
LOANS ORIGINATED
0
$0
131
$351,272
174
$340,023
10
$280,680
116
$287,695
1
$10,050
APPLICATIONS APPROVED, NOT ACCEPTED
0
$0
17
$386,666
27
$374,270
3
$243,507
12
$282,042
1
$63,000
APPLICATIONS DENIED
0
$0
27
$561,578
66
$339,010
1
$267,410
29
$339,699
0
$0
APPLICATIONS WITHDRAWN
1
$34,180
15
$533,926
50
$386,437
3
$238,367
7
$439,269
0
$0
FILES CLOSED FOR INCOMPLETENESS
0
$0
6
$380,227
13
$418,668
1
$268,080
5
$275,184
0
$0
Aggregated Statistics For Year 2005 (Based on 16 partial tracts)
B) Conventional Home Purchase Loans
C) Refinancings
D) Home Improvement Loans
E) Loans on Dwellings For 5+ Families
F) Non-occupant Loans on < 5 Family Dwellings (A B C & D)
G) Loans On Manufactured Home Dwelling (A B C & D)
Number
Average Value
Number
Average Value
Number
Average Value
Number
Average Value
Number
Average Value
Number
Average Value
LOANS ORIGINATED
299
$350,510
203
$300,966
17
$188,878
2
$272,770
204
$265,061
0
$0
APPLICATIONS APPROVED, NOT ACCEPTED
23
$294,160
21
$272,069
2
$212,120
0
$0
17
$214,031
0
$0
APPLICATIONS DENIED
34
$302,083
51
$515,936
11
$200,207
0
$0
30
$263,366
1
$178,940
APPLICATIONS WITHDRAWN
24
$365,957
42
$400,045
8
$279,809
0
$0
15
$319,730
1
$77,740
FILES CLOSED FOR INCOMPLETENESS
5
$576,372
28
$250,009
1
$46,910
0
$0
5
$224,382
0
$0
Aggregated Statistics For Year 2004 (Based on 16 partial tracts)
A) FHA, FSA/RHS & VA Home Purchase Loans
B) Conventional Home Purchase Loans
C) Refinancings
D) Home Improvement Loans
F) Non-occupant Loans on < 5 Family Dwellings (A B C & D)
G) Loans On Manufactured Home Dwelling (A B C & D)
Number
Average Value
Number
Average Value
Number
Average Value
Number
Average Value
Number
Average Value
Number
Average Value
LOANS ORIGINATED
0
$0
326
$279,615
189
$252,797
15
$174,699
214
$226,246
0
$0
APPLICATIONS APPROVED, NOT ACCEPTED
0
$0
29
$419,314
29
$201,176
3
$114,380
17
$255,386
1
$110,580
APPLICATIONS DENIED
1
$229,880
30
$378,105
50
$265,506
9
$113,711
25
$234,195
0
$0
APPLICATIONS WITHDRAWN
0
$0
33
$356,526
39
$246,479
1
$77,070
19
$203,247
1
$53,620
FILES CLOSED FOR INCOMPLETENESS
0
$0
8
$433,116
25
$270,412
1
$157,500
5
$173,582
0
$0
Aggregated Statistics For Year 2003 (Based on 16 partial tracts)
A) FHA, FSA/RHS & VA Home Purchase Loans
B) Conventional Home Purchase Loans
C) Refinancings
D) Home Improvement Loans
F) Non-occupant Loans on < 5 Family Dwellings (A B C & D)
Number
Average Value
Number
Average Value
Number
Average Value
Number
Average Value
Number
Average Value
LOANS ORIGINATED
2
$175,930
286
$236,895
575
$196,328
11
$80,912
288
$165,125
APPLICATIONS APPROVED, NOT ACCEPTED
0
$0
16
$556,350
63
$196,794
2
$136,385
15
$197,083
APPLICATIONS DENIED
1
$241,270
19
$290,514
71
$215,550
9
$75,211
19
$172,453
APPLICATIONS WITHDRAWN
0
$0
18
$303,526
46
$198,292
2
$88,130
13
$156,466
FILES CLOSED FOR INCOMPLETENESS
0
$0
10
$243,484
11
$187,168
0
$0
3
$200,167
Aggregated Statistics For Year 2002 (Based on 16 partial tracts)
A) FHA, FSA/RHS & VA Home Purchase Loans
B) Conventional Home Purchase Loans
C) Refinancings
D) Home Improvement Loans
F) Non-occupant Loans on < 5 Family Dwellings (A B C & D)
Number
Average Value
Number
Average Value
Number
Average Value
Number
Average Value
Number
Average Value
LOANS ORIGINATED
1
$72,380
279
$203,505
374
$197,512
16
$71,502
190
$144,767
APPLICATIONS APPROVED, NOT ACCEPTED
0
$0
19
$254,076
38
$204,623
1
$67,020
19
$166,845
APPLICATIONS DENIED
1
$64,340
13
$167,602
66
$244,420
4
$68,192
13
$148,991
APPLICATIONS WITHDRAWN
1
$54,290
22
$238,713
44
$193,871
2
$112,260
11
$187,656
FILES CLOSED FOR INCOMPLETENESS
0
$0
5
$325,718
21
$176,103
0
$0
5
$147,846
Aggregated Statistics For Year 2001 (Based on 16 partial tracts)
A) FHA, FSA/RHS & VA Home Purchase Loans
B) Conventional Home Purchase Loans
C) Refinancings
D) Home Improvement Loans
F) Non-occupant Loans on < 5 Family Dwellings (A B C & D)
Number
Average Value
Number
Average Value
Number
Average Value
Number
Average Value
Number
Average Value
LOANS ORIGINATED
3
$168,890
285
$161,669
266
$174,900
13
$48,615
182
$128,329
APPLICATIONS APPROVED, NOT ACCEPTED
0
$0
13
$137,907
35
$113,915
5
$50,266
7
$98,233
APPLICATIONS DENIED
0
$0
19
$181,413
60
$152,582
7
$49,116
11
$110,948
APPLICATIONS WITHDRAWN
1
$61,660
11
$158,228
38
$163,070
6
$35,632
5
$132,700
FILES CLOSED FOR INCOMPLETENESS
0
$0
7
$208,240
5
$157,228
1
$9,380
3
$182,293
Aggregated Statistics For Year 2000 (Based on 16 partial tracts)
A) FHA, FSA/RHS & VA Home Purchase Loans
B) Conventional Home Purchase Loans
C) Refinancings
D) Home Improvement Loans
F) Non-occupant Loans on < 5 Family Dwellings (A B C & D)
Number
Average Value
Number
Average Value
Number
Average Value
Number
Average Value
Number
Average Value
LOANS ORIGINATED
1
$149,450
335
$158,005
48
$170,831
13
$52,791
105
$132,942
APPLICATIONS APPROVED, NOT ACCEPTED
0
$0
20
$126,165
10
$97,179
7
$45,861
9
$86,753
APPLICATIONS DENIED
3
$84,670
29
$187,078
25
$170,070
6
$48,032
4
$87,965
APPLICATIONS WITHDRAWN
1
$51,610
33
$156,705
15
$189,354
3
$90,253
10
$97,849
FILES CLOSED FOR INCOMPLETENESS
0
$0
5
$194,224
8
$224,769
1
$6,700
1
$211,110
Aggregated Statistics For Year 1999 (Based on 8 partial tracts)
A) FHA, FSA/RHS & VA Home Purchase Loans
B) Conventional Home Purchase Loans
C) Refinancings
D) Home Improvement Loans
F) Non-occupant Loans on < 5 Family Dwellings (A B C & D)
Detailed PMIC statistics for the following Tracts:0201.03
2002 - 2018 National Fire Incident Reporting System (NFIRS) incidents
Based on the data from the years 2002 - 2018 the average number of fires per year is 21. The highest number of reported fire incidents - 39 took place in 2006, and the least - 10 in 2017. The data has a rising trend.
When looking into fire subcategories, the most reports belonged to: Structure Fires (45.8%), and Outside Fires (24.4%).
Fire incident types reported to NFIRS in Zip Code 33715


 Nearest zip codes: 33706, 33711, 33712, 33707, 33705, 34216.


 Based on the data from the years 2002 - 2018 the average number of fires per year is 21. The highest number of reported fire incidents - 39 took place in 2006, and the least - 10 in 2017. The data has a rising trend.
 When looking into fire subcategories, the most reports belonged to: Structure Fires (45.8%), and Outside Fires (24.4%).