Estimated zip code population in 2022: 10,241 Zip code population in 2010: 9,848 Zip code population in 2000: 9,036
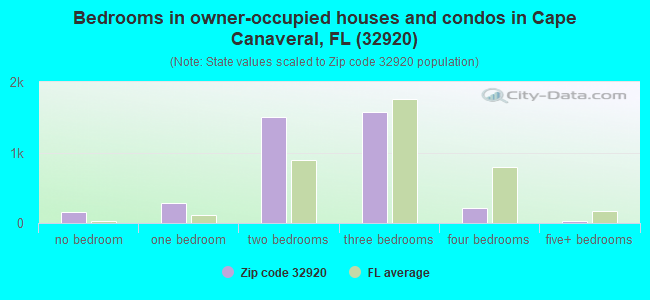
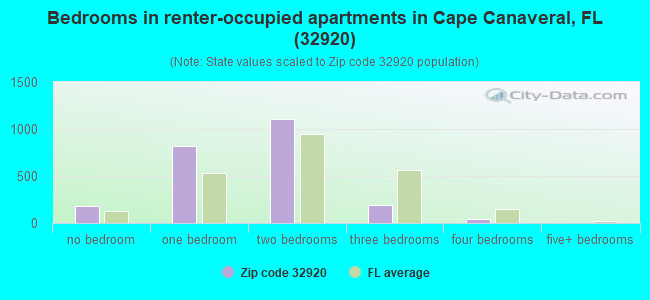
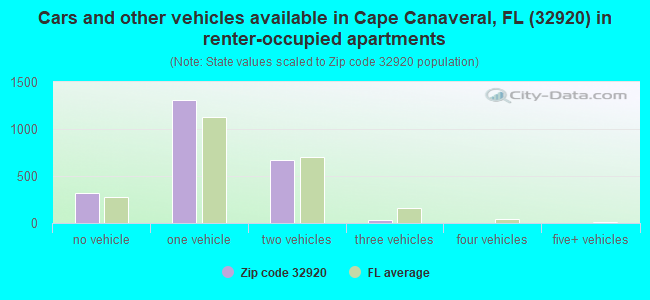
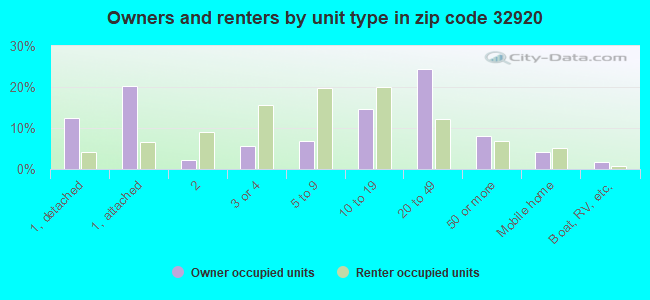
Houses and condos: 9,137 Renter-occupied apartments: 2,321
% of renters here:
38%
State:
33%
March 2022 cost of living index in zip code 32920: 90.4 (less than average, U.S. average is 100)
Land area: 4.1 sq. mi. Water area: 5.7 sq. mi.
Population density: 2,527 people per square mile
(average).
OSM Map
General Map
Google Map
MSN Map
OSM Map
General Map
Google Map
MSN Map
OSM Map
General Map
Google Map
MSN Map
OSM Map
General Map
Google Map
MSN Map
Please wait while loading the map...
Real estate property taxes paid for housing units in 2022:
This zip code:
0.6% ($2,203)
Florida:
0.7% ($2,529)
Median real estate property taxes paid for housing units with mortgages in 2022: $1,928 (0.5%) Median real estate property taxes paid for housing units with no mortgage in 2022: $2,446 (0.6%)
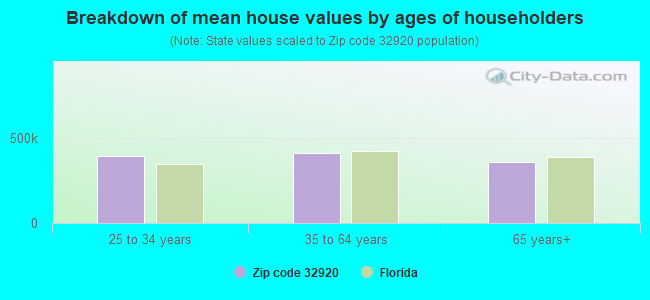
Estimated median house/condo value in 2022: $390,819
32920:
$390,819
Florida:
$354,100
According to our research of Florida and other state lists, there were 4 registered sex offenders living in 32920 zip code as of June 05, 2024. The ratio of all residents to sex offenders in zip code 32920 is 2,540 to 1. The ratio of registered sex offenders to all residents in this zip code is much lower than the state average.
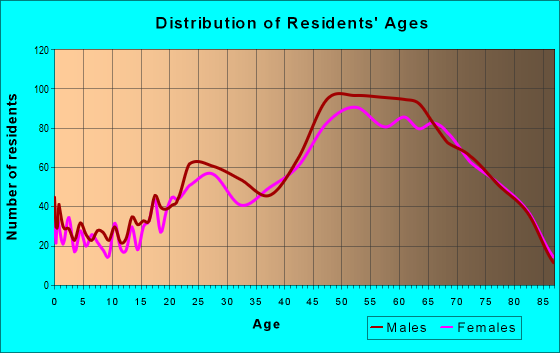
Median resident age:
This zip code:
59.4 years
Florida median age:
42.7 years
Average household size:
This zip code:
1.7 people
Florida:
2.5 people
Averages for the 2020 tax year for zip code 32920, filed in 2021:
Average Adjusted Gross Income (AGI) in 2020: $68,634 (Individual Income Tax Returns)
Here:
$68,634
State:
$82,200
Salary/wage: $52,247 (reported on 67.7% of returns)
Here:
$52,247
State:
$58,347
(% of AGI for various income ranges: 1065.2% for AGIs below $25k, 3217.1% for AGIs $25k-50k, 5420.4% for AGIs $50k-75k, 7532.9% for AGIs $75k-100k, 13435.2% for AGIs $100k-200k, 57133.8% for AGIs over 200k)
Taxable interest for individuals: $2,630 (reported on 36.9% of returns)
This zip code:
$2,630
Florida:
$4,272
(% of AGI for various income ranges: 25.2% for AGIs below $25k, 44.6% for AGIs $25k-50k, 103.8% for AGIs $50k-75k, 152.3% for AGIs $75k-100k, 282.6% for AGIs $100k-200k, 3091.2% for AGIs over 200k)
Ordinary dividends: $8,902 (reported on 26.8% of returns)
Here:
$8,902
State:
$15,863
(% of AGI for various income ranges: 50.8% for AGIs below $25k, 86.5% for AGIs $25k-50k, 224.2% for AGIs $50k-75k, 288.4% for AGIs $75k-100k, 779.5% for AGIs $100k-200k, 8148.8% for AGIs over 200k)
Net capital gain/loss in AGI: +$26,759 (reported on 24.9% of returns)
Here:
+$26,759
State:
+$62,983
(% of AGI for various income ranges: 8.8% for AGIs below $25k, 72.1% for AGIs $25k-50k, 195.6% for AGIs $50k-75k, 356.1% for AGIs $75k-100k, 1153.3% for AGIs $100k-200k, 36541.2% for AGIs over 200k)
Profit/loss from business: +$12,389 (reported on 14.6% of returns)
Here:
+$12,389
State:
+$9,719
(% of AGI for various income ranges: 120.6% for AGIs below $25k, 149.2% for AGIs $25k-50k, 251.0% for AGIs $50k-75k, 411.6% for AGIs $75k-100k, 619.5% for AGIs $100k-200k, 2410.0% for AGIs over 200k)
Taxable individual retirement arrangement distribution: $23,923 (reported on 16.2% of returns)
32920:
$23,923
Florida:
$24,823
(% of AGI for various income ranges: 95.2% for AGIs below $25k, 196.2% for AGIs $25k-50k, 570.2% for AGIs $50k-75k, 947.1% for AGIs $75k-100k, 2095.2% for AGIs $100k-200k, 4897.5% for AGIs over 200k)
Total itemized deductions: $32,858 (reported on 6.8% of returns)
Here:
$32,858
State:
$45,393
(% of AGI for various income ranges: 63.0% for AGIs below $25k, 108.3% for AGIs $25k-50k, 358.5% for AGIs $50k-75k, 402.9% for AGIs $75k-100k, 769.3% for AGIs $100k-200k, 5516.2% for AGIs over 200k)
Charity contributions: $9,834 (reported on 5.2% of returns)
Here:
$9,834
State:
$20,178
(% of AGI for various income ranges: 3.9% for AGIs below $25k, 12.3% for AGIs $25k-50k, 47.7% for AGIs $50k-75k, 56.8% for AGIs $75k-100k, 163.6% for AGIs $100k-200k, 1987.5% for AGIs over 200k)
Taxes paid: $5,611 (reported on 6.8% of returns)
32920:
$5,611
State:
$6,967
(% of AGI for various income ranges: 7.7% for AGIs below $25k, 13.5% for AGIs $25k-50k, 53.3% for AGIs $50k-75k, 69.7% for AGIs $75k-100k, 172.4% for AGIs $100k-200k, 880.0% for AGIs over 200k)
Earned income credit: $1,488 (reported on 12.3% of returns)
Here:
$1,488
State:
$2,306
(% of AGI for various income ranges: 53.6% for AGIs below $25k, 31.8% for AGIs $25k-50k)
Percentage of individuals using paid preparers for their 2020 taxes: 89.5%
Here:
90%
State:
92%
(% for various income ranges: 88.9% for AGIs below $25k, 89.4% for AGIs $25k-50k, 90.7% for AGIs $50k-75k, 92.2% for AGIs $75k-100k, 88.8% for AGIs $100k-200k, 89.3% for AGIs over 200k)
Averages for the 2012 tax year for zip code 32920, filed in 2013:
Average Adjusted Gross Income (AGI) in 2012: $49,658 (Individual Income Tax Returns)
Here:
$49,658
State:
$60,316
Salary/wage: $41,685 (reported on 71.8% of returns)
Here:
$41,685
State:
$45,277
(% of AGI for various income ranges: 66.3% for AGIs below $25k, 68.7% for AGIs $25k-50k, 63.4% for AGIs $50k-75k, 59.7% for AGIs $75k-100k, 59.7% for AGIs $100k-200k, 47.8% for AGIs over 200k)
Taxable interest for individuals: $2,241 (reported on 34.8% of returns)
This zip code:
$2,241
Florida:
$3,587
(% of AGI for various income ranges: 1.7% for AGIs below $25k, 1.2% for AGIs $25k-50k, 1.2% for AGIs $50k-75k, 1.7% for AGIs $75k-100k, 1.3% for AGIs $100k-200k, 2.4% for AGIs over 200k)
Ordinary dividends: $5,342 (reported on 23.4% of returns)
Here:
$5,342
State:
$12,831
(% of AGI for various income ranges: 2.1% for AGIs below $25k, 2.5% for AGIs $25k-50k, 2.1% for AGIs $50k-75k, 2.6% for AGIs $75k-100k, 2.7% for AGIs $100k-200k, 2.7% for AGIs over 200k)
Net capital gain/loss in AGI: +$6,628 (reported on 18.5% of returns)
Here:
+$6,628
State:
+$33,493
(% of AGI for various income ranges: 0.6% for AGIs $25k-50k, 0.8% for AGIs $50k-75k, 1.6% for AGIs $75k-100k, 2.1% for AGIs $100k-200k, 8.3% for AGIs over 200k)
Profit/loss from business: +$11,785 (reported on 15.1% of returns)
Here:
+$11,785
State:
+$10,012
(% of AGI for various income ranges: 12.5% for AGIs below $25k, 2.4% for AGIs $25k-50k, 1.3% for AGIs $50k-75k, 2.1% for AGIs $75k-100k, 2.1% for AGIs $100k-200k, 3.9% for AGIs over 200k)
Taxable individual retirement arrangement distribution: $17,915 (reported on 15.0% of returns)
32920:
$17,915
Florida:
$21,544
(% of AGI for various income ranges: 4.1% for AGIs below $25k, 4.4% for AGIs $25k-50k, 4.9% for AGIs $50k-75k, 6.0% for AGIs $75k-100k, 7.3% for AGIs $100k-200k, 4.6% for AGIs over 200k)
Total itemized deductions: $20,314 (20% of AGI, reported on 22.2% of returns)
Here:
$20,314
State:
$25,533
Here:
19.7% of AGI
State:
18.0% of AGI
(% of AGI for various income ranges: 7.2% for AGIs below $25k, 8.8% for AGIs $25k-50k, 10.7% for AGIs $50k-75k, 10.2% for AGIs $75k-100k, 9.2% for AGIs $100k-200k, 8.5% for AGIs over 200k)
Charity contributions: $3,301 (reported on 18.1% of returns)
Here:
$3,301
State:
$5,698
(% of AGI for various income ranges: 0.6% for AGIs below $25k, 0.7% for AGIs $25k-50k, 1.3% for AGIs $50k-75k, 1.3% for AGIs $75k-100k, 1.5% for AGIs $100k-200k, 1.5% for AGIs over 200k)
Taxes paid: $5,202 (reported on 21.5% of returns)
32920:
$5,202
State:
$6,203
(% of AGI for various income ranges: 1.3% for AGIs below $25k, 1.4% for AGIs $25k-50k, 2.1% for AGIs $50k-75k, 2.2% for AGIs $75k-100k, 2.5% for AGIs $100k-200k, 3.4% for AGIs over 200k)
Earned income credit: $2,015 (reported on 18.7% of returns)
Here:
$2,015
State:
$2,372
(% of AGI for various income ranges: 5.9% for AGIs below $25k, 0.5% for AGIs $25k-50k)
Percentage of individuals using paid preparers for their 2012 taxes: 45.6%
Here:
46%
State:
54%
(% for various income ranges: 39.9% for AGIs below $25k, 46.5% for AGIs $25k-50k, 50.0% for AGIs $50k-75k, 52.4% for AGIs $75k-100k, 54.2% for AGIs $100k-200k, 69.2% for AGIs over 200k)
Averages for the 2004 tax year for zip code 32920, filed in 2005:
Average Adjusted Gross Income (AGI) in 2004: $42,162 (Individual Income Tax Returns)
Here:
$42,162
State:
$50,523
Salary/wage: $33,896 (reported on 78.4% of returns)
Here:
$33,896
State:
$39,563
(% of AGI for various income ranges: 115.6% for AGIs below $10k, 75.5% for AGIs $10k-25k, 73.0% for AGIs $25k-50k, 68.7% for AGIs $50k-75k, 69.7% for AGIs $75k-100k, 45.9% for AGIs over 100k)
Taxable interest for individuals: $2,252 (reported on 43.3% of returns)
This zip code:
$2,252
Florida:
$3,211
(% of AGI for various income ranges: 5.9% for AGIs below $10k, 2.1% for AGIs $10k-25k, 1.7% for AGIs $25k-50k, 2.1% for AGIs $50k-75k, 1.8% for AGIs $75k-100k, 2.8% for AGIs over 100k)
Taxable dividends: $3,115 (reported on 25.4% of returns)
Here:
$3,115
State:
$6,129
(% of AGI for various income ranges: 5.8% for AGIs below $10k, 1.7% for AGIs $10k-25k, 1.6% for AGIs $25k-50k, 1.7% for AGIs $50k-75k, 1.9% for AGIs $75k-100k, 2.0% for AGIs over 100k)
Net capital gain/loss: +$16,770 (reported on 23.0% of returns)
Here:
+$16,770
State:
+$27,205
(% of AGI for various income ranges: -1.0% for AGIs below $10k, -0.3% for AGIs $10k-25k, 1.8% for AGIs $25k-50k, 2.0% for AGIs $50k-75k, 2.8% for AGIs $75k-100k, 22.4% for AGIs over 100k)
Profit/loss from business: +$7,600 (reported on 11.5% of returns)
Here:
+$7,600
State:
+$10,634
(% of AGI for various income ranges: 13.1% for AGIs below $10k, 3.9% for AGIs $10k-25k, 1.4% for AGIs $25k-50k, 1.8% for AGIs $50k-75k, 2.2% for AGIs $75k-100k, 1.4% for AGIs over 100k)
IRA payment deduction: $2,800 (reported on 1.9% of returns)
32920:
$2,800
Florida:
$3,082
(% of AGI for various income ranges: 0.2% for AGIs $10k-25k, 0.2% for AGIs $25k-50k, 0.1% for AGIs $50k-75k, 0.4% for AGIs $75k-100k)
Self-employed pension: $13,467 (reported on 0.3% of returns)
Here:
$13,467
Florida:
$15,857
Total itemized deductions: $17,786 (23% of AGI, reported on 26.2% of returns)
Here:
$17,786
State:
$20,370
Here:
23.2% of AGI
State:
20.7% of AGI
(% of AGI for various income ranges: 14.0% for AGIs below $10k, 8.4% for AGIs $10k-25k, 10.2% for AGIs $25k-50k, 11.8% for AGIs $50k-75k, 13.1% for AGIs $75k-100k, 11.2% for AGIs over 100k)
Charity contributions deductions: $2,771 (3% of AGI, reported on 22.2% of returns)
Here:
$2,771
State:
$4,064
Here:
3.5% of AGI
State:
3.8% of AGI
(% of AGI for various income ranges: 0.7% for AGIs below $10k, 0.7% for AGIs $10k-25k, 1.1% for AGIs $25k-50k, 1.4% for AGIs $50k-75k, 1.7% for AGIs $75k-100k, 1.9% for AGIs over 100k)
Total tax: $6,680 (reported on 78.5% of returns)
32920:
$6,680
State:
$9,431
(% of AGI for various income ranges: 3.8% for AGIs below $10k, 4.6% for AGIs $10k-25k, 8.2% for AGIs $25k-50k, 11.3% for AGIs $50k-75k, 12.7% for AGIs $75k-100k, 18.3% for AGIs over 100k)
Earned income credit: $1,228 (reported on 14.1% of returns)
Here:
$1,228
State:
$1,808
Percentage of individuals using paid preparers for their 2004 taxes: 54.6%
Here:
55%
State:
60%
(% for various income ranges: 53.5% for AGIs below $10k, 53.3% for AGIs $10k-25k, 53.0% for AGIs $25k-50k, 56.8% for AGIs $50k-75k, 53.5% for AGIs $75k-100k, 64.8% for AGIs over 100k)
Likely homosexual households (counted as self-reported same-sex unmarried-partner households)
Lesbian couples: 0.2% of all households
Gay men: 0.0% of all households
Household received Food Stamps/SNAP in the past 12 months: 633 Household did not receive Food Stamps/SNAP in the past 12 months: 5,465
Women who had a birth in the past 12 months: 15 (9 now married, 5 unmarried) Women who did not have a birth in the past 12 months: 1,108 (401 now married, 706 unmarried)
Housing units in zip code 32920 with a mortgage: 1,458 (136 second mortgage, 52 home equity loan, 60 both second mortgage and home equity loan) Median monthly owner costs for units with a mortgage: $1,647 Median monthly owner costs for units without a mortgage: $734
Residents with income below the poverty level in 2022:
This zip code:
8.4%
Whole state:
12.7%
Residents with income below 50% of the poverty level in 2022:
This zip code:
4.0%
Whole state:
6.6%
Median number of rooms in houses and condos:
Here:
5.0
State:
5.9
Median number of rooms in apartments:
Here:
3.7
State:
4.2
Notable locations in this zip code not listed on our city pages
Notable locations in zip code 32920: Bluepoints International Fisheries East Wharf (A), Cape Canaveral Wastewater Treatment Plant (B), United States Coast Guard Station Port Canaveral Wharf (C), Sunrise Marina Piers and Mooring Wharf (D), Sun Cruz Casino Wharf (E), Port Canaveral Maintenance and Fabrication Wharf (F), New Port Marina Pier (G), Fleet Marine Wharf (H), Canaveral Port Authority South Cargo Piers 1 and 2 and 3 (I), Canaveral Port Authority Dolphin Road Mooring Wharf (J), Canaveral Port Authority Cruise Terminals Numbers 2 and 3 Wharf (K), Canaveral Port Authority Cruise Terminals Number 9 (L), Canaveral Port Authority Cruise Terminal Number 8 Wharf (M), Canaveral Port Authority Cruise Terminal Number 5 Wharf (N), Canaveral Port Authority Cruise Terminal Number 10 (O), Bluepoints International Fisheries West Wharf (P), Brevard County Fire Rescue Station 60 (Q), Cape Canaveral Volunteer Fire Department Station 52 (R), Cape Canaveral Police Department (S), Cape Canaveral Volunteer Fire Department Station 53 (T). Display/hide their locations on the map
In group quarters: 6 (-1 institutionalized population)
Size of family households: 1,970 2-persons, 418 3-persons, 201 4-persons, 15 6-persons, 8 7-or-more-persons
Size of nonfamily households: 2,994 1-person, 459 2-persons, 21 3-persons
161 married couples with children.
407 single-parent households (129 men, 278 women).
90.8% of residents of 32920 zip code speak English at home.
3.3% of residents speak Spanish at home (61% very well, 31% well, 8% not well).
5.1% of residents speak other Indo-European language at home (58% very well, 39% well, 3% not well).
0.8% of residents speak Asian or Pacific Island language at home (54% very well, 17% well, 29% not well).
0.1% of residents speak other language at home (100% very well).
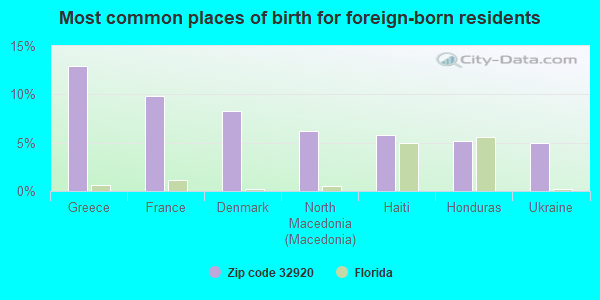
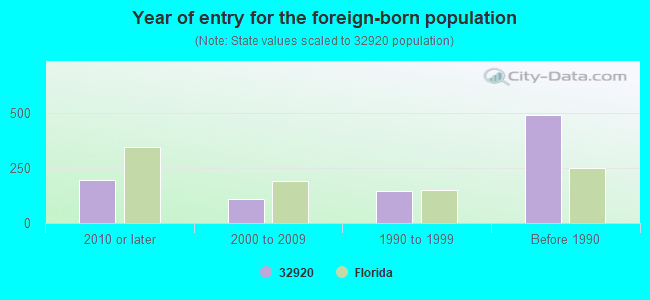
Foreign born population: 739 (7.2%) (65.3% of them are naturalized citizens)
This zip code:
7.2%
Whole state:
21.7%
13%Greece
10%France
8%Denmark
6%North Macedonia (Macedonia)
6%Haiti
5%Honduras
5%Ukraine
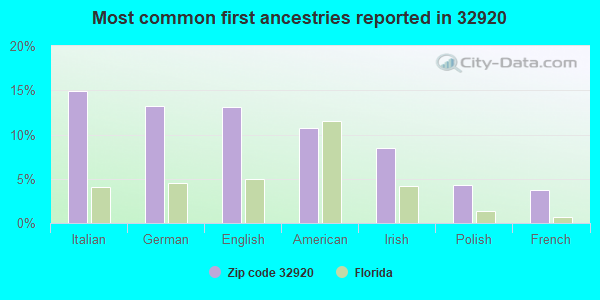
15%Italian
13%German
13%English
11%American
8%Irish
4%Polish
4%French
Year of entry for the foreign-born population
1962010 or later
1072000 to 2009
1471990 to 1999
491Before 1990
Major facilities with environmental interests located in this zip code:
MORTON INTERNATIONAL (450 CARGO ROAD in PORT CANAVERAL, FL)
AIR MINOR (AIRS/AFS) CRITERIA AND HAZARDOUS AIR POLLUTANT INVENTORY (Inventory of air pollution sources) National Pollutant Discharge Elimination System NON-MAJOR (Tracking pollutant discharge elimination systems) - permit (Resource Conservation and Recovery Act (tracking hazardous waste)) Business SIC classification: MISCELLANEOUS NONMETALLIC MINERALS, EXCEPT FUELS; CHEMICALS AND ALLIED PRODUCTS Organizations: MICHAEL MARKLEY (CONTACT/OWNER)
, ROBERT BERISH (CONTACT/OWNER)
Alternative names: MORTON INTERNATIONAL MORT SALT, MORTON SALT PORT CANAVERAL, MORTON SALT PORT CANAVERAL FACILITY
NEWPORT MARINA (960 MULLET RD in CAPE CANAVERAL, FL)
(Integrated Compliance Information System) - ICIS-04-2001-0077, FORMAL ENFORCEMENT ACTION National Pollutant Discharge Elimination System NON-MAJOR (Tracking pollutant discharge elimination systems) - permit Business SIC classification: MARINAS Organizations: WILLIAM O'CONNELL (CONTACT/OWNER)
Alternative names: NEW PORT MARINA
CITY OF CAPE CANAVERAL WASTEWATER TREATMENT PLANT (600 TOWER ROAD in CAPE CANAVERAL, FL)
(Integrated Compliance Information System) - ICIS-04-1990-0142, FORMAL ENFORCEMENT ACTION National Pollutant Discharge Elimination System MAJOR (Tracking pollutant discharge elimination systems) - permit Business SIC classification: SEWERAGE SYSTEMS Organizations: ED GARDULSKI (CONTACT/OWNER)
Alternative names: CAPE CANAVERAL WWTP
KMD SHIP REPAIR (8708 COMMERS ST in CAPE CANAVERAL, FL)
(Integrated Compliance Information System) - ICIS-04-1998-0258, FORMAL ENFORCEMENT ACTION Small Quantity Generators, between 100 kg and 1000 kg of hazardous waste/month (Resource Conservation and Recovery Act (tracking hazardous waste)) - notification Business SIC classification: BOAT BUILDING AND REPAIRING Organizations: KRIS HEITCMEN, VP (CONTACT/OWNER)
IMPERIAL RESEARCH & MFG (192 CENTER ST in CAPE CANAVERAL, FL)
(Integrated Compliance Information System) - ICIS-04-1998-0381, FORMAL ENFORCEMENT ACTION COMPLIANCE ACTIVITY (Tracking inspections of insecticide, fungicide, and rodenticide, and toxic substances) Business SIC classification: CHEMICALS AND CHEMICAL PREPARATIONS; SURGICAL AND MEDICAL INSTRUMENTS AND APPARATUS
COASTAL FUELS MARKETING INC CAPE CANAVERAL TERMINAL (8954 N. ATLANTIC AVE. in CAPE CANAVERAL, FL)
AIR MAJOR (AIRS/AFS) OIL CONTROL (Facility Response Plan for oil discharge) CRITERIA AND HAZARDOUS AIR POLLUTANT INVENTORY (Inventory of air pollution sources) (Resource Conservation and Recovery Act (tracking hazardous waste)) TRI REPORTER (Tracking of toxic chemicals releasing facilities) Business SIC classification: SPECIAL WAREHOUSING AND STORAGE; PETROLEUM BULK STATIONS AND TERMINALS Organizations: COASTAL FUELS MARKETING, INC. (CONTACT/GENERAL)
, TRANSMONTAIGNE PRODUCT SERVICES INC (CONTACT/OWNER)
Alternative names: CAPE CANAVERAL TERMINAL , COASTAL FUELS MARKETING , COASTAL FUELS MARKETING INC. - CAPE CANAVERAL TERMINAL
CIRCLE K #4971 (7700 N ATLANTIC AVE in CAPE CANAVERAL, FL)
National Pollutant Discharge Elimination System NON-MAJOR (Tracking pollutant discharge elimination systems) - permit (Resource Conservation and Recovery Act (tracking hazardous waste)) Organizations: STEVE BELIN, COMPLIANCE MGR (CONTACT/OWNER)
, DARYL GOTTILLA (CONTACT/OWNER)
PORT CANAVERAL TERMINAL (9035 FLOUNDER AVE in CAPE CANAVERAL, FL)
OIL CONTROL (Facility Response Plan for oil discharge) (Resource Conservation and Recovery Act (tracking hazardous waste)) Organizations: FLORIDA POWER AND LIGHT COMPAN (CONTACT/GENERAL)
, CHARLES HENDERSON (CONTACT/OWNER)
Alternative names: FPL PORT CANAVERAL TERMINAL
MID-FLORIDA FREEZER WAREHOUSE (9012 HERRING STREET in CAPE CANAVERAL, FL)
National Pollutant Discharge Elimination System NON-MAJOR (Tracking pollutant discharge elimination systems) - permit Small Quantity Generators, between 100 kg and 1000 kg of hazardous waste/month (Resource Conservation and Recovery Act (tracking hazardous waste)) Business SIC classification: REFRIGERATED WAREHOUSING AND STORAGE Organizations: PETER REID (CONTACT/OWNER)
, PAUL CHRISTIAN (CONTACT/OWNER)
Alternative names: MID FLORIDA FREEZER WAREHOUSES LIMITED, MID FLORIDA FREEZERS
ATLANTIC INDUSTRIAL SERVICES I (8985 COLUMBIA RD in CAPE CANAVERAL, FL)
National Pollutant Discharge Elimination System NON-MAJOR (Tracking pollutant discharge elimination systems) - permit USED OIL PROGRAM (Resource Conservation and Recovery Act (tracking hazardous waste)) Organizations: BRIAN DICK (CONTACT/OWNER)
, RUNYAN & ROGER (CONTACT/OWNER)
Alternative names: ATLANTIC INDUSTRIAL SVC INC
LOCKHEED MARTIN (ASOC/BUILDING 75251 in CAPE CANAVERAL, FL) . Federal Facility
HAZARDOUS WASTE BIENNIAL REPORTER (Resource Conservation and Recovery Act (tracking hazardous waste)) Large Quantity Generators, more that 1000 kg of hazardous waste/month (Resource Conservation and Recovery Act (tracking hazardous waste)) - notification Business NAICS classification: GUIDED MISSILE AND SPACE VEHICLE MANUFACTURING. Organizations: UNITED STATES AIR FORCE (CONTACT/OWNER)
Alternative names: LOCKHEED MARTIN ASTRONAUTICS
BOEING CCAFS DELTA IV PROGRAM (BEACH ROAD in CAPE CANAVERAL, FL) . Federal Facility. U.S. AIR FORCE
HAZARDOUS WASTE BIENNIAL REPORTER (Resource Conservation and Recovery Act (tracking hazardous waste)) Large Quantity Generators, more that 1000 kg of hazardous waste/month (Resource Conservation and Recovery Act (tracking hazardous waste)) Organizations: THE BOEING COMPANY (CONTACT/OPERATOR)
, UNITED STATES AIR FORCE (CONTACT/OWNER)
Alternative names: BOEING DELTA IV PROGRAM
Housing units lacking complete plumbing facilities: 0.5% Housing units lacking complete kitchen facilities: 1.0%
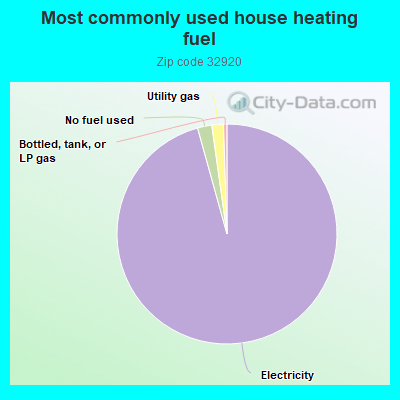
95.6%Electricity
2.1%No fuel used
1.7%Utility gas
0.5%Bottled, tank, or LP gas
Population in 1990: 7,655. Population change in the 1990s: +1,381 (+18.0%).
Place of birth for U.S.-born residents:
This state: 1,627
Northeast: 3,554
Midwest: 1,914
South: 1,601
West: 582
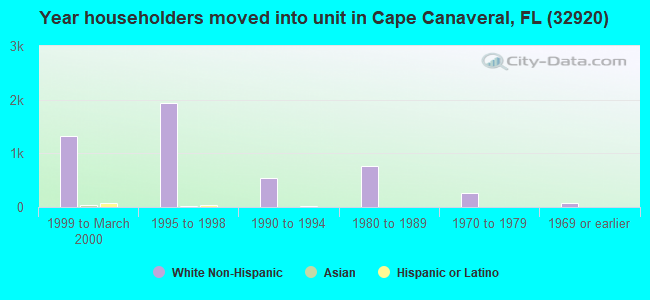
38% of the 32920 zip code residents lived in the same house 5 years ago. Out of people who lived in different houses, 52% lived in this county. Out of people who lived in different counties, 50% lived in Florida.
87% of the 32920 zip code residents lived in the same house 1 year ago. Out of people who lived in different houses, 56% moved from this county. Out of people who lived in different houses, 12% moved from different county within same state. Out of people who lived in different houses, 27% moved from different state. Out of people who lived in different houses, 1% moved from abroad.
Private vs. public school enrollment:
Students in private schools in grades 1 to 8 (elementary and middle school):
Here:
0.0%
Florida:
15.8%
Students in private schools in grades 9 to 12 (high school): 12
Here:
6.8%
Florida:
12.9%
Students in private undergraduate colleges: 70
Here:
34.4%
Florida:
23.6%
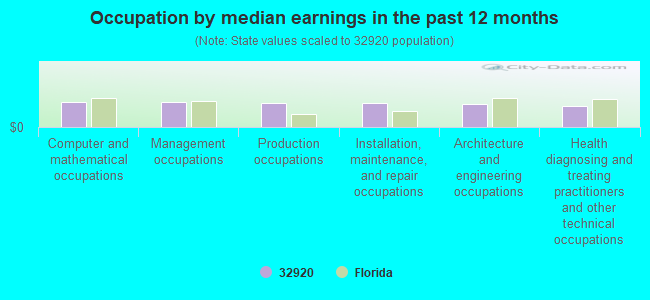
Occupation by median earnings in the past 12 months ($)
87,472Computer and mathematical occupations
84,875Management occupations
83,809Production occupations
82,517Installation, maintenance, and repair occupations
79,277Architecture and engineering occupations
70,990Health diagnosing and treating practitioners and other technical occupations
Companies with biggest federal contracts located in this zip code (CAPE CANAVERAL, FL):
ITT INDUSTRIES, INC , SYSTEMS (7001 N ATLANTIC AVENUE, S) : $315,349,949 in 156 contractsfrom 2002 to 2005
Contracts for Engineering and Technical Services, Defense Missile and Space Systems -- Management and Support (R&D), Space Operations (Tracking and Data Acquisition) -- Management and Support (R&D) by Air Force Signed by year:2000: $0; 2001: $0; 2002: $79,584,691; 2003: $132,870,212; 2004: $92,171,266; 2005: $10,723,780; 2006: $0.
Biggest contracts:
$25,258,773 with Air Force for Engineering and Technical Services. Signed on 2003-03-04. Completion date: 2006-10-31.
$22,917,922 with Air Force for Defense Missile and Space Systems -- Management and Support (R&D). Signed on 2002-08-26. Completion date: 2006-10-31.
$14,252,049, same as above.Signed on 2004-05-20. Completion date: 2006-10-31.
$11,495,250 with Air Force for Defense Missile and Space Systems -- Management and Support (R&D). Taking place in CO. Signed on 2002-05-31. Completion date: 2006-10-31.
3PSC LLC (405 ATLANTIS RD; small business) : $78,613,593 in 41 contractsfrom 2002 to 2006
Contracts for Marine Charter for Things, Operation of Government-Owned Facilities -- Other Non-Building Facilities by Navy Signed by year:2000: $0; 2001: $0; 2002: $9,962,647; 2003: $12,055,226; 2004: $11,635,680; 2005: $30,492,624; 2006: $14,467,416.
Biggest contracts:
$10,956,995 with Navy for Marine Charter for Things. Signed on 2005-10-17. Completion date: 2006-01-31.
$10,490,427 with Navy for Marine Charter for Things. Taking place in VA. Signed on 2003-10-23. Completion date: 2006-01-31.
$10,175,825, same as above.Signed on 2004-10-04. Completion date: 2006-01-31.
$9,962,647 with Navy for Operation of Government-Owned Facilities -- Other Non-Building Facilities. Taking place in VA. Signed on 2002-11-20. Completion date: 2006-01-31.
JOHNSON CONTROLS-HILL, L L C (7315 N ATLANTIC AVENUE) : $45,005,693 in 262 contractsfrom 2002 to 2006
Contracts for Facilities Operations Support Services, ADP Backup and Security Services, Maintenance, Repair or Alteration of Real Property -- Miscellaneous Buildings, Maintenance, Repair and Rebuilding of Equipment -- Alarm, Signal, and Security Detection Systems, and moreby Navy, Smithsonian Institution, except units administered under separate Board of Trustees, Defense Logistics Agency, Department of State, and others Signed by year:2000: $0; 2001: $0; 2002: $81,890; 2003: $29,290,296; 2004: $10,517,134; 2005: $4,937,986; 2006: $178,387.
Biggest contracts:
$16,195,757 with Navy for Facilities Operations Support Services. Signed on 2003-11-13. Completion date: 2010-09-30.
$8,912,597, same as above.Signed on 2003-11-20. Completion date: 2004-09-30.
$3,737,356, same as above.Signed on 2004-03-31. Completion date: 2010-09-30.
$1,265,431, same as above.Signed on 2003-12-09. Completion date: 2010-09-30.
VIDEO DISPLAY CORPORATION (7177 N ATLANTIC AVE; small business) : $8,008,553 in 67 contractsfrom 2000 to 2006
Contracts for Radio and Television Communication Equipment, Except Airborne, Miscellaneous Electrical and Electronic Components, ADP Support Equipment, Photographic Projection Equipment, and moreby Navy Signed by year:2000: $2,882,821; 2001: $1,915,035; 2002: $297,371; 2003: $381,621; 2004: $2,004,200; 2005: $386,293; 2006: $141,212.
Biggest contracts:
$2,464,645 with Navy for Radio and Television Communication Equipment, Except Airborne. Signed on 2000-06-13. Completion date: 2002-01-30.
$1,169,720, same as above.Signed on 2004-08-27. Completion date: 2006-09-30.
$671,871, same as above.Signed on 2001-04-02. Completion date: 2002-09-30.
$532,868, same as above.Signed on 2001-12-07. Completion date: 2002-06-30.
AMBASSADOR SERVICES, INC (245 CHALLENGER ROAD; small business) : $2,706,683 in 16 contractsfrom 2000 to 2005
Contracts for Stevedoring, Other Cargo and Freight Services by Army Signed by year:2000: $257,311; 2001: $330,000; 2002: $753,100; 2003: -$10,900; 2004: $540,000; 2005: $837,172; 2006: $0.
Biggest contracts:
$767,072 with Army for Stevedoring. Signed on 2005-05-16. Completion date: 2009-04-30.
$690,000, same as above.Signed on 2002-04-25. Completion date: 2004-04-30.
$298,687, same as above.Signed on 2003-06-09. Completion date: 2004-04-30.
$257,311 with Army for Other Cargo and Freight Services. Signed on 2000-12-29. Completion date: 2002-01-31.
EXCELL COATINGS, INC (745 SCALLOP DRIVE; small business) : $615,760 in 12 contractsfrom 2001 to 2005
Contracts for Maintenance, Repair and Rebuilding of Equipment -- Vehicular Equipment Components by Army Signed by year:2000: $0; 2001: $42,835; 2002: $79,647; 2003: $1,000; 2004: $487,478; 2005: $4,800; 2006: $0.
Biggest contracts:
$240,895 with Army for Maintenance, Repair and Rebuilding of Equipment -- Vehicular Equipment Components. Signed on 2004-09-30. Completion date: 2004-12-30.
$91,360, same as above.Signed on 2004-09-21. Completion date: 2004-12-30.
$62,350, same as above.Signed on 2004-07-08. Completion date: 2004-09-30.
$51,433, same as above.Signed on 2004-08-10. Completion date: 2004-09-30.
JOHNSON CONTROLS WORLD SERVICE (7315 N ATLANTIC AVE) : $368,321 in 2 contractsfrom 1999 to 2006
$369,000 with Air Force for Facilities Operations Support Services. Signed on 1999-12-10. Completion date: 2001-02-03.
-$679, same as above.Signed on 2006-01-25. Completion date: 2002-03-18.
AUTEC RANGE SERVICES (7315 NORTH ATLANTIC AVENUE; small business)
$300,000 with Navy for Defense Electronics and Communication Equipment -- Operational Systems Development (R&D). Signed on 2003-09-24. Completion date: 2004-09-30.
SEABULK INTERNATIONAL, INC (737 SNAPPER ROAD; small business) : $127,793 in 2 contractsin 2004
$142,457 with Navy for Marine Charter for Things. Signed on 2004-03-17. Completion date: 2004-04-17.
-$14,664 with Navy for Motor Pool Operations. Signed on 2004-03-30. Completion date: 2004-04-07.
RC TECH (191 CENTER STREET; small business)
$107,100 with Air Force for Other Administrative Support Services. Signed on 2005-10-04. Completion date: 2006-09-30.
Top industries in this zip code by the number of employees in 2005:
Administrative and Support and Waste Management and Remediation Services: Facilities Support Services (500-999 employees: 1 establishment, 50-99 employees: 1 establishment, 20-49 employees: 3 establishments, 5-9 employees: 2 establishments)
Administrative and Support and Waste Management and Remediation Services: Temporary Help Services (250-499: 2, 10-19: 1, 5-9: 1)
Arts, Entertainment, and Recreation: Casinos (except Casino Hotels) (250-499: 2)
Accommodation and Food Services: Hotels (except Casino Hotels) and Motels (250-499: 1, 100-249: 1, 5-9: 1)
Professional, Scientific, and Technical Services: Research and Development in the Physical, Engineering, and Life Sciences (100-249: 1, 50-99: 1, 10-19: 1)
Administrative and Support and Waste Management and Remediation Services: Travel Agencies (100-249: 1, 5-9: 1, 1-4: 1)
Health Care and Social Assistance: Offices of Physicians (except Mental Health Specialists) (100-249: 1, 5-9: 1)
People in group quarters in 2010:
7 people in maritime/merchant vessels
People in group quarters in 2000:
2 people in military barracks, etc.
Fatal accident statistics in 2012:
Fatal accident count: 1
Vehicles involved in fatal accidents: 1
Fatal accidents caused by drunken drivers: 0
Fatalities: 1
Persons involved in fatal accidents: 1
Pedestrians involved in fatal accidents: 1
Fatal accident statistics in 2011:
Fatal accident count: 3
Vehicles involved in fatal accidents: 3
Fatal accidents caused by drunken drivers: 2
Fatalities: 3
Persons involved in fatal accidents: 8
Pedestrians involved in fatal accidents: 1
Home Mortgage Disclosure Act Aggregated Statistics For Year 2009 (Based on 4 partial tracts)
A) FHA, FSA/RHS & VA Home Purchase Loans
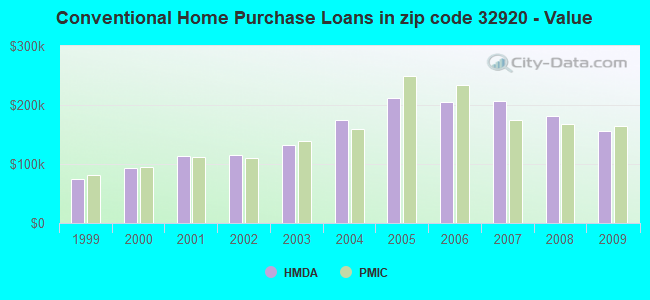
B) Conventional Home Purchase Loans
C) Refinancings
D) Home Improvement Loans
F) Non-occupant Loans on < 5 Family Dwellings (A B C & D)
Number
Average Value
Number
Average Value
Number
Average Value
Number
Average Value
Number
Average Value
LOANS ORIGINATED
15
$155,170
66
$155,945
64
$161,712
2
$31,930
54
$169,611
APPLICATIONS APPROVED, NOT ACCEPTED
0
$0
9
$184,022
9
$226,724
0
$0
6
$255,158
APPLICATIONS DENIED
2
$121,260
10
$199,169
86
$194,143
2
$5,575
32
$196,058
APPLICATIONS WITHDRAWN
4
$167,408
5
$157,390
33
$181,245
0
$0
13
$192,002
FILES CLOSED FOR INCOMPLETENESS
0
$0
2
$98,035
7
$258,159
0
$0
3
$91,953
Aggregated Statistics For Year 2008 (Based on 4 partial tracts)
A) FHA, FSA/RHS & VA Home Purchase Loans
B) Conventional Home Purchase Loans
C) Refinancings
D) Home Improvement Loans
F) Non-occupant Loans on < 5 Family Dwellings (A B C & D)
Number
Average Value
Number
Average Value
Number
Average Value
Number
Average Value
Number
Average Value
LOANS ORIGINATED
7
$148,294
90
$181,130
55
$197,934
6
$141,268
75
$191,728
APPLICATIONS APPROVED, NOT ACCEPTED
1
$240,380
14
$161,904
23
$173,643
0
$0
16
$181,294
APPLICATIONS DENIED
1
$252,500
11
$214,982
79
$256,269
4
$77,528
45
$285,162
APPLICATIONS WITHDRAWN
2
$105,545
7
$126,007
35
$213,481
2
$236,035
17
$207,475
FILES CLOSED FOR INCOMPLETENESS
0
$0
10
$162,582
8
$168,774
1
$30,300
8
$164,218
Aggregated Statistics For Year 2007 (Based on 4 partial tracts)
A) FHA, FSA/RHS & VA Home Purchase Loans
B) Conventional Home Purchase Loans
C) Refinancings
D) Home Improvement Loans
E) Loans on Dwellings For 5+ Families
F) Non-occupant Loans on < 5 Family Dwellings (A B C & D)
G) Loans On Manufactured Home Dwelling (A B C & D)
Number
Average Value
Number
Average Value
Number
Average Value
Number
Average Value
Number
Average Value
Number
Average Value
Number
Average Value
LOANS ORIGINATED
5
$154,530
182
$206,336
133
$187,110
12
$171,704
0
$0
174
$209,009
0
$0
APPLICATIONS APPROVED, NOT ACCEPTED
0
$0
23
$172,425
40
$193,255
1
$126,250
0
$0
24
$192,180
0
$0
APPLICATIONS DENIED
1
$185,840
47
$218,685
87
$210,474
9
$137,868
2
$5,485,985
54
$213,578
3
$42,520
APPLICATIONS WITHDRAWN
0
$0
15
$526,262
44
$256,243
3
$161,140
0
$0
31
$472,815
0
$0
FILES CLOSED FOR INCOMPLETENESS
0
$0
7
$265,437
15
$237,322
1
$116,150
0
$0
13
$247,652
0
$0
Aggregated Statistics For Year 2006 (Based on 4 partial tracts)
B) Conventional Home Purchase Loans
C) Refinancings
D) Home Improvement Loans
E) Loans on Dwellings For 5+ Families
F) Non-occupant Loans on < 5 Family Dwellings (A B C & D)
G) Loans On Manufactured Home Dwelling (A B C & D)
Number
Average Value
Number
Average Value
Number
Average Value
Number
Average Value
Number
Average Value
Number
Average Value
LOANS ORIGINATED
401
$204,791
193
$193,986
19
$80,761
4
$403,905
309
$197,232
0
$0
APPLICATIONS APPROVED, NOT ACCEPTED
45
$161,912
47
$183,649
5
$47,050
0
$0
40
$181,786
0
$0
APPLICATIONS DENIED
89
$189,122
102
$191,699
10
$65,536
0
$0
81
$208,887
3
$30,050
APPLICATIONS WITHDRAWN
43
$201,344
64
$194,595
7
$108,116
0
$0
41
$188,209
0
$0
FILES CLOSED FOR INCOMPLETENESS
14
$249,744
16
$165,727
0
$0
0
$0
6
$189,335
0
$0
Aggregated Statistics For Year 2005 (Based on 4 partial tracts)
A) FHA, FSA/RHS & VA Home Purchase Loans
B) Conventional Home Purchase Loans
C) Refinancings
D) Home Improvement Loans
E) Loans on Dwellings For 5+ Families
F) Non-occupant Loans on < 5 Family Dwellings (A B C & D)
G) Loans On Manufactured Home Dwelling (A B C & D)
Number
Average Value
Number
Average Value
Number
Average Value
Number
Average Value
Number
Average Value
Number
Average Value
Number
Average Value
LOANS ORIGINATED
0
$0
483
$212,176
203
$165,525
19
$84,775
6
$2,763,490
353
$207,150
0
$0
APPLICATIONS APPROVED, NOT ACCEPTED
0
$0
42
$226,257
28
$136,474
2
$107,490
0
$0
28
$245,918
0
$0
APPLICATIONS DENIED
0
$0
82
$206,756
70
$152,492
10
$41,554
0
$0
67
$199,463
3
$52,020
APPLICATIONS WITHDRAWN
2
$116,655
43
$228,409
57
$152,269
7
$138,786
0
$0
36
$201,802
0
$0
FILES CLOSED FOR INCOMPLETENESS
0
$0
17
$198,429
17
$197,318
1
$50,500
0
$0
17
$196,066
0
$0
Aggregated Statistics For Year 2004 (Based on 4 partial tracts)
A) FHA, FSA/RHS & VA Home Purchase Loans
B) Conventional Home Purchase Loans
C) Refinancings
D) Home Improvement Loans
E) Loans on Dwellings For 5+ Families
F) Non-occupant Loans on < 5 Family Dwellings (A B C & D)
G) Loans On Manufactured Home Dwelling (A B C & D)
Number
Average Value
Number
Average Value
Number
Average Value
Number
Average Value
Number
Average Value
Number
Average Value
Number
Average Value
LOANS ORIGINATED
3
$114,120
401
$173,880
207
$131,423
20
$80,346
2
$1,397,680
292
$162,730
0
$0
APPLICATIONS APPROVED, NOT ACCEPTED
0
$0
31
$173,216
23
$148,732
3
$64,310
0
$0
19
$197,800
0
$0
APPLICATIONS DENIED
2
$73,225
56
$168,070
68
$123,199
6
$67,130
0
$0
37
$164,782
3
$34,667
APPLICATIONS WITHDRAWN
0
$0
40
$214,028
76
$125,293
4
$200,755
0
$0
32
$156,938
0
$0
FILES CLOSED FOR INCOMPLETENESS
0
$0
19
$239,936
17
$118,639
1
$355,960
0
$0
11
$257,022
0
$0
Aggregated Statistics For Year 2003 (Based on 4 partial tracts)
A) FHA, FSA/RHS & VA Home Purchase Loans
B) Conventional Home Purchase Loans
C) Refinancings
D) Home Improvement Loans
E) Loans on Dwellings For 5+ Families
F) Non-occupant Loans on < 5 Family Dwellings (A B C & D)
Number
Average Value
Number
Average Value
Number
Average Value
Number
Average Value
Number
Average Value
Number
Average Value
LOANS ORIGINATED
7
$154,347
391
$132,692
420
$112,146
6
$29,183
1
$619,870
309
$123,570
APPLICATIONS APPROVED, NOT ACCEPTED
1
$120,190
31
$135,190
48
$98,281
2
$101,000
0
$0
24
$110,817
APPLICATIONS DENIED
0
$0
38
$135,847
102
$104,002
10
$36,548
0
$0
39
$110,654
APPLICATIONS WITHDRAWN
0
$0
55
$141,305
87
$106,900
0
$0
0
$0
34
$146,929
FILES CLOSED FOR INCOMPLETENESS
0
$0
9
$162,694
14
$123,754
0
$0
0
$0
5
$130,954
Aggregated Statistics For Year 2002 (Based on 4 partial tracts)
A) FHA, FSA/RHS & VA Home Purchase Loans
B) Conventional Home Purchase Loans
C) Refinancings
D) Home Improvement Loans
E) Loans on Dwellings For 5+ Families
F) Non-occupant Loans on < 5 Family Dwellings (A B C & D)
Number
Average Value
Number
Average Value
Number
Average Value
Number
Average Value
Number
Average Value
Number
Average Value
LOANS ORIGINATED
8
$107,392
286
$115,568
263
$97,348
3
$37,427
1
$238,680
199
$103,649
APPLICATIONS APPROVED, NOT ACCEPTED
0
$0
19
$98,298
29
$81,728
2
$22,530
0
$0
19
$100,032
APPLICATIONS DENIED
0
$0
27
$114,026
54
$97,647
10
$30,685
1
$419,800
19
$105,348
APPLICATIONS WITHDRAWN
0
$0
25
$126,155
55
$97,921
2
$29,970
0
$0
17
$117,763
FILES CLOSED FOR INCOMPLETENESS
0
$0
8
$98,150
11
$104,719
0
$0
0
$0
6
$80,545
Aggregated Statistics For Year 2001 (Based on 4 partial tracts)
A) FHA, FSA/RHS & VA Home Purchase Loans
B) Conventional Home Purchase Loans
C) Refinancings
D) Home Improvement Loans
F) Non-occupant Loans on < 5 Family Dwellings (A B C & D)
Number
Average Value
Number
Average Value
Number
Average Value
Number
Average Value
Number
Average Value
LOANS ORIGINATED
20
$94,554
292
$113,764
144
$97,745
7
$20,471
152
$99,840
APPLICATIONS APPROVED, NOT ACCEPTED
2
$93,145
26
$92,361
19
$90,603
2
$34,510
15
$104,373
APPLICATIONS DENIED
2
$57,175
34
$72,484
55
$71,525
12
$15,857
18
$61,449
APPLICATIONS WITHDRAWN
4
$103,342
31
$127,985
45
$73,620
1
$86,420
18
$87,446
FILES CLOSED FOR INCOMPLETENESS
2
$71,710
10
$101,554
6
$89,042
0
$0
7
$110,107
Aggregated Statistics For Year 2000 (Based on 4 partial tracts)
A) FHA, FSA/RHS & VA Home Purchase Loans
B) Conventional Home Purchase Loans
C) Refinancings
D) Home Improvement Loans
E) Loans on Dwellings For 5+ Families
F) Non-occupant Loans on < 5 Family Dwellings (A B C & D)
Number
Average Value
Number
Average Value
Number
Average Value
Number
Average Value
Number
Average Value
Number
Average Value
LOANS ORIGINATED
27
$73,097
195
$93,635
36
$65,894
7
$26,149
4
$25,250
75
$84,768
APPLICATIONS APPROVED, NOT ACCEPTED
2
$75,300
15
$106,447
10
$61,625
4
$12,008
0
$0
2
$159,165
APPLICATIONS DENIED
2
$60,955
30
$45,900
38
$47,745
6
$20,645
0
$0
8
$69,716
APPLICATIONS WITHDRAWN
2
$78,780
19
$98,777
27
$49,468
2
$22,255
0
$0
2
$38,385
FILES CLOSED FOR INCOMPLETENESS
0
$0
4
$93,482
3
$74,143
0
$0
0
$0
2
$135,010
Aggregated Statistics For Year 1999 (Based on 2 partial tracts)
A) FHA, FSA/RHS & VA Home Purchase Loans
B) Conventional Home Purchase Loans
C) Refinancings
D) Home Improvement Loans
E) Loans on Dwellings For 5+ Families
F) Non-occupant Loans on < 5 Family Dwellings (A B C & D)
Detailed PMIC statistics for the following Tracts:0685.00
, 0686.00
2002 - 2018 National Fire Incident Reporting System (NFIRS) incidents
Based on the data from the years 2002 - 2018 the average number of fire incidents per year is 48. The highest number of reported fire incidents - 74 took place in 2004, and the least - 30 in 2016. The data has an increasing trend.
When looking into fire subcategories, the most reports belonged to: Outside Fires (47.4%), and Structure Fires (31.8%).
Fire incident types reported to NFIRS in Zip Code 32920
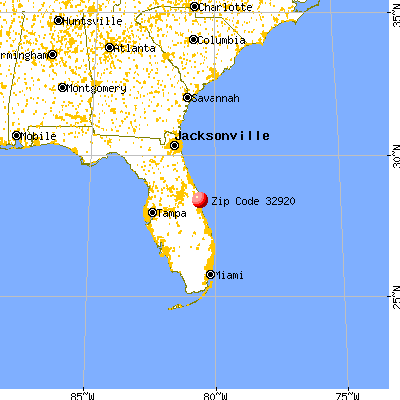


 Nearest zip codes: 32931, 32952, 32953, 32922, 32955, 32925.


 Based on the data from the years 2002 - 2018 the average number of fire incidents per year is 48. The highest number of reported fire incidents - 74 took place in 2004, and the least - 30 in 2016. The data has an increasing trend.
 When looking into fire subcategories, the most reports belonged to: Outside Fires (47.4%), and Structure Fires (31.8%).