Estimated zip code population in 2022: 28,610 Zip code population in 2010: 24,976 Zip code population in 2000: 23,913
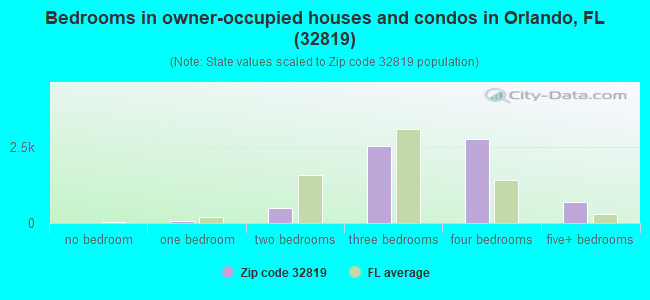
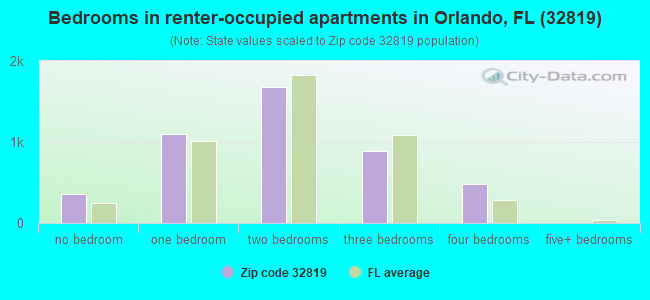
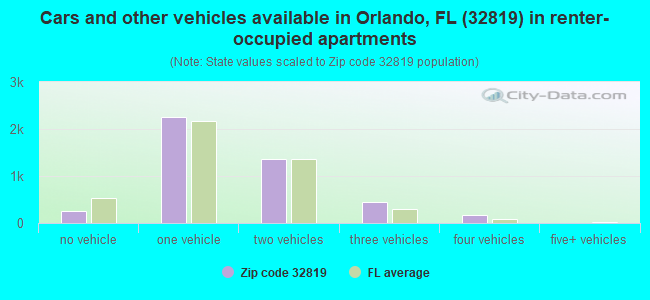
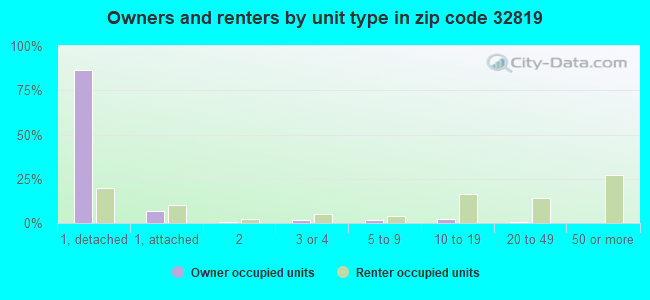
Houses and condos: 15,092 Renter-occupied apartments: 4,473
% of renters here:
41%
State:
33%
March 2022 cost of living index in zip code 32819: 93.8 (less than average, U.S. average is 100)
Land area: 20.7 sq. mi. Water area: 2.5 sq. mi.
Population density: 1,385 people per square mile
(low).
OSM Map
General Map
Google Map
MSN Map
OSM Map
General Map
Google Map
MSN Map
OSM Map
General Map
Google Map
MSN Map
OSM Map
General Map
Google Map
MSN Map
Please wait while loading the map...
Real estate property taxes paid for housing units in 2022:
This zip code:
0.7% ($3,764)
Florida:
0.7% ($2,529)
Median real estate property taxes paid for housing units with mortgages in 2022: $3,839 (0.7%) Median real estate property taxes paid for housing units with no mortgage in 2022: $3,663 (0.8%)
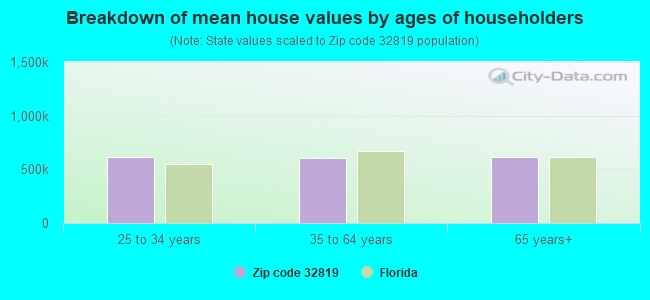
Estimated median house/condo value in 2022: $510,549
32819:
$510,549
Florida:
$354,100
According to our research of Florida and other state lists, there were 37 registered sex offenders living in 32819 zip code as of June 05, 2024. The ratio of all residents to sex offenders in zip code 32819 is 757 to 1. The ratio of registered sex offenders to all residents in this zip code is lower than the state average.
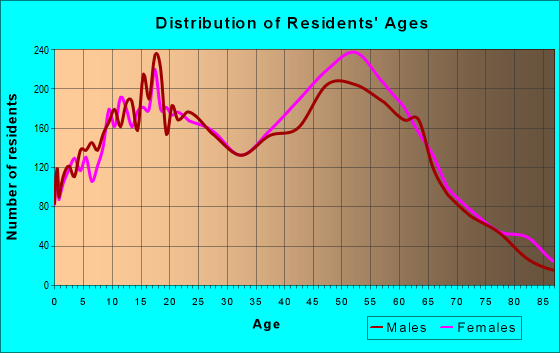
Median resident age:
This zip code:
39.0 years
Florida median age:
42.7 years
Average household size:
This zip code:
2.5 people
Florida:
2.5 people
Averages for the 2020 tax year for zip code 32819, filed in 2021:
Average Adjusted Gross Income (AGI) in 2020: $98,029 (Individual Income Tax Returns)
Here:
$98,029
State:
$82,200
Salary/wage: $72,153 (reported on 79.5% of returns)
Here:
$72,153
State:
$58,347
(% of AGI for various income ranges: 1165.3% for AGIs below $25k, 3531.1% for AGIs $25k-50k, 6614.6% for AGIs $50k-75k, 10261.7% for AGIs $75k-100k, 18440.8% for AGIs $100k-200k, 93409.6% for AGIs over 200k)
Taxable interest for individuals: $4,643 (reported on 28.0% of returns)
This zip code:
$4,643
Florida:
$4,272
(% of AGI for various income ranges: 17.6% for AGIs below $25k, 28.8% for AGIs $25k-50k, 72.5% for AGIs $50k-75k, 127.6% for AGIs $75k-100k, 307.2% for AGIs $100k-200k, 3227.3% for AGIs over 200k)
Ordinary dividends: $12,042 (reported on 24.0% of returns)
Here:
$12,042
State:
$15,863
(% of AGI for various income ranges: 29.1% for AGIs below $25k, 47.1% for AGIs $25k-50k, 152.7% for AGIs $50k-75k, 357.5% for AGIs $75k-100k, 758.5% for AGIs $100k-200k, 7069.8% for AGIs over 200k)
Net capital gain/loss in AGI: +$73,017 (reported on 23.9% of returns)
Here:
+$73,017
State:
+$62,983
(% of AGI for various income ranges: 14.5% for AGIs below $25k, 48.1% for AGIs $25k-50k, 155.7% for AGIs $50k-75k, 328.9% for AGIs $75k-100k, 1303.1% for AGIs $100k-200k, 59499.6% for AGIs over 200k)
Profit/loss from business: +$13,233 (reported on 24.3% of returns)
Here:
+$13,233
State:
+$9,719
(% of AGI for various income ranges: 195.6% for AGIs below $25k, 195.3% for AGIs $25k-50k, 390.4% for AGIs $50k-75k, 358.7% for AGIs $75k-100k, 778.4% for AGIs $100k-200k, 4970.9% for AGIs over 200k)
Taxable individual retirement arrangement distribution: $25,852 (reported on 7.6% of returns)
32819:
$25,852
Florida:
$24,823
(% of AGI for various income ranges: 31.7% for AGIs below $25k, 70.3% for AGIs $25k-50k, 226.2% for AGIs $50k-75k, 433.5% for AGIs $75k-100k, 979.4% for AGIs $100k-200k, 2597.3% for AGIs over 200k)
Self-employed (Keogh) retirement plans: $31,280 (reported on 0.6% of returns)
32819:
$31,280
Florida:
$29,694
(% of AGI for various income ranges: 72.5% for AGIs $75k-100k, 574.2% for AGIs over 200k)
Total itemized deductions: $42,527 (reported on 9.0% of returns)
Here:
$42,527
State:
$45,393
(% of AGI for various income ranges: 43.6% for AGIs below $25k, 116.4% for AGIs $25k-50k, 289.5% for AGIs $50k-75k, 622.7% for AGIs $75k-100k, 995.8% for AGIs $100k-200k, 8477.6% for AGIs over 200k)
Charity contributions: $20,751 (reported on 7.4% of returns)
Here:
$20,751
State:
$20,178
(% of AGI for various income ranges: 2.8% for AGIs below $25k, 14.2% for AGIs $25k-50k, 65.1% for AGIs $50k-75k, 116.7% for AGIs $75k-100k, 248.7% for AGIs $100k-200k, 4484.7% for AGIs over 200k)
Taxes paid: $7,093 (reported on 8.9% of returns)
32819:
$7,093
State:
$6,967
(% of AGI for various income ranges: 7.7% for AGIs below $25k, 23.9% for AGIs $25k-50k, 51.9% for AGIs $50k-75k, 126.5% for AGIs $75k-100k, 231.8% for AGIs $100k-200k, 1150.9% for AGIs over 200k)
Earned income credit: $2,130 (reported on 16.9% of returns)
Here:
$2,130
State:
$2,306
(% of AGI for various income ranges: 98.9% for AGIs below $25k, 63.1% for AGIs $25k-50k, 1.1% for AGIs $50k-75k)
Percentage of individuals using paid preparers for their 2020 taxes: 91.7%
Here:
92%
State:
92%
(% for various income ranges: 91.1% for AGIs below $25k, 93.1% for AGIs $25k-50k, 92.0% for AGIs $50k-75k, 91.2% for AGIs $75k-100k, 90.0% for AGIs $100k-200k, 93.3% for AGIs over 200k)
Averages for the 2012 tax year for zip code 32819, filed in 2013:
Average Adjusted Gross Income (AGI) in 2012: $81,180 (Individual Income Tax Returns)
Here:
$81,180
State:
$60,316
Salary/wage: $63,623 (reported on 83.4% of returns)
Here:
$63,623
State:
$45,277
(% of AGI for various income ranges: 79.0% for AGIs below $25k, 83.8% for AGIs $25k-50k, 75.3% for AGIs $50k-75k, 73.6% for AGIs $75k-100k, 72.8% for AGIs $100k-200k, 53.6% for AGIs over 200k)
Taxable interest for individuals: $3,750 (reported on 31.9% of returns)
This zip code:
$3,750
Florida:
$3,587
(% of AGI for various income ranges: 1.1% for AGIs below $25k, 0.7% for AGIs $25k-50k, 0.9% for AGIs $50k-75k, 0.9% for AGIs $75k-100k, 1.2% for AGIs $100k-200k, 2.0% for AGIs over 200k)
Ordinary dividends: $9,617 (reported on 24.8% of returns)
Here:
$9,617
State:
$12,831
(% of AGI for various income ranges: 3.3% for AGIs below $25k, 1.3% for AGIs $25k-50k, 2.4% for AGIs $50k-75k, 1.9% for AGIs $75k-100k, 2.8% for AGIs $100k-200k, 3.6% for AGIs over 200k)
Net capital gain/loss in AGI: +$15,562 (reported on 20.8% of returns)
Here:
+$15,562
State:
+$33,493
(% of AGI for various income ranges: 0.3% for AGIs $25k-50k, 0.8% for AGIs $50k-75k, 0.9% for AGIs $75k-100k, 1.5% for AGIs $100k-200k, 7.5% for AGIs over 200k)
Profit/loss from business: +$16,376 (reported on 19.1% of returns)
Here:
+$16,376
State:
+$10,012
(% of AGI for various income ranges: 10.3% for AGIs below $25k, 3.5% for AGIs $25k-50k, 3.3% for AGIs $50k-75k, 3.6% for AGIs $75k-100k, 3.0% for AGIs $100k-200k, 3.6% for AGIs over 200k)
Taxable individual retirement arrangement distribution: $27,023 (reported on 8.8% of returns)
32819:
$27,023
Florida:
$21,544
(% of AGI for various income ranges: 2.0% for AGIs below $25k, 2.2% for AGIs $25k-50k, 2.6% for AGIs $50k-75k, 3.6% for AGIs $75k-100k, 4.1% for AGIs $100k-200k, 2.6% for AGIs over 200k)
Self-employment retirement plans: $21,722 (reported on 0.7% of returns)
32819:
$21,722
Florida:
$20,611
(% of AGI for various income ranges: 0.3% for AGIs below $25k, 0.3% for AGIs $100k-200k, 0.2% for AGIs over 200k)
Total itemized deductions: $29,614 (16% of AGI, reported on 30.3% of returns)
Here:
$29,614
State:
$25,533
Here:
16.3% of AGI
State:
18.0% of AGI
(% of AGI for various income ranges: 10.1% for AGIs below $25k, 10.9% for AGIs $25k-50k, 12.9% for AGIs $50k-75k, 12.9% for AGIs $75k-100k, 12.2% for AGIs $100k-200k, 10.1% for AGIs over 200k)
Charity contributions: $5,334 (reported on 25.3% of returns)
Here:
$5,334
State:
$5,698
(% of AGI for various income ranges: 0.7% for AGIs below $25k, 1.2% for AGIs $25k-50k, 1.4% for AGIs $50k-75k, 1.8% for AGIs $75k-100k, 2.0% for AGIs $100k-200k, 1.8% for AGIs over 200k)
Taxes paid: $6,886 (reported on 29.5% of returns)
32819:
$6,886
State:
$6,203
(% of AGI for various income ranges: 1.8% for AGIs below $25k, 2.4% for AGIs $25k-50k, 2.5% for AGIs $50k-75k, 3.0% for AGIs $75k-100k, 3.2% for AGIs $100k-200k, 2.2% for AGIs over 200k)
Earned income credit: $2,270 (reported on 17.6% of returns)
Here:
$2,270
State:
$2,372
(% of AGI for various income ranges: 6.5% for AGIs below $25k, 1.0% for AGIs $25k-50k)
Percentage of individuals using paid preparers for their 2012 taxes: 52.5%
Here:
53%
State:
54%
(% for various income ranges: 48.8% for AGIs below $25k, 47.8% for AGIs $25k-50k, 53.8% for AGIs $50k-75k, 57.0% for AGIs $75k-100k, 57.3% for AGIs $100k-200k, 74.5% for AGIs over 200k)
Averages for the 2004 tax year for zip code 32819, filed in 2005:
Average Adjusted Gross Income (AGI) in 2004: $73,295 (Individual Income Tax Returns)
Here:
$73,295
State:
$50,523
Salary/wage: $57,873 (reported on 85.1% of returns)
Here:
$57,873
State:
$39,563
(% of AGI for various income ranges: 84.5% for AGIs $10k-25k, 81.3% for AGIs $25k-50k, 76.4% for AGIs $50k-75k, 78.6% for AGIs $75k-100k, 57.4% for AGIs over 100k)
Taxable interest for individuals: $3,899 (reported on 45.1% of returns)
This zip code:
$3,899
Florida:
$3,211
(% of AGI for various income ranges: 1.8% for AGIs $10k-25k, 1.5% for AGIs $25k-50k, 1.6% for AGIs $50k-75k, 1.5% for AGIs $75k-100k, 2.5% for AGIs over 100k)
Taxable dividends: $4,656 (reported on 30.9% of returns)
Here:
$4,656
State:
$6,129
(% of AGI for various income ranges: 1.7% for AGIs $10k-25k, 1.5% for AGIs $25k-50k, 1.9% for AGIs $50k-75k, 1.4% for AGIs $75k-100k, 2.0% for AGIs over 100k)
Net capital gain/loss: +$25,060 (reported on 27.4% of returns)
Here:
+$25,060
State:
+$27,205
(% of AGI for various income ranges: 0.7% for AGIs $10k-25k, 0.5% for AGIs $25k-50k, 1.3% for AGIs $50k-75k, 1.9% for AGIs $75k-100k, 12.7% for AGIs over 100k)
Profit/loss from business: +$16,186 (reported on 17.2% of returns)
Here:
+$16,186
State:
+$10,634
(% of AGI for various income ranges: 6.2% for AGIs $10k-25k, 4.5% for AGIs $25k-50k, 4.4% for AGIs $50k-75k, 3.6% for AGIs $75k-100k, 3.2% for AGIs over 100k)
IRA payment deduction: $3,535 (reported on 3.8% of returns)
32819:
$3,535
Florida:
$3,082
(% of AGI for various income ranges: 0.2% for AGIs $10k-25k, 0.3% for AGIs $25k-50k, 0.3% for AGIs $50k-75k, 0.3% for AGIs $75k-100k, 0.1% for AGIs over 100k)
Self-employed pension: $16,044 (reported on 1.2% of returns)
Here:
$16,044
Florida:
$15,857
(% of AGI for various income ranges: 0.2% for AGIs $25k-50k, 0.2% for AGIs $50k-75k, 0.2% for AGIs $75k-100k, 0.3% for AGIs over 100k)
Total itemized deductions: $22,475 (16% of AGI, reported on 40.0% of returns)
Here:
$22,475
State:
$20,370
Here:
16.4% of AGI
State:
20.7% of AGI
(% of AGI for various income ranges: 13.5% for AGIs $10k-25k, 17.7% for AGIs $25k-50k, 18.1% for AGIs $50k-75k, 16.9% for AGIs $75k-100k, 9.4% for AGIs over 100k)
Charity contributions deductions: $5,596 (4% of AGI, reported on 35.3% of returns)
Here:
$5,596
State:
$4,064
Here:
3.8% of AGI
State:
3.8% of AGI
(% of AGI for various income ranges: 1.3% for AGIs $10k-25k, 2.0% for AGIs $25k-50k, 2.1% for AGIs $50k-75k, 2.3% for AGIs $75k-100k, 3.0% for AGIs over 100k)
Total tax: $17,386 (reported on 74.8% of returns)
32819:
$17,386
State:
$9,431
(% of AGI for various income ranges: 4.2% for AGIs $10k-25k, 6.8% for AGIs $25k-50k, 9.2% for AGIs $50k-75k, 10.8% for AGIs $75k-100k, 22.0% for AGIs over 100k)
Earned income credit: $1,754 (reported on 13.6% of returns)
Here:
$1,754
State:
$1,808
Percentage of individuals using paid preparers for their 2004 taxes: 56.3%
Here:
56%
State:
60%
(% for various income ranges: 51.8% for AGIs below $10k, 56.2% for AGIs $10k-25k, 53.6% for AGIs $25k-50k, 57.8% for AGIs $50k-75k, 55.4% for AGIs $75k-100k, 64.3% for AGIs over 100k)
Likely homosexual households (counted as self-reported same-sex unmarried-partner households)
Lesbian couples: 0.0% of all households
Gay men: 0.4% of all households
Household received Food Stamps/SNAP in the past 12 months: 727 Household did not receive Food Stamps/SNAP in the past 12 months: 10,351
Women who had a birth in the past 12 months: 212 (204 now married, 17 unmarried) Women who did not have a birth in the past 12 months: 6,542 (2,629 now married, 3,912 unmarried)
Housing units in zip code 32819 with a mortgage: 3,741 (516 second mortgage, 396 both second mortgage and home equity loan) Houses without a mortgage: 130
Median monthly owner costs for units with a mortgage: $1,989 Median monthly owner costs for units without a mortgage: $847
Residents with income below the poverty level in 2022:
This zip code:
11.4%
Whole state:
12.7%
Residents with income below 50% of the poverty level in 2022:
This zip code:
4.8%
Whole state:
6.6%
Median number of rooms in houses and condos:
Here:
7.0
State:
5.9
Median number of rooms in apartments:
Here:
3.8
State:
4.2
Notable locations in this zip code not listed on our city pages
Notable locations in zip code 32819: Raintree Golf Resort (A), Rainbow Springs Golf and Country Club (B), Pinecrest Golf Club (C), Southwest Branch Orange County Public Library (D), Orange County Convention Center (E), Orange County Fire Rescue Department Station 57 (F), Orange County Fire Rescue Department Station 31 (G), Orange County Fire Rescue Department Station 52 (H), Orlando Fire Department Station 10 (I). Display/hide their locations on the map
Shopping Centers: Village International Shopping Center (1), Shoppers World Shopping Center (2), Quality Outlet 2 Shopping Center (3), Quality Outlet 1 Shopping Center (4), Mercado Mall (5), Mercado Mediterranean Village Shopping Center (6), International Village Mall Shopping Center (7), Belz Factory Outlet Mall Shopping Center (8), Festival Bay Shopping Center (9). Display/hide their locations on the map
Churches in zip code 32819 include: Saint Nicholas Byzantine Catholic Church (A), Sand Lake Presbyterian Church (B), Good Samaritan Mission Service (C), Pentecostal Church of Jesus Christ (D), River of Life Presbyterian Church (E), Saint Nicholas Catholic Church (F), Tangelo Baptist Church (G), Christ Community Church (H). Display/hide their locations on the map
Tourist attractions (not listed on the city page) : Discount Ticket Outlet (7492 Universal Boulevard) (1), A Guide to Orlando Florida- Disney- and Beyond (5750 Major Boulevard Suite 150) (2), Florida Vacation Savers (5858 International Drive) (3), Arcadium (Arcades & Amusements; 8445 International Drive) (4), Michael's VIPS- Private VIP Tours of all Central Florida Theme Parks (Recreational Trips & Guides; 7512 Dr Phillips Blvd Suite 50-155) (5), Air Florida Helicopter Inc (Tours & Charters; 8990 International Drive) (6), 892 Travel Company Inc (Tours & Charters; 7000 Skylane Drive) (7), Act America (Tours & Charters; 7345 West Sand Lake Road Suite 410) (8), Access USA (Tours & Charters; 7041 Grand National Drive) (9). Display/hide their approximate locations on the map
3,124 married couples with children.
1,020 single-parent households (432 men, 588 women).
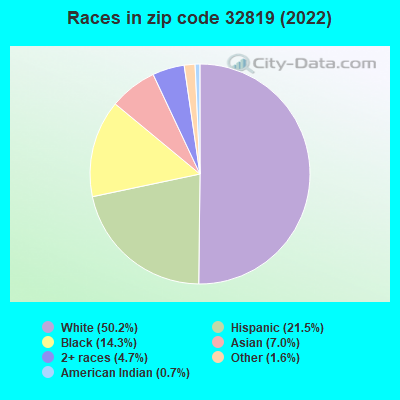
65.7% of residents of 32819 zip code speak English at home.
17.0% of residents speak Spanish at home (55% very well, 25% well, 14% not well, 6% not at all).
10.9% of residents speak other Indo-European language at home (64% very well, 22% well, 12% not well, 2% not at all).
4.3% of residents speak Asian or Pacific Island language at home (70% very well, 21% well, 9% not well).
2.3% of residents speak other language at home (72% very well, 22% well, 6% not well).
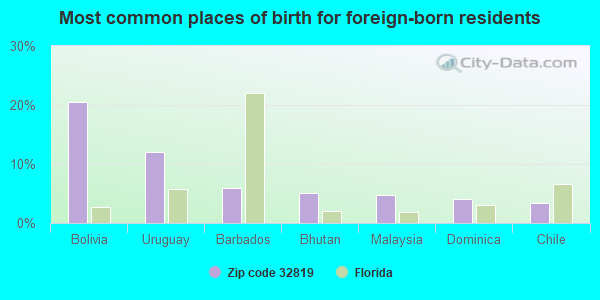
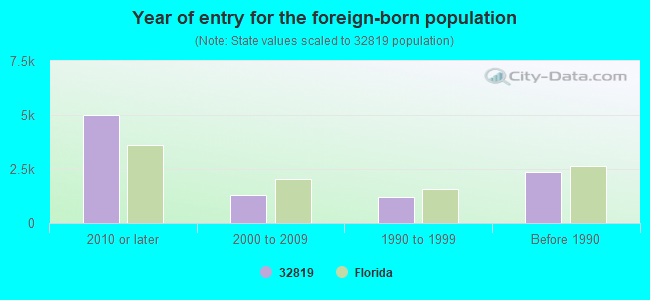
Foreign born population: 7,613 (26.6%) (47.2% of them are naturalized citizens)
Major facilities with environmental interests located in this zip code:
AGERE SYSTEMS (9333 SOUTH JOHN YOUNG PARKWAY in ORLANDO, FL)
AIR SYNTHETIC MINOR (AIRS/AFS) STATE MASTER (FDM) - CHAZ-FLD980845010, HAZARDOUS WASTE REGULATION PROGRAM, WAFR-FLR05B793, NPDES STORMWATER PROGRAM, WAFR-FLR05F435, WAFR-FLR10D130, WAFR-FLR10D131, WAFR-FLR10F125, WAFR-FLR10F126, WAFR-FLRNEE323, WAFR-FLR05B793, NPDES STORMWATER PERMIT, WAFR-FLR05F435, WAFR-FLR10D130, WAFR-FLR10D131, WAFR-FLR10F125, WAFR-FLR10F126, WAFR-FLRNEE323, CRITERIA AND HAZARDOUS AIR POLLUTANT INVENTORY (Inventory of air pollution sources) National Pollutant Discharge Elimination System NON-MAJOR (Tracking pollutant discharge elimination systems) - permit National Pollutant Discharge Elimination System NON-MAJOR (Tracking pollutant discharge elimination systems) - permit HAZARDOUS WASTE BIENNIAL REPORTER (Resource Conservation and Recovery Act (tracking hazardous waste)) Large Quantity Generators, more that 1000 kg of hazardous waste/month (Resource Conservation and Recovery Act (tracking hazardous waste)) TRI REPORTER (Tracking of toxic chemicals releasing facilities) Business SIC classification: SEMICONDUCTORS AND RELATED DEVICES Business NAICS classification: SEMICONDUCTOR AND RELATED DEVICE MANUFACTURING.; SEMICONDUCTOR AND RELATED DEVICE MANUFACTURING. Organizations: MIKE WATSON (CONTACT/OWNER)
, AT&T TECHNOLOGICS INC (CONTACT/OWNER)
, LUCENT TECHNOLOGIES INC (CONTACT/PERMIT)
, CIRENT SEMICONDUCTOR (CONTACT/PERMIT)
, JOHNSON CONTROLS INC (CONTACT/PERMIT)
, INDUSTRIAL DESIGN CORPORATION (CONTACT/PERMIT)
Alternative names: CIRENT SEMICONDUCTOR, INDUSTRIAL DESIGN CORPORATION, LUCENT TECHNOLOGIES INC, LUCENT TECHNOLOGIES ADRF PROJ, LUCENT TECHNOLOGIES AORF
MARITEC INDUSTRIAL INCORPORATED (5980 LAKEHURST DRIVE in ORLANDO, FL)
AIR SYNTHETIC MINOR (AIRS/AFS) (Integrated Compliance Information System) - ICIS-04-1998-0308, FORMAL ENFORCEMENT ACTION (Integrated Compliance Information System) - ICIS-04-1998-0300, FORMAL ENFORCEMENT ACTION (Resource Conservation and Recovery Act (tracking hazardous waste)) TRI REPORTER (Tracking of toxic chemicals releasing facilities) Business SIC classification: BOAT BUILDING AND REPAIRING Organizations: ACKERBLOOM ROBERT (CONTACT/OWNER)
Alternative names: BASS GAMBLER BOATS
LOCKHEED MARTIN ELECTRONICS AND MISSILES (5600 SAND LAKE ROAD MILE POST 624 in ORLANDO, FL)
AIR SYNTHETIC MINOR (AIRS/AFS) COMPLIANCE ACTIVITY (Tracking inspections of insecticide, fungicide, and rodenticide, and toxic substances) CRITERIA AND HAZARDOUS AIR POLLUTANT INVENTORY (Inventory of air pollution sources) PERFORMANCE TRACK (National Environmental Performance Track) National Pollutant Discharge Elimination System NON-MAJOR (Tracking pollutant discharge elimination systems) - permit HAZARDOUS WASTE BIENNIAL REPORTER (Resource Conservation and Recovery Act (tracking hazardous waste)) Large Quantity Generators, more that 1000 kg of hazardous waste/month (Resource Conservation and Recovery Act (tracking hazardous waste)) TSD (Resource Conservation and Recovery Act (tracking hazardous waste)) - notification TRI REPORTER (Tracking of toxic chemicals releasing facilities) Business SIC classification: TELEPHONE AND TELEGRAPH APPARATUS; PRINTED CIRCUIT BOARDS; GUIDED MISSILES AND SPACE VEHICLES; MANUFACTURING INDUSTRIES Business NAICS classification: ELECTRON TUBE MANUFACTURING.; BARE PRINTED CIRCUIT BOARD MANUFACTURING. Organizations: DAN WILLIAMS (CONTACT/OWNER)
, LOCKHEED MARTIN INC (CONTACT/OWNER)
Alternative names: LOCKHEED MARTIN ELECT/MISSILES, LOCKHEED MARTIN MFC -ORLANDO, LOCKHEED MARTIN MISSILES & FIRE CONTROL, LOCKHEED MARTIN MISSILES & FIRE CONTROL - ORLANDO
COLEMAN AEROSPACE - DIVISION OF L - 3 COMMUNICATIONS (5885 LAKEHURST DR in ORLANDO, FL)
STATE MASTER (FDM) - WAFR-FLRNEE362, NPDES STORMWATER PERMIT, WAFR-FLRNEE192, NPDES STORMWATER PROGRAM, WAFR-FLRNEE362, (Resource Conservation and Recovery Act (tracking hazardous waste)) Business SIC classification: SEARCH, DETECTION, NAVIGATION, GUIDANCE, AERONAUTICAL, AND NAUTICAL SYSTEMS AND INSTRUMENTS; ENGINEERING SERVICES Organizations: COLEMAN AEROSPACE A DIVISION OF L-3 COMMUNICATIONS (CONTACT/APPLICANT)
, THOMAS J COLEMAN REVOCBL TRUST (CONTACT/OWNER)
Alternative names: COLEMAN AEROSPACE A DIVISION OF L-3 COMMUNICATIONS, LYPHOMED INC
SOUTHWEST MIDDLE SCHOOL (6450 DR PHILLIPS BLVD in ORLANDO, FL)
(National Center for Education Statistics) - STATE ID-1031 Organizations: ORANGE COUNTY SCHOOL DISTRICT (SCHOOL DISTRICT)
PALM LAKE ELEMENTARY SCHOOL (8000 PIN OAK DR in ORLANDO, FL)
(National Center for Education Statistics) - STATE ID-0961 Organizations: ORANGE COUNTY SCHOOL DISTRICT (SCHOOL DISTRICT)
7-11 #29682 (IW) (7329 SANDLAKE RD in ORLANDO, FL)
National Pollutant Discharge Elimination System NON-MAJOR (Tracking pollutant discharge elimination systems) - permit Organizations: WILLO SMITH (CONTACT/OWNER)
CLARCONA OCOEE OFFSITE DRAINAG (CLARCONA OCOEE AND GAYMAR DRIV in ORLANDO, FL)
National Pollutant Discharge Elimination System NON-MAJOR (Tracking pollutant discharge elimination systems) - permit Organizations: TIM SCHULLER (CONTACT/OWNER)
IPANEMA II SERVICE CENTER (KINGSPOINTE PKWY 1/8 MILE N OF in ORLANDO, FL)
National Pollutant Discharge Elimination System NON-MAJOR (Tracking pollutant discharge elimination systems) - permit Organizations: ANDREW OWENS (CONTACT/OWNER)
IPANEMA III SERVICE CENTER (8750 EXCHANGE DR in ORLANDO, FL)
National Pollutant Discharge Elimination System NON-MAJOR (Tracking pollutant discharge elimination systems) - permit Organizations: ANDREW OWENS (CONTACT/OWNER)
LAKE 10A & NE QUADRANT MASS GR (9751 UNIVERSAL BLVD in ORLANDO, FL)
National Pollutant Discharge Elimination System NON-MAJOR (Tracking pollutant discharge elimination systems) - permit Organizations: BRAD GOEB (CONTACT/OWNER)
CROWNPOINTE COMMERCE PARK WARE (7315 KINGSPOINTE PARKWAY in ORLANDO, FL)
National Pollutant Discharge Elimination System NON-MAJOR (Tracking pollutant discharge elimination systems) - permit Organizations: BARRY GREENFIELD (CONTACT/OWNER)
SAND LAKE MEDICAL PLAZA (7483 SAND LAKE COMMONS BLVD in ORLANDO, FL)
National Pollutant Discharge Elimination System NON-MAJOR (Tracking pollutant discharge elimination systems) - permit Organizations: BRAD KANAN (CONTACT/OWNER)
Alternative names: BAY POINTE CONDOMINIUMS
Housing units lacking complete plumbing facilities: 0.2% Housing units lacking complete kitchen facilities: 1.3%
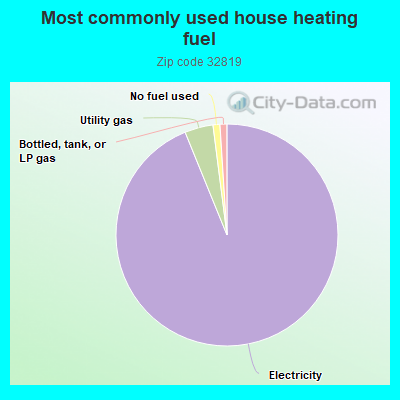
93.2%Electricity
4.1%Utility gas
1.0%No fuel used
1.0%Bottled, tank, or LP gas
Population in 1990: 4,434. Population change in the 1990s: +19,479 (+439.3%).
Place of birth for U.S.-born residents:
This state: 7,882
Northeast: 4,236
Midwest: 3,152
South: 3,199
West: 706
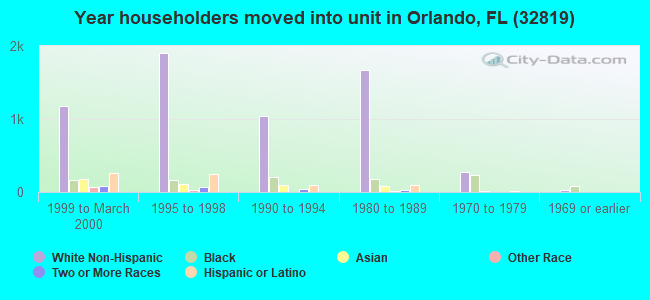
53% of the 32819 zip code residents lived in the same house 5 years ago. Out of people who lived in different houses, 51% lived in this county. Out of people who lived in different counties, 50% lived in Florida.
87% of the 32819 zip code residents lived in the same house 1 year ago. Out of people who lived in different houses, 47% moved from this county. Out of people who lived in different houses, 20% moved from different county within same state. Out of people who lived in different houses, 14% moved from different state. Out of people who lived in different houses, 19% moved from abroad.
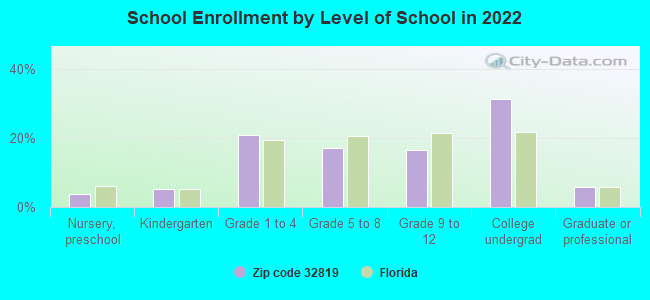
Private vs. public school enrollment:
Students in private schools in grades 1 to 8 (elementary and middle school): 249
Here:
10.7%
Florida:
15.8%
Students in private schools in grades 9 to 12 (high school): 217
Here:
21.4%
Florida:
12.9%
Students in private undergraduate colleges: 433
Here:
22.4%
Florida:
23.6%
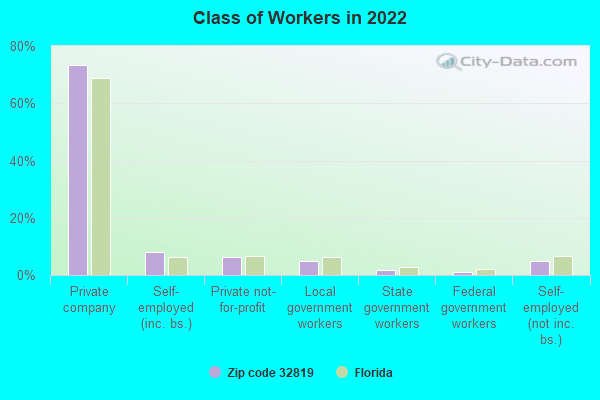
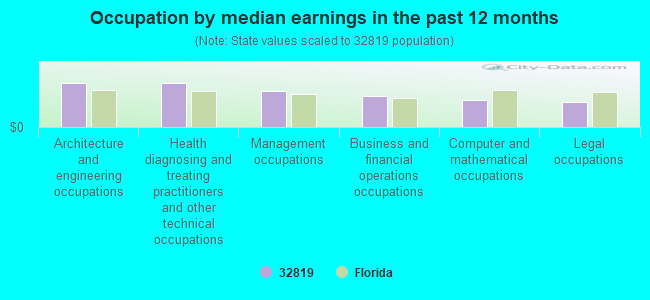
Occupation by median earnings in the past 12 months ($)
110,210Architecture and engineering occupations
109,230Health diagnosing and treating practitioners and other technical occupations
89,511Management occupations
77,811Business and financial operations occupations
67,142Computer and mathematical occupations
61,397Legal occupations
Companies with biggest federal contracts located in this zip code (ORLANDO, FL):
LOCKHEED MARTIN CORPORATION (5600 W SAND LAKE RD MP125) : $3,528,070,028 in 1795 contractsfrom 1999 to 2006
Contracts for Aircraft Propellers and Components, Aircraft Gunnery Fire Control Components, Fire Control Computing Sights and Devices, Miscellaneous Aircraft Accessories and Components, and moreby Army, Air Force, Navy, Defense Advanced Research Projects Agency, and others Signed by year:2000: $271,512,164; 2001: $189,586,862; 2002: $547,811,386; 2003: $608,274,362; 2004: $480,926,418; 2005: $883,677,647; 2006: $475,069,108.
Biggest contracts:
$218,451,001 with Army for Aircraft Propellers and Components. Signed on 2006-06-01. Completion date: 2010-12-31.
$129,728,800 with Army for Aircraft Gunnery Fire Control Components. Signed on 2003-01-14. Completion date: 2009-01-30.
$110,752,629, same as above.Signed on 2002-12-13. Completion date: 2006-10-30.
$97,947,391 with Army for Fire Control Computing Sights and Devices. Signed on 2005-04-26. Completion date: 2007-07-31.
LONGBOW LIMITED LIABILITY COMP (5600 SAND LAKE RD) : $1,843,172,847 in 279 contractsfrom 1999 to 2006
Contracts for Guided Missiles, Fire Control Systems, Complete, Miscellaneous Aircraft Accessories and Components, Fire Prevention and Control -- Basic Research (R&D), and moreby Army Signed by year:2000: $476,801,775; 2001: $419,375,178; 2002: $192,068,567; 2003: $81,713,208; 2004: $55,301,589; 2005: $69,077,056; 2006: $150,469,346.
Biggest contracts:
$280,000,000 with Army for Guided Missiles. Signed on 1999-11-23. Completion date: 2005-08-29.
$268,728,600, same as above.Signed on 2000-11-20. Completion date: 2005-08-31.
$159,237,737, same as above.Signed on 2002-11-26. Completion date: 2005-08-29.
$158,601,448, same as above.Signed on 2001-12-06. Completion date: 2005-08-29.
LOCKHEED MARTIN INTEGRATED SYS (5600 SAND LAKE RD) : $652,420,772 in 137 contractsfrom 1999 to 2006
Contracts for Guided Missile Systems, Complete, Defense Aircraft -- Engineering Development (R&D), Ammunition -- Operational Systems Development (R&D), Miscellaneous Weapons, and moreby Air Force, Navy Signed by year:2000: $51,219,464; 2001: $90,212,520; 2002: $123,911,976; 2003: $162,254,305; 2004: $132,468,120; 2005: $8,116,119; 2006: $83,173,523.
Biggest contracts:
$112,251,744 with Air Force for Guided Missile Systems, Complete. Taking place in AL. Signed on 2004-11-22. Completion date: 2006-02-28.
$102,226,560 with Air Force for Defense Aircraft -- Engineering Development (R&D). Signed on 2002-03-20. Completion date: 2004-04-20.
$82,955,239 with Air Force for Ammunition -- Operational Systems Development (R&D). Signed on 2001-03-27. Completion date: 2003-02-28.
$79,950,626 with Air Force for Guided Missile Systems, Complete. Taking place in AL. Signed on 2006-03-14. Completion date: 2008-02-28.
HELLFIRE SYSTEMS LIMITED LIABI (5600 WEST SAND LAKE ROAD) : $507,444,414 in 150 contractsfrom 1999 to 2006
Contracts for Guided Missiles, Defense Missile and Space Systems -- Engineering Development (R&D), Services -- Basic Research (R&D), Defense Missile and Space Systems -- Basic Research (R&D), and moreby Army Signed by year:2000: $29,431,908; 2001: $19,417,786; 2002: $25,977,105; 2003: $57,629,985; 2004: $118,575,866; 2005: $95,727,031; 2006: $143,732,407.
Biggest contracts:
$129,696,053 with Army for Guided Missiles. Signed on 2006-05-27. Completion date: 2007-10-31.
$45,416,989, same as above.Signed on 2004-12-22. Completion date: 2007-06-30.
$42,989,506, same as above.Signed on 2005-09-26. Completion date: 2007-06-30.
$36,416,542, same as above.Signed on 2005-12-07. Completion date: 2007-10-31.
TEAM APACHE SYSTEMS LLC (5600 E SAND LAKE RD MAIL P) : $427,038,339 in 52 contractsfrom 2000 to 2006
Contracts for Miscellaneous Aircraft Accessories and Components, Fire Control Designating and Indicating Equipment, Engineering and Technical Services, Aircraft, Rotary Wing by Army Signed by year:2000: $55,365,000; 2001: $19,125,000; 2002: $66,813,599; 2003: $281,675,048; 2004: -$3,880,000; 2005: $7,683,478; 2006: $256,214.
Biggest contracts:
$158,620,000 with Army for Miscellaneous Aircraft Accessories and Components. Signed on 2003-11-11. Completion date: 2005-01-01.
$84,255,000, same as above.Signed on 2003-11-11. Completion date: 2005-01-01.
$31,428,000 with Army for Fire Control Designating and Indicating Equipment. Signed on 2000-10-18. Completion date: 2003-09-30.
$22,073,000 with Army for Fire Control Designating and Indicating Equipment. Taking place in AL. Signed on 2000-12-21. Completion date: 2002-11-30.
PGSUS LIMITED LIABILITY CORPOR (5600 SAND LAKE RD) : $115,893,813 in 69 contractsfrom 1999 to 2006
Contracts for Guided Missile Systems, Complete, Guided Missile Warheads and Explosive Components, Guided Missile Maintenance, Repair, and Checkout Specialized Equipment, Electrical and Electronic Properties Measuring and Testing Instruments, and moreby Air Force Signed by year:2000: $59,336,114; 2001: $40,722,894; 2002: $6,587,707; 2003: $7,358,326; 2004: $1,031,760; 2005: $416,280; 2006: $113,000.
Biggest contracts:
$48,816,436 with Air Force for Guided Missile Systems, Complete. Signed on 2000-09-06. Completion date: 2006-09-30.
$30,839,000, same as above.Signed on 2001-07-25. Completion date: 2006-09-30.
$6,000,000, same as above.Signed on 2000-09-07. Completion date: 2006-09-30.
$5,912,637, same as above.Signed on 2002-05-01. Completion date: 2006-09-30.
AMERICAN BRIDGE COMPANY (8517 SOUTH PARK CIRCLE, SU) : $72,404,758 in 85 contractsfrom 2000 to 2006
Contracts for Construction of Structures and Facilities -- Other Non-Building Facilities, Construction of Structures and Facilities -- Miscellaneous Buildings, Maintenance, Repair or Alteration of Real Property -- Other Non-Building Facilities, Maintenance, Repair or Alteration of Real Property -- Miscellaneous Buildings by Navy, Army Signed by year:2000: $16,681,000; 2001: $639,826; 2002: $36,758,200; 2003: $15,320,156; 2004: $253,706; 2005: $2,061,711; 2006: $690,159.
Biggest contracts:
$25,290,000 with Navy for Construction of Structures and Facilities -- Other Non-Building Facilities. Taking place in VA. Signed on 2002-02-12. Completion date: 2004-11-28.
$16,681,000 with Army for Construction of Structures and Facilities -- Miscellaneous Buildings. Signed on 2000-06-29. Completion date: 2002-01-15.
$12,974,706 with Navy for Maintenance, Repair or Alteration of Real Property -- Other Non-Building Facilities. Signed on 2003-04-30. Completion date: 2004-11-30.
$11,298,623 with Navy for Maintenance, Repair or Alteration of Real Property -- Miscellaneous Buildings. Taking place in VA. Signed on 2002-02-27. Completion date: 2003-05-08.
T & G CORPORATION (8623 COMMODITY CIRCLE; small business) : $42,789,430 in 192 contractsfrom 2003 to 2006
Contracts for Construction of Structures and Facilities -- Miscellaneous Buildings, Construction of Structures and Facilities -- Schools, Maintenance, Repair or Alteration of Real Property -- Miscellaneous Buildings, Construction of Structures and Facilities -- Penal Facilities, and moreby Army, U.S. Army Corps of Engineers - civil program financing only, Navy, Bureau of Prisoners/Federal Prison System, and others Signed by year:2000: $0; 2001: $0; 2002: $0; 2003: $17,249,764; 2004: $12,647,495; 2005: $12,380,124; 2006: $512,047.
Biggest contracts:
$4,000,000 with Army for Construction of Structures and Facilities -- Miscellaneous Buildings. Signed on 2004-11-02. Completion date: 2005-06-30.
$4,000,000 with U.S. Army Corps of Engineers - civil program financing only for Construction of Structures and Facilities -- Miscellaneous Buildings. Signed on 2004-11-02. Completion date: 2005-06-30.
$3,000,000 with Army for Construction of Structures and Facilities -- Miscellaneous Buildings. Signed on 2005-11-10. Completion date: 2006-11-10.
$2,938,410 with Navy for Construction of Structures and Facilities -- Miscellaneous Buildings. Signed on 2003-09-27. Completion date: 2004-09-21.
B I B CONSULTANTS, INC (7041 GRAND NATIONAL DR; small business) : $20,730,451 in 382 contractsfrom 2002 to 2006
Contracts for Educational Services, Tuition, Registration, and Membership Fees, Other Education and Training Services, Training/Curriculum Development, and moreby Department of Defense, U.S. Special Operations Command, Army, Navy, and others Signed by year:2000: $0; 2001: $0; 2002: $2,070,903; 2003: $7,895,568; 2004: $2,288,523; 2005: $5,045,833; 2006: $3,429,624.
Biggest contracts:
$2,494,167 with Department of Defense for Educational Services. Signed on 2003-08-28. Completion date: 2004-05-27.
$1,609,821 with U.S. Special Operations Command for Educational Services. Taking place in KY. Signed on 2005-11-07. Completion date: 2006-05-18.
$1,542,395 with U.S. Special Operations Command for Educational Services. Taking place in NC. Signed on 2006-03-06. Completion date: 2006-09-30.
$1,387,530 with U.S. Special Operations Command for Educational Services. Taking place in KY. Signed on 2003-10-01. Completion date: 2004-05-27.
COLEMAN RESEARCH CORPORATION (7675 MUNICIPAL DR) : $19,445,123 in 17 contractsfrom 2000 to 2006
Contracts for Defense Missile and Space Systems -- Advanced Development (R&D) by Army Signed by year:2000: $18,696,340; 2001: $0; 2002: $0; 2003: $0; 2004: $90,594; 2005: $0; 2006: $658,189.
Biggest contracts:
$11,288,521 with Army for Defense Missile and Space Systems -- Advanced Development (R&D). Signed on 2000-01-10. Completion date: 2001-04-30.
$2,937,024, same as above.Signed on 2000-02-22. Completion date: 2001-04-30.
$1,783,123, same as above.Signed on 2000-09-20. Completion date: 2001-04-30.
$1,426,785, same as above.Signed on 2000-03-22. Completion date: 2001-04-30.
Top industries in this zip code by the number of employees in 2005:
Arts, Entertainment, and Recreation: Amusement and Theme Parks (over 1000: 1, 20-49: 1, 5-9: 2)
Health Care and Social Assistance: General Medical and Surgical Hospitals (over 1000: 1, 5-9: 1)
Real Estate and Rental and Leasing: Other Commercial and Industrial Machinery and Equipment Rental and Leasing (500-999: 1, 100-249: 2, 5-9: 5, 1-4: 4)
Information: Cable and Other Program Distribution (500-999: 1, 250-499: 1)
Real Estate and Rental and Leasing: Offices of Real Estate Agents and Brokers (250-499: 1, 100-249: 2, 20-49: 4, 10-19: 2, 5-9: 8, 1-4: 68)
People in group quarters in 2010:
229 people in college/university student housing
People in group quarters in 2000:
22 people in other noninstitutional group quarters
19 people in nursing homes
Fatal accident statistics in 2014:
Fatal accident count: 16
Vehicles involved in fatal accidents: 26
Fatal accidents caused by drunken drivers: 5
Fatalities: 16
Persons involved in fatal accidents: 37
Pedestrians involved in fatal accidents: 9
Fatal accident statistics in 2013:
Fatal accident count: 6
Vehicles involved in fatal accidents: 11
Fatal accidents caused by drunken drivers: 3
Fatalities: 7
Persons involved in fatal accidents: 16
Pedestrians involved in fatal accidents: 1
Home Mortgage Disclosure Act Aggregated Statistics For Year 2009 (Based on 8 full and 4 partial tracts)
A) FHA, FSA/RHS & VA Home Purchase Loans
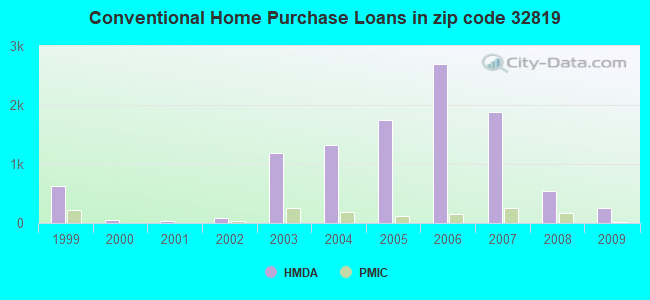
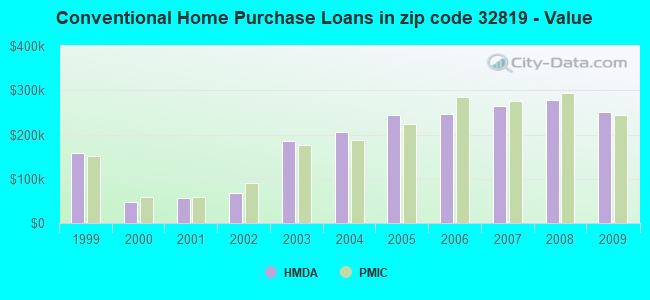
B) Conventional Home Purchase Loans
C) Refinancings
D) Home Improvement Loans
F) Non-occupant Loans on < 5 Family Dwellings (A B C & D)
G) Loans On Manufactured Home Dwelling (A B C & D)
Number
Average Value
Number
Average Value
Number
Average Value
Number
Average Value
Number
Average Value
Number
Average Value
LOANS ORIGINATED
125
$219,082
248
$250,208
503
$223,475
21
$106,821
105
$160,701
0
$0
APPLICATIONS APPROVED, NOT ACCEPTED
10
$189,762
24
$176,847
76
$214,323
2
$80,365
21
$164,863
1
$41,450
APPLICATIONS DENIED
34
$207,662
101
$195,358
357
$242,643
18
$122,736
91
$180,943
0
$0
APPLICATIONS WITHDRAWN
10
$187,781
53
$205,599
182
$253,688
9
$101,572
44
$186,930
2
$88,720
FILES CLOSED FOR INCOMPLETENESS
8
$138,938
27
$279,681
68
$254,491
4
$156,710
16
$242,848
0
$0
Aggregated Statistics For Year 2008 (Based on 8 full and 4 partial tracts)
A) FHA, FSA/RHS & VA Home Purchase Loans
B) Conventional Home Purchase Loans
C) Refinancings
D) Home Improvement Loans
F) Non-occupant Loans on < 5 Family Dwellings (A B C & D)
G) Loans On Manufactured Home Dwelling (A B C & D)
Number
Average Value
Number
Average Value
Number
Average Value
Number
Average Value
Number
Average Value
Number
Average Value
LOANS ORIGINATED
75
$233,041
549
$278,293
452
$238,603
31
$64,723
384
$257,758
1
$79,990
APPLICATIONS APPROVED, NOT ACCEPTED
12
$230,753
155
$282,873
135
$246,692
12
$113,255
123
$267,514
1
$35,390
APPLICATIONS DENIED
16
$240,438
394
$296,308
426
$251,411
56
$175,073
337
$257,193
0
$0
APPLICATIONS WITHDRAWN
15
$184,414
205
$292,077
162
$261,401
11
$202,709
157
$257,779
0
$0
FILES CLOSED FOR INCOMPLETENESS
4
$159,252
50
$280,460
51
$281,643
6
$113,667
54
$224,811
0
$0
Aggregated Statistics For Year 2007 (Based on 8 full and 4 partial tracts)
A) FHA, FSA/RHS & VA Home Purchase Loans
B) Conventional Home Purchase Loans
C) Refinancings
D) Home Improvement Loans
E) Loans on Dwellings For 5+ Families
F) Non-occupant Loans on < 5 Family Dwellings (A B C & D)
G) Loans On Manufactured Home Dwelling (A B C & D)
Number
Average Value
Number
Average Value
Number
Average Value
Number
Average Value
Number
Average Value
Number
Average Value
Number
Average Value
LOANS ORIGINATED
2
$121,955
1,878
$264,565
1,086
$241,702
108
$179,984
4
$33,399,438
1,167
$216,657
1
$37,330
APPLICATIONS APPROVED, NOT ACCEPTED
2
$249,965
393
$271,695
277
$221,726
39
$95,254
0
$0
230
$230,636
0
$0
APPLICATIONS DENIED
6
$209,667
715
$261,441
740
$258,189
127
$123,823
0
$0
342
$228,791
4
$76,790
APPLICATIONS WITHDRAWN
2
$264,785
426
$241,756
309
$249,731
31
$144,285
0
$0
224
$226,666
0
$0
FILES CLOSED FOR INCOMPLETENESS
0
$0
97
$269,615
120
$239,501
12
$208,008
0
$0
48
$255,882
0
$0
Aggregated Statistics For Year 2006 (Based on 8 full and 4 partial tracts)
A) FHA, FSA/RHS & VA Home Purchase Loans
B) Conventional Home Purchase Loans
C) Refinancings
D) Home Improvement Loans
E) Loans on Dwellings For 5+ Families
F) Non-occupant Loans on < 5 Family Dwellings (A B C & D)
G) Loans On Manufactured Home Dwelling (A B C & D)
Number
Average Value
Number
Average Value
Number
Average Value
Number
Average Value
Number
Average Value
Number
Average Value
Number
Average Value
LOANS ORIGINATED
8
$133,052
2,698
$246,532
1,532
$230,708
147
$142,061
4
$8,923,905
1,460
$223,341
2
$471,985
APPLICATIONS APPROVED, NOT ACCEPTED
4
$200,025
666
$228,877
278
$238,450
38
$128,334
0
$0
359
$213,884
4
$75,642
APPLICATIONS DENIED
6
$278,000
669
$238,206
682
$233,179
119
$119,071
0
$0
316
$196,766
4
$35,585
APPLICATIONS WITHDRAWN
0
$0
661
$237,388
505
$225,211
17
$160,909
0
$0
315
$207,183
0
$0
FILES CLOSED FOR INCOMPLETENESS
0
$0
78
$226,891
112
$233,623
20
$144,208
0
$0
36
$251,708
0
$0
Aggregated Statistics For Year 2005 (Based on 8 full and 4 partial tracts)
A) FHA, FSA/RHS & VA Home Purchase Loans
B) Conventional Home Purchase Loans
C) Refinancings
D) Home Improvement Loans
F) Non-occupant Loans on < 5 Family Dwellings (A B C & D)
G) Loans On Manufactured Home Dwelling (A B C & D)
Number
Average Value
Number
Average Value
Number
Average Value
Number
Average Value
Number
Average Value
Number
Average Value
LOANS ORIGINATED
12
$126,994
1,741
$243,885
1,626
$207,448
156
$131,542
656
$189,836
7
$95,696
APPLICATIONS APPROVED, NOT ACCEPTED
0
$0
260
$223,999
243
$188,155
19
$146,878
102
$174,300
0
$0
APPLICATIONS DENIED
4
$109,668
412
$238,578
729
$187,872
149
$84,177
147
$178,161
17
$64,639
APPLICATIONS WITHDRAWN
2
$245,755
320
$194,490
621
$199,957
77
$268,387
114
$146,841
2
$200,000
FILES CLOSED FOR INCOMPLETENESS
0
$0
49
$261,276
136
$197,473
8
$71,605
22
$201,357
0
$0
Aggregated Statistics For Year 2004 (Based on 8 full and 4 partial tracts)
A) FHA, FSA/RHS & VA Home Purchase Loans
B) Conventional Home Purchase Loans
C) Refinancings
D) Home Improvement Loans
F) Non-occupant Loans on < 5 Family Dwellings (A B C & D)
G) Loans On Manufactured Home Dwelling (A B C & D)
Number
Average Value
Number
Average Value
Number
Average Value
Number
Average Value
Number
Average Value
Number
Average Value
LOANS ORIGINATED
23
$103,054
1,323
$204,853
1,226
$169,786
97
$83,582
336
$160,391
1
$26,910
APPLICATIONS APPROVED, NOT ACCEPTED
6
$129,147
173
$222,850
260
$154,951
30
$60,157
55
$179,937
2
$11,000
APPLICATIONS DENIED
10
$82,691
322
$168,617
644
$142,700
102
$47,684
94
$107,369
24
$65,822
APPLICATIONS WITHDRAWN
8
$116,334
187
$216,977
559
$156,741
21
$86,337
42
$196,616
6
$95,755
FILES CLOSED FOR INCOMPLETENESS
0
$0
61
$231,025
99
$165,206
6
$71,067
20
$184,040
0
$0
Aggregated Statistics For Year 2003 (Based on 8 full and 4 partial tracts)
A) FHA, FSA/RHS & VA Home Purchase Loans
B) Conventional Home Purchase Loans
C) Refinancings
D) Home Improvement Loans
F) Non-occupant Loans on < 5 Family Dwellings (A B C & D)
Number
Average Value
Number
Average Value
Number
Average Value
Number
Average Value
Number
Average Value
LOANS ORIGINATED
27
$116,731
1,186
$186,141
2,818
$153,350
83
$43,185
398
$131,572
APPLICATIONS APPROVED, NOT ACCEPTED
4
$128,988
130
$219,415
413
$140,302
37
$38,043
43
$131,316
APPLICATIONS DENIED
10
$96,895
189
$188,801
881
$144,715
61
$42,375
80
$115,385
APPLICATIONS WITHDRAWN
14
$108,251
168
$171,357
682
$146,046
21
$52,999
65
$138,729
FILES CLOSED FOR INCOMPLETENESS
2
$84,970
51
$188,910
143
$192,540
14
$81,550
18
$106,205
Aggregated Statistics For Year 2002 (Based on 2 full tracts)
A) FHA, FSA/RHS & VA Home Purchase Loans
B) Conventional Home Purchase Loans
C) Refinancings
D) Home Improvement Loans
F) Non-occupant Loans on < 5 Family Dwellings (A B C & D)
Number
Average Value
Number
Average Value
Number
Average Value
Number
Average Value
Number
Average Value
LOANS ORIGINATED
24
$69,901
85
$66,952
107
$62,050
10
$52,166
57
$61,048
APPLICATIONS APPROVED, NOT ACCEPTED
0
$0
18
$73,441
45
$64,066
0
$0
16
$52,981
APPLICATIONS DENIED
2
$66,195
41
$61,931
164
$60,581
14
$12,985
32
$48,165
APPLICATIONS WITHDRAWN
2
$79,040
18
$82,882
81
$61,110
2
$48,410
12
$71,630
FILES CLOSED FOR INCOMPLETENESS
0
$0
10
$60,861
18
$89,139
0
$0
2
$115,595
Aggregated Statistics For Year 2001 (Based on 2 full tracts)
A) FHA, FSA/RHS & VA Home Purchase Loans
B) Conventional Home Purchase Loans
C) Refinancings
D) Home Improvement Loans
F) Non-occupant Loans on < 5 Family Dwellings (A B C & D)
Number
Average Value
Number
Average Value
Number
Average Value
Number
Average Value
Number
Average Value
LOANS ORIGINATED
32
$73,050
36
$56,371
158
$65,958
16
$53,969
121
$64,963
APPLICATIONS APPROVED, NOT ACCEPTED
2
$82,990
8
$50,388
18
$49,071
4
$35,568
4
$35,568
APPLICATIONS DENIED
0
$0
24
$67,596
152
$57,252
26
$16,796
26
$77,976
APPLICATIONS WITHDRAWN
2
$59,280
8
$104,481
85
$77,575
16
$41,990
24
$144,001
FILES CLOSED FOR INCOMPLETENESS
0
$0
0
$0
12
$59,938
0
$0
0
$0
Aggregated Statistics For Year 2000 (Based on 2 full tracts)
A) FHA, FSA/RHS & VA Home Purchase Loans
B) Conventional Home Purchase Loans
C) Refinancings
D) Home Improvement Loans
F) Non-occupant Loans on < 5 Family Dwellings (A B C & D)
Number
Average Value
Number
Average Value
Number
Average Value
Number
Average Value
Number
Average Value
LOANS ORIGINATED
28
$62,244
59
$47,123
65
$54,112
12
$27,170
38
$48,152
APPLICATIONS APPROVED, NOT ACCEPTED
2
$65,210
20
$45,547
22
$53,532
4
$7,410
8
$39,272
APPLICATIONS DENIED
6
$59,280
38
$52,312
132
$51,885
28
$21,806
24
$53,105
APPLICATIONS WITHDRAWN
2
$39,520
8
$80,028
71
$53,797
2
$7,905
6
$59,280
FILES CLOSED FOR INCOMPLETENESS
0
$0
6
$107,363
12
$73,112
0
$0
2
$66,195
Aggregated Statistics For Year 1999 (Based on 2 full and 1 partial tracts)
A) FHA, FSA/RHS & VA Home Purchase Loans
B) Conventional Home Purchase Loans
C) Refinancings
D) Home Improvement Loans
E) Loans on Dwellings For 5+ Families
F) Non-occupant Loans on < 5 Family Dwellings (A B C & D)
2003 - 2018 National Fire Incident Reporting System (NFIRS) incidents
Based on the data from the years 2003 - 2018 the average number of fire incidents per year is 119. The highest number of reported fire incidents - 193 took place in 2005, and the least - 55 in 2011. The data has a decreasing trend.
When looking into fire subcategories, the most reports belonged to: Structure Fires (35.6%), and Mobile Property/Vehicle Fires (30.2%).
Fire incident types reported to NFIRS in Zip Code 32819
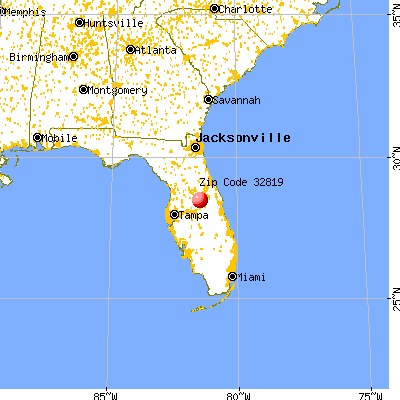


 Nearest zip codes: 32836, 32835, 32821, 32811, 32839, 32837.


 Based on the data from the years 2003 - 2018 the average number of fire incidents per year is 119. The highest number of reported fire incidents - 193 took place in 2005, and the least - 55 in 2011. The data has a decreasing trend.
 When looking into fire subcategories, the most reports belonged to: Structure Fires (35.6%), and Mobile Property/Vehicle Fires (30.2%).