Estimated zip code population in 2022: 23,179 Zip code population in 2010: 18,585 Zip code population in 2000: 17,033
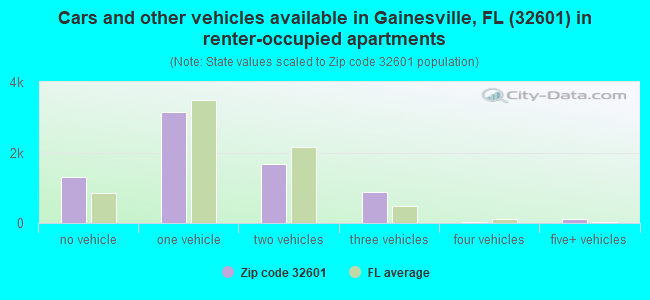
Houses and condos: 10,721 Renter-occupied apartments: 7,159
% of renters here:
76%
State:
33%
March 2022 cost of living index in zip code 32601: 92.8 (less than average, U.S. average is 100)
Land area: 4.5 sq. mi. Water area: 0.0 sq. mi.
Population density: 5,100 people per square mile
(average).
OSM Map
General Map
Google Map
MSN Map
OSM Map
General Map
Google Map
MSN Map
OSM Map
General Map
Google Map
MSN Map
OSM Map
General Map
Google Map
MSN Map
Please wait while loading the map...
Real estate property taxes paid for housing units in 2022:
This zip code:
0.8% ($2,168)
Florida:
0.7% ($2,529)
Median real estate property taxes paid for housing units with mortgages in 2022: $2,762 (0.9%) Median real estate property taxes paid for housing units with no mortgage in 2022: $1,585 (0.6%)
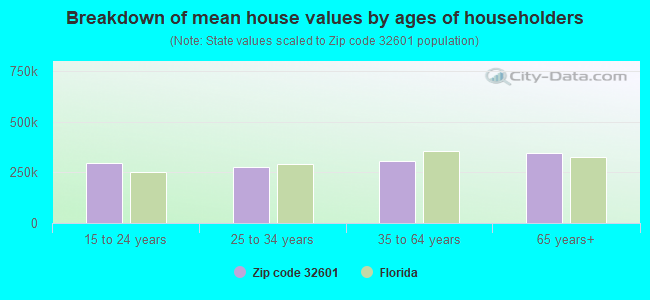
Estimated median house/condo value in 2022: $280,905
32601:
$280,905
Florida:
$354,100
According to our research of Florida and other state lists, there were 18 registered sex offenders living in 32601 zip code as of June 06, 2024. The ratio of all residents to sex offenders in zip code 32601 is 1,060 to 1. The ratio of registered sex offenders to all residents in this zip code is lower than the state average.
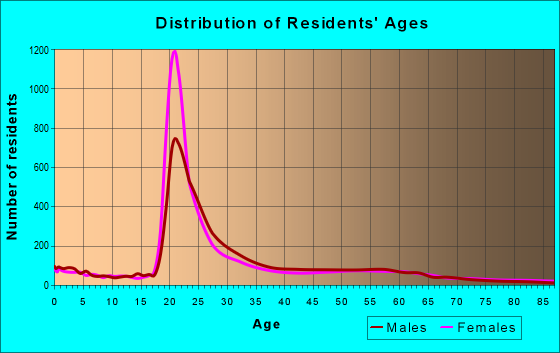
Median resident age:
This zip code:
23.0 years
Florida median age:
42.7 years
Average household size:
This zip code:
2.2 people
Florida:
2.5 people
Averages for the 2020 tax year for zip code 32601, filed in 2021:
Average Adjusted Gross Income (AGI) in 2020: $44,385 (Individual Income Tax Returns)
Here:
$44,385
State:
$82,200
Salary/wage: $37,440 (reported on 88.4% of returns)
Here:
$37,440
State:
$58,347
(% of AGI for various income ranges: 1267.1% for AGIs below $25k, 3970.3% for AGIs $25k-50k, 6794.3% for AGIs $50k-75k, 10985.9% for AGIs $75k-100k, 18556.7% for AGIs $100k-200k, 65242.0% for AGIs over 200k)
Taxable interest for individuals: $1,772 (reported on 19.3% of returns)
This zip code:
$1,772
Florida:
$4,272
(% of AGI for various income ranges: 6.8% for AGIs below $25k, 9.8% for AGIs $25k-50k, 61.3% for AGIs $50k-75k, 96.8% for AGIs $75k-100k, 168.1% for AGIs $100k-200k, 2302.0% for AGIs over 200k)
Ordinary dividends: $4,135 (reported on 14.1% of returns)
Here:
$4,135
State:
$15,863
(% of AGI for various income ranges: 10.9% for AGIs below $25k, 27.0% for AGIs $25k-50k, 55.8% for AGIs $50k-75k, 200.9% for AGIs $75k-100k, 546.2% for AGIs $100k-200k, 2960.0% for AGIs over 200k)
Net capital gain/loss in AGI: +$13,426 (reported on 14.2% of returns)
Here:
+$13,426
State:
+$62,983
(% of AGI for various income ranges: 9.1% for AGIs below $25k, 57.5% for AGIs $25k-50k, 79.8% for AGIs $50k-75k, 376.8% for AGIs $75k-100k, 1089.5% for AGIs $100k-200k, 17596.0% for AGIs over 200k)
Profit/loss from business: +$7,631 (reported on 15.5% of returns)
Here:
+$7,631
State:
+$9,719
(% of AGI for various income ranges: 84.9% for AGIs below $25k, 90.3% for AGIs $25k-50k, 123.3% for AGIs $50k-75k, 420.0% for AGIs $75k-100k, 451.9% for AGIs $100k-200k, 3986.0% for AGIs over 200k)
Taxable individual retirement arrangement distribution: $16,428 (reported on 3.5% of returns)
32601:
$16,428
Florida:
$24,823
(% of AGI for various income ranges: 9.9% for AGIs below $25k, 16.0% for AGIs $25k-50k, 74.5% for AGIs $50k-75k, 318.6% for AGIs $75k-100k, 703.3% for AGIs $100k-200k, 1910.0% for AGIs over 200k)
Total itemized deductions: $42,259 (reported on 2.4% of returns)
Here:
$42,259
State:
$45,393
(% of AGI for various income ranges: 71.8% for AGIs $25k-50k, 200.0% for AGIs $50k-75k, 504.3% for AGIs $100k-200k, 7568.0% for AGIs over 200k)
Charity contributions: $14,586 (reported on 2.0% of returns)
Here:
$14,586
State:
$20,178
(% of AGI for various income ranges: 17.8% for AGIs $25k-50k, 35.0% for AGIs $50k-75k, 113.8% for AGIs $100k-200k, 2620.0% for AGIs over 200k)
Taxes paid: $5,719 (reported on 2.3% of returns)
32601:
$5,719
State:
$6,967
(% of AGI for various income ranges: 9.2% for AGIs $25k-50k, 27.7% for AGIs $50k-75k, 111.0% for AGIs $100k-200k, 740.0% for AGIs over 200k)
Earned income credit: $1,880 (reported on 19.6% of returns)
Here:
$1,880
State:
$2,306
(% of AGI for various income ranges: 70.2% for AGIs below $25k, 42.1% for AGIs $25k-50k)
Percentage of individuals using paid preparers for their 2020 taxes: 93.2%
Here:
93%
State:
92%
(% for various income ranges: 93.5% for AGIs below $25k, 93.5% for AGIs $25k-50k, 93.8% for AGIs $50k-75k, 89.2% for AGIs $75k-100k, 92.5% for AGIs $100k-200k, 93.8% for AGIs over 200k)
Averages for the 2012 tax year for zip code 32601, filed in 2013:
Average Adjusted Gross Income (AGI) in 2012: $34,206 (Individual Income Tax Returns)
Here:
$34,206
State:
$60,316
Salary/wage: $28,882 (reported on 89.2% of returns)
Here:
$28,882
State:
$45,277
(% of AGI for various income ranges: 88.3% for AGIs below $25k, 88.2% for AGIs $25k-50k, 80.5% for AGIs $50k-75k, 74.3% for AGIs $75k-100k, 73.8% for AGIs $100k-200k, 40.6% for AGIs over 200k)
Taxable interest for individuals: $1,710 (reported on 18.1% of returns)
This zip code:
$1,710
Florida:
$3,587
(% of AGI for various income ranges: 0.8% for AGIs below $25k, 0.5% for AGIs $25k-50k, 0.8% for AGIs $50k-75k, 0.8% for AGIs $75k-100k, 0.8% for AGIs $100k-200k, 1.7% for AGIs over 200k)
Ordinary dividends: $5,207 (reported on 12.3% of returns)
Here:
$5,207
State:
$12,831
(% of AGI for various income ranges: 1.2% for AGIs below $25k, 1.4% for AGIs $25k-50k, 1.5% for AGIs $50k-75k, 2.1% for AGIs $75k-100k, 2.7% for AGIs $100k-200k, 2.8% for AGIs over 200k)
Net capital gain/loss in AGI: +$13,193 (reported on 8.8% of returns)
Here:
+$13,193
State:
+$33,493
(% of AGI for various income ranges: 0.4% for AGIs $25k-50k, 1.7% for AGIs $100k-200k, 16.4% for AGIs over 200k)
Profit/loss from business: +$9,804 (reported on 12.8% of returns)
Here:
+$9,804
State:
+$10,012
(% of AGI for various income ranges: 4.9% for AGIs below $25k, 2.4% for AGIs $25k-50k, 2.8% for AGIs $50k-75k, 5.7% for AGIs $75k-100k, 1.6% for AGIs $100k-200k, 5.2% for AGIs over 200k)
Taxable individual retirement arrangement distribution: $13,574 (reported on 3.5% of returns)
32601:
$13,574
Florida:
$21,544
(% of AGI for various income ranges: 0.6% for AGIs below $25k, 0.9% for AGIs $25k-50k, 2.8% for AGIs $50k-75k, 4.8% for AGIs $100k-200k)
Total itemized deductions: $19,747 (19% of AGI, reported on 11.4% of returns)
Here:
$19,747
State:
$25,533
Here:
19.0% of AGI
State:
18.0% of AGI
(% of AGI for various income ranges: 3.4% for AGIs below $25k, 5.5% for AGIs $25k-50k, 7.8% for AGIs $50k-75k, 8.0% for AGIs $75k-100k, 8.7% for AGIs $100k-200k, 8.8% for AGIs over 200k)
Charity contributions: $5,510 (reported on 7.9% of returns)
Here:
$5,510
State:
$5,698
(% of AGI for various income ranges: 0.3% for AGIs below $25k, 0.5% for AGIs $25k-50k, 1.2% for AGIs $50k-75k, 0.8% for AGIs $75k-100k, 2.0% for AGIs $100k-200k, 3.2% for AGIs over 200k)
Taxes paid: $4,833 (reported on 10.5% of returns)
32601:
$4,833
State:
$6,203
(% of AGI for various income ranges: 0.6% for AGIs below $25k, 0.9% for AGIs $25k-50k, 1.5% for AGIs $50k-75k, 2.0% for AGIs $75k-100k, 2.1% for AGIs $100k-200k, 2.7% for AGIs over 200k)
Earned income credit: $1,795 (reported on 23.3% of returns)
Here:
$1,795
State:
$2,372
(% of AGI for various income ranges: 4.7% for AGIs below $25k, 0.8% for AGIs $25k-50k)
Percentage of individuals using paid preparers for their 2012 taxes: 30.5%
Here:
30%
State:
54%
(% for various income ranges: 27.4% for AGIs below $25k, 30.1% for AGIs $25k-50k, 36.0% for AGIs $50k-75k, 40.0% for AGIs $75k-100k, 47.8% for AGIs $100k-200k, 77.8% for AGIs over 200k)
Averages for the 2004 tax year for zip code 32601, filed in 2005:
Average Adjusted Gross Income (AGI) in 2004: $26,014 (Individual Income Tax Returns)
Here:
$26,014
State:
$50,523
Salary/wage: $22,311 (reported on 90.4% of returns)
Here:
$22,311
State:
$39,563
(% of AGI for various income ranges: 114.8% for AGIs below $10k, 89.9% for AGIs $10k-25k, 89.6% for AGIs $25k-50k, 78.0% for AGIs $50k-75k, 74.3% for AGIs $75k-100k, 46.8% for AGIs over 100k)
Taxable interest for individuals: $1,701 (reported on 22.4% of returns)
This zip code:
$1,701
Florida:
$3,211
(% of AGI for various income ranges: 1.6% for AGIs below $10k, 1.0% for AGIs $10k-25k, 0.9% for AGIs $25k-50k, 2.1% for AGIs $50k-75k, 1.9% for AGIs $75k-100k, 2.1% for AGIs over 100k)
Taxable dividends: $3,179 (reported on 12.4% of returns)
Here:
$3,179
State:
$6,129
(% of AGI for various income ranges: 1.2% for AGIs below $10k, 0.8% for AGIs $10k-25k, 0.8% for AGIs $25k-50k, 1.1% for AGIs $50k-75k, 1.5% for AGIs $75k-100k, 3.2% for AGIs over 100k)
Net capital gain/loss: +$13,450 (reported on 9.9% of returns)
Here:
+$13,450
State:
+$27,205
(% of AGI for various income ranges: -0.6% for AGIs below $10k, 0.3% for AGIs $10k-25k, 0.8% for AGIs $25k-50k, 1.8% for AGIs $50k-75k, 1.1% for AGIs $75k-100k, 17.8% for AGIs over 100k)
Profit/loss from business: +$8,374 (reported on 10.4% of returns)
Here:
+$8,374
State:
+$10,634
(% of AGI for various income ranges: 3.6% for AGIs below $10k, 2.6% for AGIs $10k-25k, 1.5% for AGIs $25k-50k, 4.5% for AGIs $50k-75k, 4.4% for AGIs $75k-100k, 4.9% for AGIs over 100k)
IRA payment deduction: $2,484 (reported on 1.5% of returns)
32601:
$2,484
Florida:
$3,082
(% of AGI for various income ranges: 0.2% for AGIs $10k-25k, 0.2% for AGIs $25k-50k, 0.2% for AGIs $50k-75k, 0.5% for AGIs $75k-100k)
Self-employed pension: $12,550 (reported on 0.3% of returns)
Here:
$12,550
Florida:
$15,857
Total itemized deductions: $13,686 (21% of AGI, reported on 13.1% of returns)
Here:
$13,686
State:
$20,370
Here:
20.7% of AGI
State:
20.7% of AGI
(% of AGI for various income ranges: 5.3% for AGIs below $10k, 4.2% for AGIs $10k-25k, 6.2% for AGIs $25k-50k, 7.5% for AGIs $50k-75k, 11.5% for AGIs $75k-100k, 8.8% for AGIs over 100k)
Charity contributions deductions: $3,591 (4% of AGI, reported on 8.3% of returns)
Here:
$3,591
State:
$4,064
Here:
4.2% of AGI
State:
3.8% of AGI
(% of AGI for various income ranges: 0.1% for AGIs below $10k, 0.3% for AGIs $10k-25k, 0.9% for AGIs $25k-50k, 1.4% for AGIs $50k-75k, 2.1% for AGIs $75k-100k, 2.0% for AGIs over 100k)
Total tax: $4,195 (reported on 65.9% of returns)
32601:
$4,195
State:
$9,431
(% of AGI for various income ranges: 2.0% for AGIs below $10k, 4.4% for AGIs $10k-25k, 7.9% for AGIs $25k-50k, 11.7% for AGIs $50k-75k, 13.0% for AGIs $75k-100k, 19.7% for AGIs over 100k)
Earned income credit: $1,471 (reported on 22.1% of returns)
Here:
$1,471
State:
$1,808
Percentage of individuals using paid preparers for their 2004 taxes: 38.3%
Here:
38%
State:
60%
(% for various income ranges: 32.5% for AGIs below $10k, 41.1% for AGIs $10k-25k, 37.2% for AGIs $25k-50k, 45.0% for AGIs $50k-75k, 45.5% for AGIs $75k-100k, 58.8% for AGIs over 100k)
Likely homosexual households (counted as self-reported same-sex unmarried-partner households)
Lesbian couples: 0.3% of all households
Gay men: 0.3% of all households
Household received Food Stamps/SNAP in the past 12 months: 828 Household did not receive Food Stamps/SNAP in the past 12 months: 8,720
Women who had a birth in the past 12 months: 228 (56 now married, 160 unmarried) Women who did not have a birth in the past 12 months: 9,436 (824 now married, 8,600 unmarried)
Housing units in zip code 32601 with a mortgage: 1,142 (69 second mortgage, 69 both second mortgage and home equity loan) Houses without a mortgage: 25
Median monthly owner costs for units with a mortgage: $1,625 Median monthly owner costs for units without a mortgage: $490
Residents with income below the poverty level in 2022:
This zip code:
47.6%
Whole state:
12.7%
Residents with income below 50% of the poverty level in 2022:
This zip code:
13.8%
Whole state:
6.6%
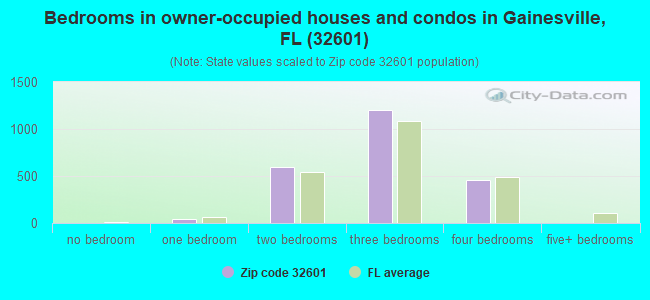
Median number of rooms in houses and condos:
Here:
5.8
State:
5.9
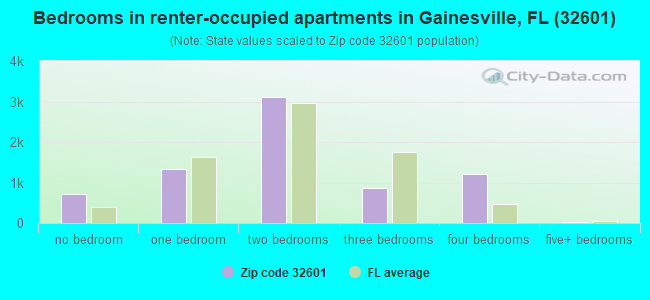
Median number of rooms in apartments:
Here:
4.0
State:
4.2
Notable locations in this zip code not listed on our city pages
Notable locations in zip code 32601: Central Plaza (A), Main Street Wastewater Treatment Plant (B), Tungroc Railroad Station (C), Janes Railroad Station (D), Gainesville Central Police Station (E), Alachua County Fire Department Headquarters (F), Gainesville Regional Utilities (G), Alachua County Schools Administration Building (H), Gainesville Fire and Rescue Station 1 (I), Alachua County Administration Building (J), Ayers Medical Plaza (K), Gainesville Chamber of Commerce (L), Gainesville Fire and Rescue Training (M), Alachua County Court (N), Alachua County Sheriff's Office - Civil (O), Porters Community Center (P), Pride Community Center (Q), Hippodrome State Theatre (R), Alachua County Law Library Murphree Law Library (S), Alachua County Library District Headquarters at Gainesville (T). Display/hide their locations on the map
Shopping Centers: Creekside Mall (1), Millhopper Shopping Center (2), Biven Arm Shopping Center (3), Gainesville Shopping Center (4), Village Shopping Center (5), Southeast Shopping Center (6). Display/hide their locations on the map
Churches in zip code 32601 include: Zion Temple African Methodist Episcopal Zion Church (A), Visionaries Church of God in Christ (B), The Church of Jesus Christ of Latter Day Saints (C), Shady Grove Primitive Baptist Church (D), Refuge Church of Our Lord Jesus Christ of the Apostolic Faith (E), Progressive Church (F), Pleasant Hill Baptist Church (G), Mount Hermon Missionary Baptist Church (H), Kingdom Hall of Jehovahs Witnesses Southside and Northeast Gainesville (I). Display/hide their locations on the map
608 married couples with children.
1,334 single-parent households (461 men, 873 women).
81.9% of residents of 32601 zip code speak English at home.
9.7% of residents speak Spanish at home (97% very well, 3% well).
4.8% of residents speak other Indo-European language at home (64% very well, 22% well, 13% not well, 1% not at all).
2.2% of residents speak Asian or Pacific Island language at home (59% very well, 15% well, 13% not well, 13% not at all).
0.4% of residents speak other language at home (81% very well, 19% well).
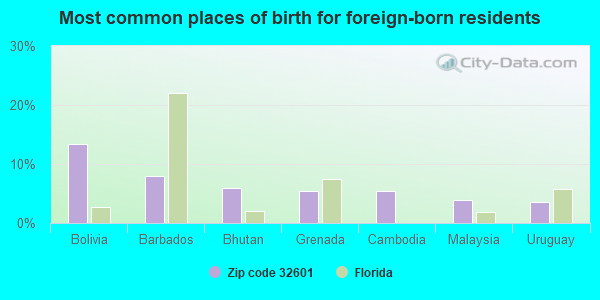
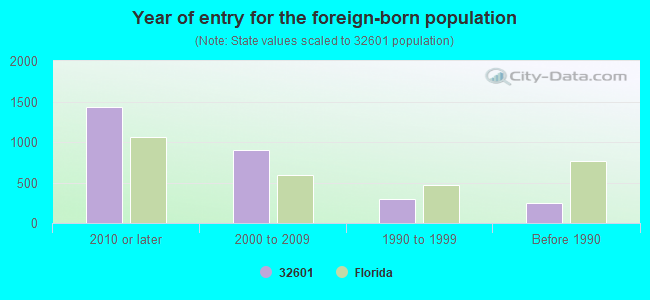
Foreign born population: 2,389 (10.3%) (37.1% of them are naturalized citizens)
Major facilities with environmental interests located in this zip code:
JOHN WAGNER AUTO REPAIR (519 S MAIN ST in GAINESVILLE, FL)
STATE MASTER (FDM) - CHAZ-FLD984245688, HAZARDOUS WASTE REGULATION PROGRAM (Resource Conservation and Recovery Act (tracking hazardous waste)) Business SIC classification: GENERAL AUTOMOTIVE REPAIR SHOPS Business NAICS classification: GENERAL AUTOMOTIVE REPAIR. Alternative names: IDEAL PAINT & BODY
A. Q. JONES/EXCEPTIONAL STUDENT CENTER (1108 NW 7TH AVE in GAINESVILLE, FL)
(National Center for Education Statistics) - STATE ID-0052 Organizations: ALACHUA COUNTY SCHOOL DISTRICT (SCHOOL DISTRICT)
PACE (1010 SE 4TH AVENUE in GAINESVILLE, FL)
(National Center for Education Statistics) - STATE ID-0604 Organizations: ALACHUA COUNTY SCHOOL DISTRICT (SCHOOL DISTRICT)
COUNTY SUPERINTENDENT'S OFFICE (620 E. UNIVERSITY AVENUE in GAINESVILLE, FL)
(National Center for Education Statistics) - STATE ID-9001 Organizations: ALACHUA COUNTY SCHOOL DISTRICT (SCHOOL DISTRICT)
P.K. YONGE DEVELOPMENTAL RESEARCH SCHOOL (1080 SW 11TH STREET in GAINESVILLE, FL)
(National Center for Education Statistics) - STATE ID-0391 Organizations: UNIVERSITY OF FLORIDA LABORATORY SCHOOL (SCHOOL DISTRICT)
SR 24 207843-1 (SR 24 AIRPORT TO WALDO in GAINESVILLE, FL)
National Pollutant Discharge Elimination System NON-MAJOR (Tracking pollutant discharge elimination systems) - permit Organizations: J MACLAUGHLIN (CONTACT/OWNER)
AMOCO STATION NO 432 (1255 WEST UNIVERSITY AVENUE in GAINESVILLE, FL)
National Pollutant Discharge Elimination System NON-MAJOR (Tracking pollutant discharge elimination systems) - permit Small Quantity Generators, between 100 kg and 1000 kg of hazardous waste/month (Resource Conservation and Recovery Act (tracking hazardous waste)) - notification Business SIC classification: GASOLINE SERVICE STATIONS Organizations: PATEL MAHESH, CEO (CONTACT/OWNER)
Alternative names: CAMPUS AMOCO INC #432, HANDEX OF FLORIDA, INC.
I-75 @ SR 26 LANDSCAPE (I-75 @ SR 26FIN PROJECT # 4046 in GAINESVILLE, FL)
National Pollutant Discharge Elimination System NON-MAJOR (Tracking pollutant discharge elimination systems) - permit Organizations: FRANKIE VALDEZ (CONTACT/OWNER)
KINGS DIAGNOSTIC IMAGING INC (1315 SE 1ST ST in GAINESVILLE, FL)
(Resource Conservation and Recovery Act (tracking hazardous waste)) Organizations: DAVID GRAHAM, BRANCH MGR (CONTACT/OWNER)
KINGS X RAY SUPPLY CORP (3427 SW 42 WAY in GAINESVILLE, FL)
(Resource Conservation and Recovery Act (tracking hazardous waste)) Organizations: DAVID GRAHAM, BRANCH MGR (CONTACT/OWNER)
ALACHUA CO COLLECTION CENTER (6777 NEWBERRY RD in GAINESVILLE, FL)
(Resource Conservation and Recovery Act (tracking hazardous waste)) Organizations: LUSK RICHARD ENV ENG (CONTACT/OWNER)
LITTLE RIVER MARINE (250 SE 10TH AVE in GAINESVILLE, FL)
(Resource Conservation and Recovery Act (tracking hazardous waste)) Business NAICS classification: BOAT BUILDING. Organizations: WILLIAM LARSON, PRES (CONTACT/OWNER)
M & M CLEANERS (1511 NE 3RD AVE in GAINESVILLE, FL)
(Resource Conservation and Recovery Act (tracking hazardous waste)) Organizations: ALFRED MCNIGHT (CONTACT/OWNER)
Housing units lacking complete plumbing facilities: 2.3% Housing units lacking complete kitchen facilities: 3.2%
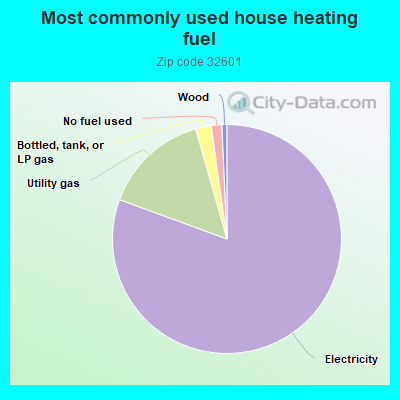
80.6%Electricity
15.0%Utility gas
2.2%Bottled, tank, or LP gas
1.5%No fuel used
0.7%Wood
Population in 1990: 31,328.
Place of birth for U.S.-born residents:
This state: 13,212
Northeast: 2,394
Midwest: 1,143
South: 2,099
West: 1,419
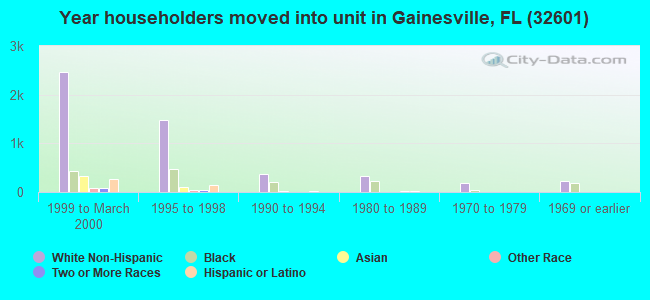
27% of the 32601 zip code residents lived in the same house 5 years ago. Out of people who lived in different houses, 30% lived in this county. Out of people who lived in different counties, 50% lived in Florida.
72% of the 32601 zip code residents lived in the same house 1 year ago. Out of people who lived in different houses, 47% moved from this county. Out of people who lived in different houses, 18% moved from different county within same state. Out of people who lived in different houses, 22% moved from different state. Out of people who lived in different houses, 9% moved from abroad.
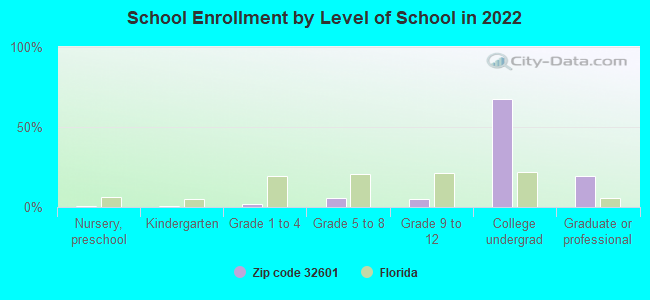
Private vs. public school enrollment:
Students in private schools in grades 1 to 8 (elementary and middle school): 195
Here:
19.9%
Florida:
15.8%
Students in private schools in grades 9 to 12 (high school): 45
Here:
7.3%
Florida:
12.9%
Students in private undergraduate colleges: 325
Here:
3.8%
Florida:
23.6%
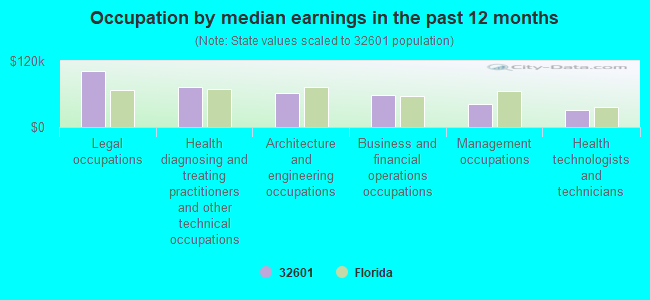
Occupation by median earnings in the past 12 months ($)
101,261Legal occupations
73,053Health diagnosing and treating practitioners and other technical occupations
61,946Architecture and engineering occupations
57,858Business and financial operations occupations
41,358Management occupations
31,517Health technologists and technicians
Companies with federal contracts located in this zip code:
UNIVERSITY OF FLORIDA (720 SW 2ND AVE STE 305 in GAINESVILLE, FL; small business) : $546,819 in 7 contractsfrom 2000 to 2002
Contracts for Other Professional Services, Other ADP and Telecommunications Services (includes data storage on tapes, compact disks, etc.), Intelligence Studies by Department of Defense, Navy Signed by year:2000: $164,819; 2001: $277,000; 2002: $105,000; 2003: $0; 2004: $0; 2005: $0; 2006: $0.
Biggest contracts:
$202,000 with Department of Defense for Other Professional Services. Taking place in DC. Signed on 2001-12-13. Completion date: 2002-09-30.
$199,500 with Department of Defense for Other ADP and Telecommunications Services (includes data storage on tapes, compact disks, etc.). Taking place in DC. Signed on 2002-05-02. Completion date: 2002-09-30.
$104,000 with Department of Defense for Intelligence Studies. Signed on 2002-07-19. Completion date: 2003-07-31.
$99,919 with Navy for Other Professional Services. Signed on 2000-02-29. Completion date: 2000-07-31.
UNIVERSITY OF FLORIDA (720 SW 2ND AVE STE 305 in GAINESVILLE, FL; small business) : $389,000 in 3 contractsfrom 1999 to 2002
$300,000 with Department of Defense for Technology Studies. Signed on 2001-01-25. Completion date: 2001-11-30.
$90,000, same as above.Signed on 2002-04-29. Completion date: 2003-04-30.
-$1,000 with National Institute of Standards and Technology for Program Management/Support Services. Signed on 1999-12-15. Completion date: 1998-09-15.
EAST COAST FRUIT COMPANY INC (1040 SE 4TH ST in GAINESVILLE, FL; small business) : $227,588 in 31 contractsfrom 2004 to 2006
Contracts for Fruits and Vegetables by Defense Logistics Agency Signed by year:2000: $0; 2001: $0; 2002: $0; 2003: $0; 2004: $62,780; 2005: $141,607; 2006: $23,201.
Biggest contracts:
$12,555 with Defense Logistics Agency for Fruits and Vegetables. Signed on 2005-10-05. Completion date: 2005-10-05.
$11,238, same as above.Signed on 2005-09-29. Completion date: 2005-09-29.
$11,172, same as above.Signed on 2005-10-16. Completion date: 2005-10-16.
$10,788, same as above.Signed on 2005-10-27. Completion date: 2005-10-27.
DATAGRID, INC (1022 NW 2ND ST in GAINESVILLE, FL; small business) : $12,402 in 2 contractsin 2005
$6,201 with Army for Miscellaneous Communication Equipment. Signed on 2005-08-26. Completion date: 2005-09-23.
$6,201 with U.S. Army Corps of Engineers - civil program financing only for Miscellaneous Communication Equipment. Signed on 2005-08-26. Completion date: 2005-09-23.
JAM Construction, inc. (521 SE 11th Ave in Gainesville, FL; small business) 25 employees, $0 revenue: $9,976 in 4 contractsfrom 1999 to 2006
$4,090 with Agricultural Research Service for Construction of Structures and Facilities -- Government-Owned Government-Operated (GOGO) R&D Facilities. Signed on 2003-09-15. Completion date: 2003-10-15.
$3,000 with Agricultural Research Service (disused code) for Construction of Structures and Facilities -- Government-Owned Government-Operated (GOGO) R&D Facilities. Signed on 1999-12-15. Completion date: 1999-12-15.
$1,886 with Agricultural Research Service for Maintenance, Repair or Alteration of Real Property -- Government-Owned Government-Operated (GOGO) R&D Facilities. Signed on 2006-03-03. Completion date: 2006-03-24.
$1,000 with Agricultural Research Service (disused code) for Maintenance, Repair or Alteration of Real Property -- Government-Owned Government-Operated (GOGO) R&D Facilities. Signed on 2000-01-15. Completion date: 2000-01-15.
Top industries in this zip code by the number of employees in 2005:
Health Care and Social Assistance: General Medical and Surgical Hospitals (over 1000 employees: 1 establishment)
Other Services (except Public Administration): Other Similar Organizations (except Business, Professional, Labor, and Political Organizations) (500-999: 1, 1-4: 1)
Professional, Scientific, and Technical Services: Offices of Lawyers (50-99: 1, 20-49: 4, 10-19: 6, 5-9: 23, 1-4: 56)
Administrative and Support and Waste Management and Remediation Services: Temporary Help Services (250-499: 1, 50-99: 2)
Health Care and Social Assistance: Child Day Care Services (100-249: 1, 20-49: 1, 10-19: 3, 5-9: 4, 1-4: 5)
Health Care and Social Assistance: Offices of Physicians (except Mental Health Specialists) (20-49: 3, 10-19: 3, 5-9: 14, 1-4: 16)
Health Care and Social Assistance: Blood and Organ Banks (100-249: 1, 20-49: 2)
People in group quarters in 2010:
1,038 people in college/university student housing
352 people in other noninstitutional facilities
117 people in nursing facilities/skilled-nursing facilities
104 people in emergency and transitional shelters (with sleeping facilities) for people experiencing homelessness
15 people in group homes intended for adults
11 people in group homes for juveniles (non-correctional)
People in group quarters in 2000:
897 people in college dormitories (includes college quarters off campus)
154 people in other noninstitutional group quarters
92 people in nursing homes
81 people in other group homes
11 people in homes for the mentally retarded
8 people in homes for the mentally ill
Fatal accident statistics in 2012:
Fatal accident count: 1
Vehicles involved in fatal accidents: 1
Fatal accidents caused by drunken drivers: 0
Fatalities: 1
Persons involved in fatal accidents: 1
Pedestrians involved in fatal accidents: 1
Fatal accident statistics in 2011:
Fatal accident count: 2
Vehicles involved in fatal accidents: 2
Fatal accidents caused by drunken drivers: 0
Fatalities: 2
Persons involved in fatal accidents: 2
Pedestrians involved in fatal accidents: 1
Home Mortgage Disclosure Act Aggregated Statistics For Year 2009 (Based on 4 full and 4 partial tracts)
A) FHA, FSA/RHS & VA Home Purchase Loans
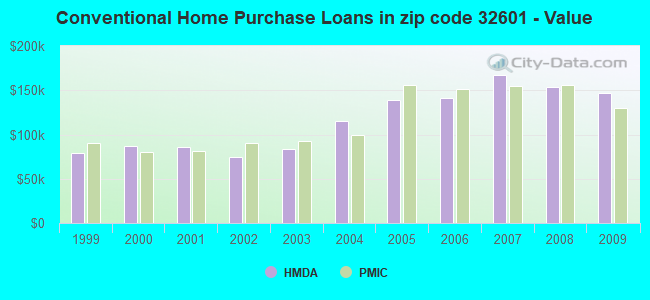
B) Conventional Home Purchase Loans
C) Refinancings
D) Home Improvement Loans
E) Loans on Dwellings For 5+ Families
F) Non-occupant Loans on < 5 Family Dwellings (A B C & D)
G) Loans On Manufactured Home Dwelling (A B C & D)
Number
Average Value
Number
Average Value
Number
Average Value
Number
Average Value
Number
Average Value
Number
Average Value
Number
Average Value
LOANS ORIGINATED
42
$125,221
71
$146,896
145
$153,635
9
$43,150
6
$5,002,645
78
$140,819
0
$0
APPLICATIONS APPROVED, NOT ACCEPTED
2
$123,485
4
$363,310
19
$151,807
1
$59,260
0
$0
4
$136,988
0
$0
APPLICATIONS DENIED
17
$117,446
16
$120,068
91
$138,420
31
$26,093
0
$0
24
$149,846
2
$36,700
APPLICATIONS WITHDRAWN
13
$138,262
11
$132,826
60
$171,039
4
$87,820
0
$0
15
$168,707
4
$159,138
FILES CLOSED FOR INCOMPLETENESS
0
$0
8
$129,023
22
$134,191
2
$121,555
0
$0
3
$108,947
0
$0
Aggregated Statistics For Year 2008 (Based on 4 full and 4 partial tracts)
A) FHA, FSA/RHS & VA Home Purchase Loans
B) Conventional Home Purchase Loans
C) Refinancings
D) Home Improvement Loans
E) Loans on Dwellings For 5+ Families
F) Non-occupant Loans on < 5 Family Dwellings (A B C & D)
G) Loans On Manufactured Home Dwelling (A B C & D)
Number
Average Value
Number
Average Value
Number
Average Value
Number
Average Value
Number
Average Value
Number
Average Value
Number
Average Value
LOANS ORIGINATED
25
$134,123
123
$153,110
117
$121,485
13
$54,978
13
$2,398,518
95
$150,577
4
$59,248
APPLICATIONS APPROVED, NOT ACCEPTED
2
$197,720
26
$160,567
15
$90,916
9
$24,440
0
$0
12
$116,962
2
$78,345
APPLICATIONS DENIED
10
$108,478
37
$149,416
110
$123,582
34
$70,232
2
$99,990
54
$121,478
5
$54,252
APPLICATIONS WITHDRAWN
9
$146,333
18
$128,916
38
$144,219
26
$37,381
0
$0
25
$140,382
0
$0
FILES CLOSED FOR INCOMPLETENESS
2
$241,975
7
$161,136
5
$47,984
1
$82,270
0
$0
4
$113,468
2
$14,000
Aggregated Statistics For Year 2007 (Based on 4 full and 4 partial tracts)
A) FHA, FSA/RHS & VA Home Purchase Loans
B) Conventional Home Purchase Loans
C) Refinancings
D) Home Improvement Loans
E) Loans on Dwellings For 5+ Families
F) Non-occupant Loans on < 5 Family Dwellings (A B C & D)
G) Loans On Manufactured Home Dwelling (A B C & D)
Number
Average Value
Number
Average Value
Number
Average Value
Number
Average Value
Number
Average Value
Number
Average Value
Number
Average Value
LOANS ORIGINATED
11
$128,814
364
$166,856
214
$135,726
38
$87,218
20
$1,161,466
263
$167,316
0
$0
APPLICATIONS APPROVED, NOT ACCEPTED
0
$0
54
$128,893
60
$136,515
8
$74,095
0
$0
36
$134,135
4
$136,278
APPLICATIONS DENIED
2
$154,455
71
$113,538
218
$115,143
41
$65,505
1
$444,480
81
$144,898
9
$72,367
APPLICATIONS WITHDRAWN
2
$112,620
40
$133,072
92
$105,007
12
$82,049
0
$0
24
$114,135
0
$0
FILES CLOSED FOR INCOMPLETENESS
0
$0
15
$207,283
28
$176,833
2
$35,330
2
$433,955
5
$184,962
0
$0
Aggregated Statistics For Year 2006 (Based on 4 full and 4 partial tracts)
A) FHA, FSA/RHS & VA Home Purchase Loans
B) Conventional Home Purchase Loans
C) Refinancings
D) Home Improvement Loans
E) Loans on Dwellings For 5+ Families
F) Non-occupant Loans on < 5 Family Dwellings (A B C & D)
G) Loans On Manufactured Home Dwelling (A B C & D)
Number
Average Value
Number
Average Value
Number
Average Value
Number
Average Value
Number
Average Value
Number
Average Value
Number
Average Value
LOANS ORIGINATED
15
$126,330
495
$141,437
251
$121,612
43
$89,813
9
$3,205,848
342
$138,537
0
$0
APPLICATIONS APPROVED, NOT ACCEPTED
2
$47,985
91
$124,539
61
$111,280
6
$30,193
0
$0
60
$110,026
2
$57,750
APPLICATIONS DENIED
4
$128,778
179
$117,327
207
$121,350
31
$64,100
0
$0
133
$122,187
9
$47,470
APPLICATIONS WITHDRAWN
2
$119,475
66
$114,876
124
$116,387
4
$71,285
1
$423,000
35
$192,433
0
$0
FILES CLOSED FOR INCOMPLETENESS
0
$0
16
$135,982
25
$112,676
4
$32,808
0
$0
5
$171,944
0
$0
Aggregated Statistics For Year 2005 (Based on 4 full and 4 partial tracts)
A) FHA, FSA/RHS & VA Home Purchase Loans
B) Conventional Home Purchase Loans
C) Refinancings
D) Home Improvement Loans
E) Loans on Dwellings For 5+ Families
F) Non-occupant Loans on < 5 Family Dwellings (A B C & D)
G) Loans On Manufactured Home Dwelling (A B C & D)
Number
Average Value
Number
Average Value
Number
Average Value
Number
Average Value
Number
Average Value
Number
Average Value
Number
Average Value
LOANS ORIGINATED
6
$107,117
626
$139,437
278
$99,922
38
$66,729
6
$587,653
379
$152,544
6
$49,097
APPLICATIONS APPROVED, NOT ACCEPTED
0
$0
92
$131,090
38
$107,501
8
$58,584
0
$0
54
$126,915
2
$109,230
APPLICATIONS DENIED
6
$109,373
174
$105,400
225
$94,680
37
$55,888
2
$377,030
100
$117,230
23
$36,835
APPLICATIONS WITHDRAWN
2
$72,470
70
$132,158
138
$93,164
31
$112,526
2
$367,240
77
$128,574
2
$14,690
FILES CLOSED FOR INCOMPLETENESS
0
$0
23
$124,664
37
$119,372
2
$75,785
0
$0
10
$121,460
0
$0
Aggregated Statistics For Year 2004 (Based on 4 full and 4 partial tracts)
A) FHA, FSA/RHS & VA Home Purchase Loans
B) Conventional Home Purchase Loans
C) Refinancings
D) Home Improvement Loans
E) Loans on Dwellings For 5+ Families
F) Non-occupant Loans on < 5 Family Dwellings (A B C & D)
G) Loans On Manufactured Home Dwelling (A B C & D)
Number
Average Value
Number
Average Value
Number
Average Value
Number
Average Value
Number
Average Value
Number
Average Value
Number
Average Value
LOANS ORIGINATED
21
$94,427
401
$114,750
354
$88,548
42
$51,165
7
$3,755,440
214
$98,014
0
$0
APPLICATIONS APPROVED, NOT ACCEPTED
3
$66,813
53
$128,606
59
$83,558
4
$10,790
0
$0
16
$114,073
4
$78,680
APPLICATIONS DENIED
7
$143,144
104
$88,907
168
$84,394
47
$30,512
0
$0
52
$94,526
25
$39,054
APPLICATIONS WITHDRAWN
3
$111,233
63
$117,877
145
$89,658
20
$60,387
0
$0
36
$116,188
0
$0
FILES CLOSED FOR INCOMPLETENESS
2
$82,260
9
$148,351
36
$94,476
2
$88,935
0
$0
4
$80,462
0
$0
Aggregated Statistics For Year 2003 (Based on 4 full and 4 partial tracts)
A) FHA, FSA/RHS & VA Home Purchase Loans
B) Conventional Home Purchase Loans
C) Refinancings
D) Home Improvement Loans
E) Loans on Dwellings For 5+ Families
F) Non-occupant Loans on < 5 Family Dwellings (A B C & D)
Number
Average Value
Number
Average Value
Number
Average Value
Number
Average Value
Number
Average Value
Number
Average Value
LOANS ORIGINATED
40
$78,382
367
$83,275
550
$89,445
18
$47,774
4
$839,892
225
$85,000
APPLICATIONS APPROVED, NOT ACCEPTED
2
$64,145
61
$81,755
91
$73,598
7
$31,054
0
$0
26
$68,781
APPLICATIONS DENIED
11
$77,670
141
$50,634
203
$71,497
22
$23,773
0
$0
64
$64,815
APPLICATIONS WITHDRAWN
11
$70,810
41
$100,397
96
$99,122
3
$25,340
0
$0
13
$81,736
FILES CLOSED FOR INCOMPLETENESS
2
$64,995
8
$76,191
24
$74,586
2
$34,275
0
$0
4
$31,890
Aggregated Statistics For Year 2002 (Based on 4 full and 4 partial tracts)
A) FHA, FSA/RHS & VA Home Purchase Loans
B) Conventional Home Purchase Loans
C) Refinancings
D) Home Improvement Loans
E) Loans on Dwellings For 5+ Families
F) Non-occupant Loans on < 5 Family Dwellings (A B C & D)
Number
Average Value
Number
Average Value
Number
Average Value
Number
Average Value
Number
Average Value
Number
Average Value
LOANS ORIGINATED
38
$73,125
265
$74,017
284
$92,689
21
$59,470
4
$226,582
140
$97,075
APPLICATIONS APPROVED, NOT ACCEPTED
0
$0
54
$47,672
38
$50,783
10
$18,628
0
$0
17
$52,521
APPLICATIONS DENIED
5
$58,274
113
$45,978
138
$65,417
15
$28,053
2
$143,985
24
$84,472
APPLICATIONS WITHDRAWN
6
$74,292
28
$129,158
82
$75,811
2
$34,275
0
$0
12
$60,616
FILES CLOSED FOR INCOMPLETENESS
2
$74,990
4
$50,922
17
$117,308
2
$9,795
0
$0
2
$97,990
Aggregated Statistics For Year 2001 (Based on 4 full and 4 partial tracts)
A) FHA, FSA/RHS & VA Home Purchase Loans
B) Conventional Home Purchase Loans
C) Refinancings
D) Home Improvement Loans
E) Loans on Dwellings For 5+ Families
F) Non-occupant Loans on < 5 Family Dwellings (A B C & D)
Number
Average Value
Number
Average Value
Number
Average Value
Number
Average Value
Number
Average Value
Number
Average Value
LOANS ORIGINATED
33
$72,629
202
$85,575
223
$76,935
31
$29,213
1
$813,540
94
$80,005
APPLICATIONS APPROVED, NOT ACCEPTED
2
$61,695
40
$60,054
32
$83,614
8
$34,679
0
$0
17
$55,994
APPLICATIONS DENIED
9
$55,414
61
$56,135
129
$59,546
20
$11,523
0
$0
28
$66,709
APPLICATIONS WITHDRAWN
2
$74,615
26
$77,291
111
$70,636
16
$21,149
2
$144,935
11
$70,754
FILES CLOSED FOR INCOMPLETENESS
0
$0
7
$86,801
25
$88,924
0
$0
0
$0
5
$90,340
Aggregated Statistics For Year 2000 (Based on 4 full and 4 partial tracts)
A) FHA, FSA/RHS & VA Home Purchase Loans
B) Conventional Home Purchase Loans
C) Refinancings
D) Home Improvement Loans
E) Loans on Dwellings For 5+ Families
F) Non-occupant Loans on < 5 Family Dwellings (A B C & D)
Number
Average Value
Number
Average Value
Number
Average Value
Number
Average Value
Number
Average Value
Number
Average Value
LOANS ORIGINATED
26
$64,415
200
$87,147
93
$66,113
28
$18,624
4
$779,445
94
$66,746
APPLICATIONS APPROVED, NOT ACCEPTED
2
$52,880
26
$77,870
36
$79,199
4
$46,550
0
$0
11
$93,179
APPLICATIONS DENIED
7
$61,907
78
$47,217
100
$46,334
40
$10,828
2
$218,980
27
$53,771
APPLICATIONS WITHDRAWN
4
$67,482
12
$61,652
79
$49,566
7
$13,210
0
$0
6
$49,350
FILES CLOSED FOR INCOMPLETENESS
2
$76,360
11
$96,391
7
$32,656
0
$0
0
$0
6
$52,573
Aggregated Statistics For Year 1999 (Based on 3 full and 2 partial tracts)
A) FHA, FSA/RHS & VA Home Purchase Loans
B) Conventional Home Purchase Loans
C) Refinancings
D) Home Improvement Loans
E) Loans on Dwellings For 5+ Families
F) Non-occupant Loans on < 5 Family Dwellings (A B C & D)
2004 - 2018 National Fire Incident Reporting System (NFIRS) incidents
Based on the data from the years 2004 - 2018 the average number of fire incidents per year is 399. The highest number of reported fires - 559 took place in 2006, and the least - 313 in 2011. The data has a dropping trend.
When looking into fire subcategories, the most incidents belonged to: Outside Fires (42.8%), and Structure Fires (40.7%).
Fire incident types reported to NFIRS in Zip Code 32601


 Nearest zip codes: 32603, 32612, 32605, 32641, 32607, 32608.
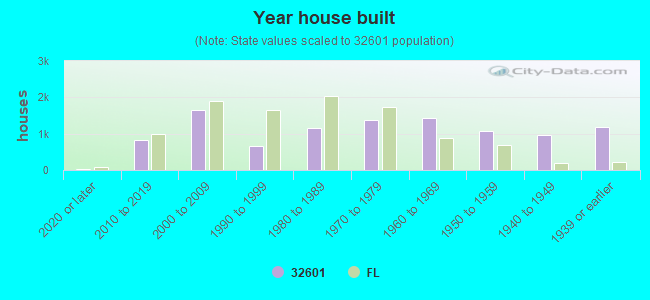


 Based on the data from the years 2004 - 2018 the average number of fire incidents per year is 399. The highest number of reported fires - 559 took place in 2006, and the least - 313 in 2011. The data has a dropping trend.
 When looking into fire subcategories, the most incidents belonged to: Outside Fires (42.8%), and Structure Fires (40.7%).