Estimated zip code population in 2022: 3,272 Zip code population in 2010: 3,328 Zip code population in 2000: 3,181
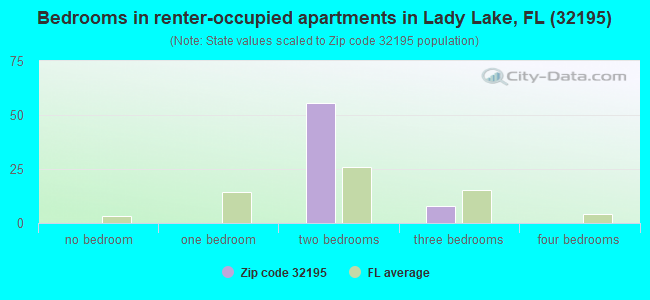
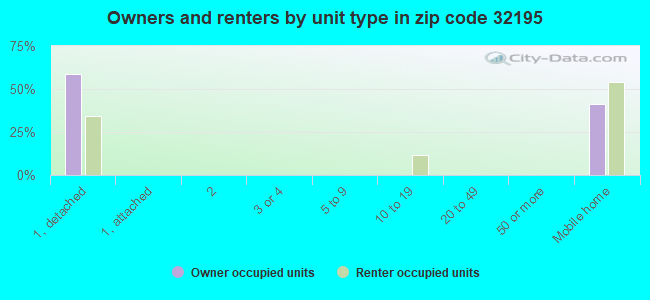
Houses and condos: 1,406 Renter-occupied apartments: 63
% of renters here:
5%
State:
33%
March 2022 cost of living index in zip code 32195: 79.9 (low, U.S. average is 100)
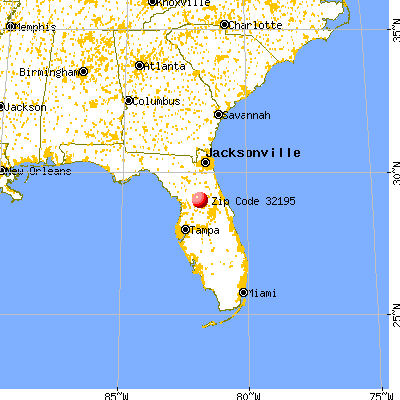
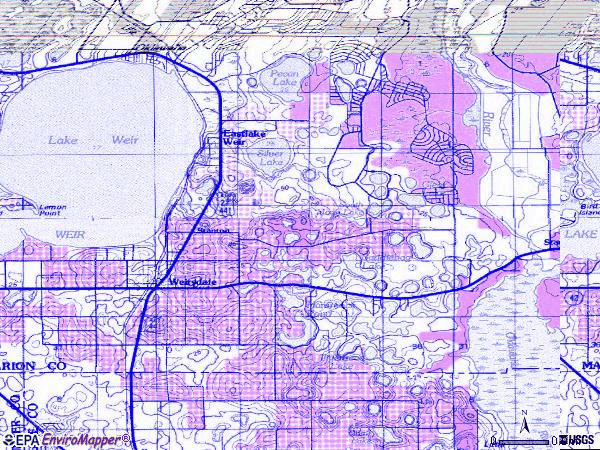
Land area: 21.2 sq. mi. Water area: 5.6 sq. mi.
Population density: 155 people per square mile
(very low).
OSM Map
General Map
Google Map
MSN Map
OSM Map
General Map
Google Map
MSN Map
OSM Map
General Map
Google Map
MSN Map
OSM Map
General Map
Google Map
MSN Map
Please wait while loading the map...
Real estate property taxes paid for housing units in 2022:
This zip code:
0.7% ($1,554)
Florida:
0.7% ($2,529)
Median real estate property taxes paid for housing units with mortgages in 2022: $2,098 (0.8%) Median real estate property taxes paid for housing units with no mortgage in 2022: $985 (0.6%)
Averages for the 2020 tax year for zip code 32195, filed in 2021:
Average Adjusted Gross Income (AGI) in 2020: $57,450 (Individual Income Tax Returns)
Here:
$57,450
State:
$82,200
Salary/wage: $46,816 (reported on 74.3% of returns)
Here:
$46,816
State:
$58,347
(% of AGI for various income ranges: 1249.0% for AGIs below $25k, 3565.0% for AGIs $25k-50k, 6361.4% for AGIs $50k-75k, 8700.0% for AGIs $75k-100k, 14500.0% for AGIs $100k-200k)
Taxable interest for individuals: $2,374 (reported on 23.5% of returns)
This zip code:
$2,374
Florida:
$4,272
(% of AGI for various income ranges: 12.7% for AGIs below $25k, 33.9% for AGIs $25k-50k, 76.4% for AGIs $50k-75k, 108.0% for AGIs $75k-100k, 387.3% for AGIs $100k-200k)
Ordinary dividends: $5,878 (reported on 14.8% of returns)
Here:
$5,878
State:
$15,863
(% of AGI for various income ranges: 20.0% for AGIs below $25k, 17.6% for AGIs $25k-50k, 204.3% for AGIs $50k-75k, 101.0% for AGIs $75k-100k, 359.1% for AGIs $100k-200k)
Net capital gain/loss in AGI: +$30,244 (reported on 14.8% of returns)
Here:
+$30,244
State:
+$62,983
(% of AGI for various income ranges: 18.0% for AGIs below $25k, 60.8% for AGIs $25k-50k, 192.1% for AGIs $50k-75k, 234.0% for AGIs $75k-100k, 590.0% for AGIs $100k-200k)
Profit/loss from business: +$8,911 (reported on 19.1% of returns)
Here:
+$8,911
State:
+$9,719
(% of AGI for various income ranges: 172.7% for AGIs below $25k, 261.1% for AGIs $25k-50k, 187.9% for AGIs $50k-75k, 403.0% for AGIs $75k-100k, 559.1% for AGIs $100k-200k)
Taxable individual retirement arrangement distribution: $18,318 (reported on 9.3% of returns)
32195:
$18,318
Florida:
$24,823
(% of AGI for various income ranges: 41.6% for AGIs below $25k, 87.4% for AGIs $25k-50k, 283.6% for AGIs $50k-75k, 509.0% for AGIs $75k-100k, 1520.0% for AGIs $100k-200k)
Total itemized deductions: $40,529 (reported on 3.8% of returns)
Here:
$40,529
State:
$45,393
(% of AGI for various income ranges: 248.2% for AGIs $25k-50k, 601.0% for AGIs $75k-100k)
Charity contributions: $13,400 (reported on 2.2% of returns)
Here:
$13,400
State:
$20,178
(% of AGI for various income ranges: 487.3% for AGIs $100k-200k)
Taxes paid: $5,729 (reported on 3.8% of returns)
32195:
$5,729
State:
$6,967
(% of AGI for various income ranges: 22.6% for AGIs $25k-50k, 123.0% for AGIs $75k-100k)
Earned income credit: $2,347 (reported on 20.8% of returns)
Here:
$2,347
State:
$2,306
(% of AGI for various income ranges: 118.2% for AGIs below $25k, 82.4% for AGIs $25k-50k)
Percentage of individuals using paid preparers for their 2020 taxes: 90.7%
Here:
91%
State:
92%
(% for various income ranges: 88.7% for AGIs below $25k, 89.8% for AGIs $25k-50k, 95.5% for AGIs $50k-75k, 93.8% for AGIs $75k-100k, 94.4% for AGIs $100k-200k, 85.7% for AGIs over 200k)
Averages for the 2012 tax year for zip code 32195, filed in 2013:
Average Adjusted Gross Income (AGI) in 2012: $43,393 (Individual Income Tax Returns)
Here:
$43,393
State:
$60,316
Salary/wage: $35,654 (reported on 79.7% of returns)
Here:
$35,654
State:
$45,277
(% of AGI for various income ranges: 72.0% for AGIs below $25k, 77.4% for AGIs $25k-50k, 68.6% for AGIs $50k-75k, 71.5% for AGIs $75k-100k, 65.1% for AGIs $100k-200k, 41.4% for AGIs over 200k)
Taxable interest for individuals: $2,050 (reported on 23.5% of returns)
This zip code:
$2,050
Florida:
$3,587
(% of AGI for various income ranges: 1.3% for AGIs below $25k, 0.8% for AGIs $25k-50k, 1.5% for AGIs $50k-75k, 1.2% for AGIs $75k-100k, 1.7% for AGIs $100k-200k, 0.4% for AGIs over 200k)
Ordinary dividends: $6,577 (reported on 14.4% of returns)
Here:
$6,577
State:
$12,831
(% of AGI for various income ranges: 1.0% for AGIs below $25k, 1.5% for AGIs $25k-50k, 3.5% for AGIs $50k-75k, 1.8% for AGIs $75k-100k, 5.2% for AGIs $100k-200k)
Net capital gain/loss in AGI: +$4,789 (reported on 12.4% of returns)
Here:
+$4,789
State:
+$33,493
(% of AGI for various income ranges: 1.8% for AGIs $75k-100k, 7.2% for AGIs $100k-200k)
Profit/loss from business: +$6,115 (reported on 17.0% of returns)
Here:
+$6,115
State:
+$10,012
(% of AGI for various income ranges: 9.8% for AGIs below $25k, 1.4% for AGIs $25k-50k, 2.4% for AGIs $50k-75k, 1.4% for AGIs $100k-200k)
Taxable individual retirement arrangement distribution: $19,480 (reported on 9.8% of returns)
32195:
$19,480
Florida:
$21,544
(% of AGI for various income ranges: 2.5% for AGIs below $25k, 2.4% for AGIs $25k-50k, 3.7% for AGIs $50k-75k, 3.9% for AGIs $75k-100k, 14.0% for AGIs $100k-200k)
Total itemized deductions: $22,416 (26% of AGI, reported on 20.9% of returns)
Here:
$22,416
State:
$25,533
Here:
25.6% of AGI
State:
18.0% of AGI
(% of AGI for various income ranges: 9.0% for AGIs below $25k, 10.1% for AGIs $25k-50k, 10.1% for AGIs $50k-75k, 10.5% for AGIs $75k-100k, 12.1% for AGIs $100k-200k, 12.6% for AGIs over 200k)
Charity contributions: $5,005 (reported on 14.4% of returns)
Here:
$5,005
State:
$5,698
(% of AGI for various income ranges: 0.2% for AGIs below $25k, 1.6% for AGIs $25k-50k, 1.1% for AGIs $50k-75k, 2.4% for AGIs $75k-100k, 1.7% for AGIs $100k-200k, 2.8% for AGIs over 200k)
Taxes paid: $4,228 (reported on 20.9% of returns)
32195:
$4,228
State:
$6,203
(% of AGI for various income ranges: 1.2% for AGIs below $25k, 1.3% for AGIs $25k-50k, 1.8% for AGIs $50k-75k, 2.1% for AGIs $75k-100k, 3.2% for AGIs $100k-200k, 2.6% for AGIs over 200k)
Earned income credit: $2,263 (reported on 26.8% of returns)
Here:
$2,263
State:
$2,372
(% of AGI for various income ranges: 7.8% for AGIs below $25k, 1.2% for AGIs $25k-50k)
Percentage of individuals using paid preparers for their 2012 taxes: 52.3%
Here:
52%
State:
54%
(% for various income ranges: 47.4% for AGIs below $25k, 51.4% for AGIs $25k-50k, 61.1% for AGIs $50k-75k, 60.0% for AGIs $75k-100k, 55.6% for AGIs $100k-200k, 100.0% for AGIs over 200k)
Averages for the 2004 tax year for zip code 32195, filed in 2005:
Average Adjusted Gross Income (AGI) in 2004: $36,806 (Individual Income Tax Returns)
Here:
$36,806
State:
$50,523
Salary/wage: $33,073 (reported on 80.8% of returns)
Here:
$33,073
State:
$39,563
(% of AGI for various income ranges: 119.4% for AGIs below $10k, 77.8% for AGIs $10k-25k, 83.1% for AGIs $25k-50k, 77.1% for AGIs $50k-75k, 76.9% for AGIs $75k-100k, 50.0% for AGIs over 100k)
Taxable interest for individuals: $2,380 (reported on 32.8% of returns)
This zip code:
$2,380
Florida:
$3,211
(% of AGI for various income ranges: 7.2% for AGIs below $10k, 1.9% for AGIs $10k-25k, 2.0% for AGIs $25k-50k, 1.7% for AGIs $50k-75k, 0.9% for AGIs $75k-100k, 2.9% for AGIs over 100k)
Taxable dividends: $2,711 (reported on 16.0% of returns)
Here:
$2,711
State:
$6,129
(% of AGI for various income ranges: 2.1% for AGIs below $10k, 1.2% for AGIs $10k-25k, 1.1% for AGIs $25k-50k, 0.7% for AGIs $50k-75k, 0.3% for AGIs $75k-100k, 2.0% for AGIs over 100k)
Net capital gain/loss: +$13,004 (reported on 14.1% of returns)
Here:
+$13,004
State:
+$27,205
(% of AGI for various income ranges: -3.9% for AGIs below $10k, 0.6% for AGIs $10k-25k, -0.1% for AGIs $25k-50k, -0.0% for AGIs $50k-75k, 4.5% for AGIs $75k-100k, 17.5% for AGIs over 100k)
Profit/loss from business: +$3,977 (reported on 16.6% of returns)
Here:
+$3,977
State:
+$10,634
(% of AGI for various income ranges: 0.2% for AGIs below $10k, 5.5% for AGIs $10k-25k, 2.7% for AGIs $25k-50k, 2.0% for AGIs $50k-75k, -0.4% for AGIs $75k-100k, -0.0% for AGIs over 100k)
IRA payment deduction: $2,559 (reported on 2.1% of returns)
32195:
$2,559
Florida:
$3,082
Total itemized deductions: $18,060 (25% of AGI, reported on 21.2% of returns)
Here:
$18,060
State:
$20,370
Here:
24.8% of AGI
State:
20.7% of AGI
(% of AGI for various income ranges: 11.4% for AGIs below $10k, 10.6% for AGIs $10k-25k, 9.8% for AGIs $25k-50k, 10.6% for AGIs $50k-75k, 9.7% for AGIs $75k-100k, 11.0% for AGIs over 100k)
Charity contributions deductions: $3,150 (4% of AGI, reported on 16.0% of returns)
Here:
$3,150
State:
$4,064
Here:
4.0% of AGI
State:
3.8% of AGI
(% of AGI for various income ranges: 0.6% for AGIs $10k-25k, 0.9% for AGIs $25k-50k, 1.5% for AGIs $50k-75k, 1.2% for AGIs $75k-100k, 2.3% for AGIs over 100k)
Total tax: $5,182 (reported on 71.1% of returns)
32195:
$5,182
State:
$9,431
(% of AGI for various income ranges: 3.5% for AGIs below $10k, 3.7% for AGIs $10k-25k, 6.5% for AGIs $25k-50k, 8.7% for AGIs $50k-75k, 10.5% for AGIs $75k-100k, 18.2% for AGIs over 100k)
Earned income credit: $1,720 (reported on 21.7% of returns)
Here:
$1,720
State:
$1,808
Percentage of individuals using paid preparers for their 2004 taxes: 62.9%
Here:
63%
State:
60%
(% for various income ranges: 60.6% for AGIs below $10k, 64.3% for AGIs $10k-25k, 59.9% for AGIs $25k-50k, 63.0% for AGIs $50k-75k, 66.3% for AGIs $75k-100k, 78.4% for AGIs over 100k)
Household received Food Stamps/SNAP in the past 12 months: 230 Household did not receive Food Stamps/SNAP in the past 12 months: 999
Women who had a birth in the past 12 months: 5 (5 now married, 0 unmarried) Women who did not have a birth in the past 12 months: 617 (331 now married, 286 unmarried)
Housing units in zip code 32195 with a mortgage: 577 (26 second mortgage, 26 both second mortgage and home equity loan) Median monthly owner costs for units with a mortgage: $1,372 Median monthly owner costs for units without a mortgage: $369
Residents with income below the poverty level in 2022:
This zip code:
9.6%
Whole state:
12.7%
Residents with income below 50% of the poverty level in 2022:
This zip code:
6.4%
Whole state:
6.6%
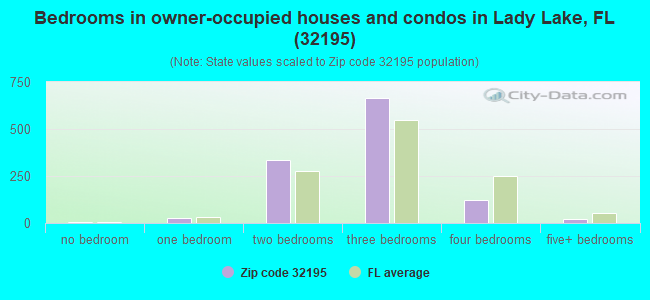
Median number of rooms in houses and condos:
Here:
5.7
State:
5.9
Median number of rooms in apartments:
Here:
4.7
State:
4.2
Notable locations in this zip code not listed on our city pages
Churches in zip code 32195 include: Garden of Prayer-Church of the Living God (A), First Baptist Church of Weirsdale (B), Weirsdale Presbyterian Church (C), Saint John AME Church (D), Stanton First Baptist Church (E). Display/hide their locations on the map
Tourist attractions (not listed on the city page) : Continental Acres Equine Resort (Museums; 3000 Marion County Road) (1), Austin Education Center (Museums; 3000 Marion County Road) (2). Display/hide their approximate locations on the map
Size of family households: 469 2-persons, 172 3-persons, 247 4-persons, 5 5-persons, 14 6-persons, 50 7-or-more-persons
Size of nonfamily households: 225 1-person, 51 2-persons
228 married couples with children.
33 single-parent households (33 men).
96.3% of residents of 32195 zip code speak English at home.
3.1% of residents speak Spanish at home (100% very well).
0.2% of residents speak other Indo-European language at home (100% very well).
0.2% of residents speak Asian or Pacific Island language at home (100% well).
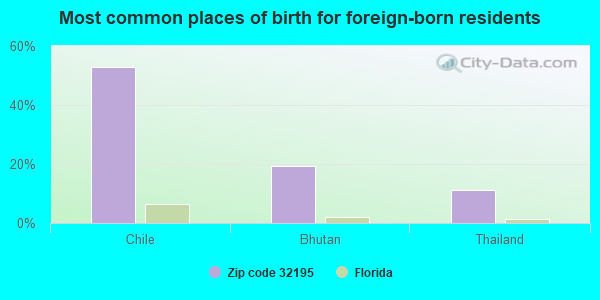
Foreign born population: 36 (1.1%) (100.0% of them are naturalized citizens)
This zip code:
1.1%
Whole state:
21.7%
53%Chile
19%Bhutan
11%Thailand
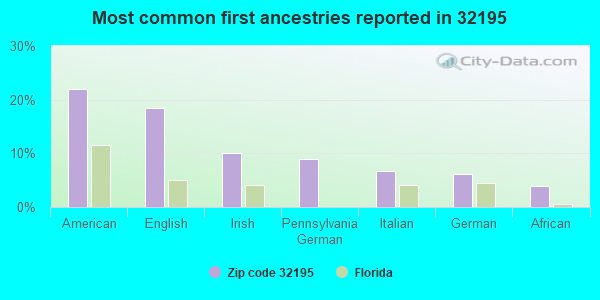
22%American
19%English
10%Irish
9%Pennsylvania German
7%Italian
6%German
4%African
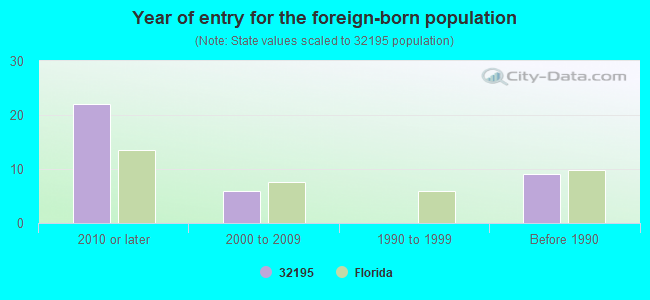
Year of entry for the foreign-born population
222010 or later
62000 to 2009
01990 to 1999
9Before 1990
Public elementary/middle school in in zip code 32195 not listed on the city page:
Facilities with environmental interests located in this zip code:
LESTER PAINTING INC (15152 CR 42 in WEIRSDALE, FL)
(Resource Conservation and Recovery Act (tracking hazardous waste)) Organizations: JAMES LESTER (CONTACT/OWNER)
REED FRUIT CO (ALTERNATE 27-441 in WEIRSDALE, FL)
(Resource Conservation and Recovery Act (tracking hazardous waste)) Organizations: MEALY W REED, SR OWNER (CONTACT/OWNER)
Housing units lacking complete plumbing facilities: 0.4% Housing units lacking complete kitchen facilities: 0.4%
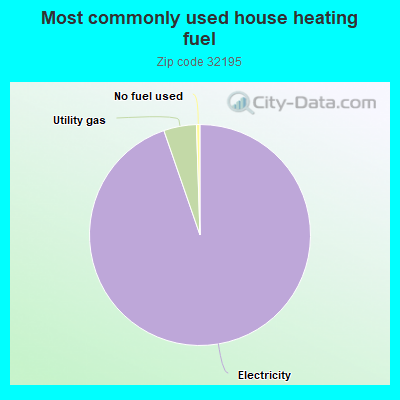
94.8%Electricity
4.8%Utility gas
0.5%No fuel used
Population in 1990: 3,034. Population change in the 1990s: +147 (+4.8%).
Place of birth for U.S.-born residents:
This state: 1,288
Northeast: 841
Midwest: 645
South: 401
West: 38
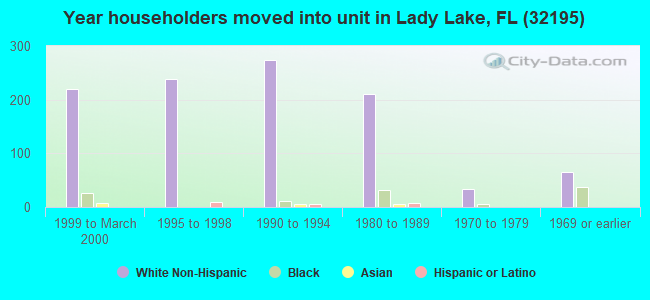
61% of the 32195 zip code residents lived in the same house 5 years ago. Out of people who lived in different houses, 40% lived in this county. Out of people who lived in different counties, 50% lived in Florida.
91% of the 32195 zip code residents lived in the same house 1 year ago. Out of people who lived in different houses, 49% moved from this county. Out of people who lived in different houses, 47% moved from different county within same state.
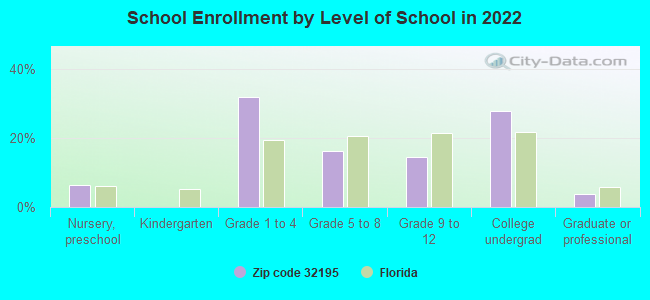
Private vs. public school enrollment:
Students in private schools in grades 1 to 8 (elementary and middle school): 24
Here:
13.5%
Florida:
15.8%
Students in private schools in grades 9 to 12 (high school):
Here:
0.0%
Florida:
12.9%
Students in private undergraduate colleges: 15
Here:
14.9%
Florida:
23.6%
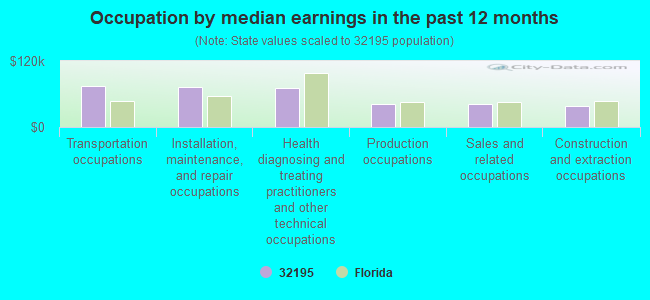
Occupation by median earnings in the past 12 months ($)
74,707Transportation occupations
72,293Installation, maintenance, and repair occupations
70,782Health diagnosing and treating practitioners and other technical occupations
41,726Production occupations
41,501Sales and related occupations
37,412Construction and extraction occupations
Top industries in this zip code by the number of employees in 2005:
Wholesale Trade: Fresh Fruit and Vegetable Merchant Wholesalers (250-499 employees: 1 establishment)
Construction: Painting and Wall Covering Contractors (20-49: 1)
Accommodation and Food Services: Hotels (except Casino Hotels) and Motels (20-49: 1)
Accommodation and Food Services: Recreational and Vacation Camps (except Campgrounds) (10-19: 1)
Administrative and Support and Waste Management and Remediation Services: Janitorial Services (10-19: 1)
Real Estate and Rental and Leasing: Offices of Real Estate Agents and Brokers (1-4: 5)
Professional, Scientific, and Technical Services: Surveying and Mapping (except Geophysical) Services (5-9: 1)
Mining: Construction Sand and Gravel Mining (5-9: 1)
People in group quarters in 2000:
27 people in other nonhousehold living situations
Fatal accident statistics in 2014:
Fatal accident count: 1
Vehicles involved in fatal accidents: 2
Fatal accidents caused by drunken drivers: 1
Fatalities: 1
Persons involved in fatal accidents: 5
Pedestrians involved in fatal accidents: 0
Fatal accident statistics in 2013:
Fatal accident count: 2
Vehicles involved in fatal accidents: 4
Fatal accidents caused by drunken drivers: 0
Fatalities: 2
Persons involved in fatal accidents: 6
Pedestrians involved in fatal accidents: 0
Home Mortgage Disclosure Act Aggregated Statistics For Year 2009 (Based on 4 partial tracts)
A) FHA, FSA/RHS & VA Home Purchase Loans
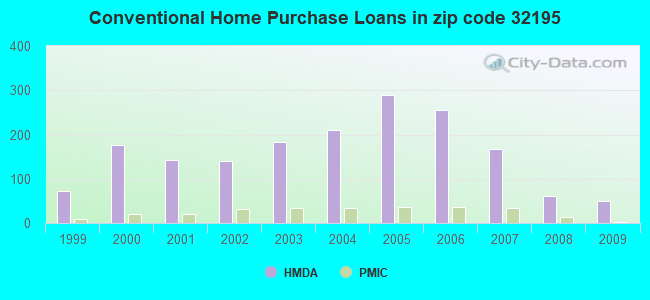
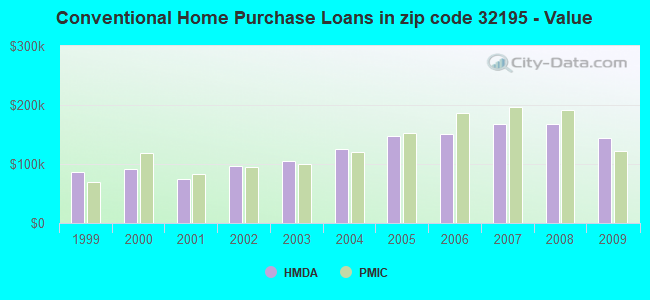
B) Conventional Home Purchase Loans
C) Refinancings
D) Home Improvement Loans
F) Non-occupant Loans on < 5 Family Dwellings (A B C & D)
G) Loans On Manufactured Home Dwelling (A B C & D)
Number
Average Value
Number
Average Value
Number
Average Value
Number
Average Value
Number
Average Value
Number
Average Value
LOANS ORIGINATED
32
$121,129
50
$143,715
140
$157,691
7
$63,187
33
$149,247
12
$82,052
APPLICATIONS APPROVED, NOT ACCEPTED
2
$109,620
5
$282,752
9
$199,566
0
$0
3
$391,137
4
$104,165
APPLICATIONS DENIED
12
$104,742
9
$108,476
91
$204,029
10
$56,898
13
$238,610
23
$82,067
APPLICATIONS WITHDRAWN
5
$114,004
7
$155,577
36
$176,516
3
$160,133
5
$223,296
6
$105,520
FILES CLOSED FOR INCOMPLETENESS
1
$85,710
3
$216,753
12
$182,962
2
$86,415
1
$198,430
2
$117,195
Aggregated Statistics For Year 2008 (Based on 4 partial tracts)
A) FHA, FSA/RHS & VA Home Purchase Loans
B) Conventional Home Purchase Loans
C) Refinancings
D) Home Improvement Loans
F) Non-occupant Loans on < 5 Family Dwellings (A B C & D)
G) Loans On Manufactured Home Dwelling (A B C & D)
Number
Average Value
Number
Average Value
Number
Average Value
Number
Average Value
Number
Average Value
Number
Average Value
LOANS ORIGINATED
19
$117,498
60
$168,517
113
$158,744
19
$95,116
38
$206,887
42
$90,963
APPLICATIONS APPROVED, NOT ACCEPTED
2
$95,325
16
$143,937
29
$169,283
3
$14,103
9
$215,040
10
$108,175
APPLICATIONS DENIED
7
$117,720
22
$186,868
144
$161,922
38
$98,462
18
$155,217
51
$109,713
APPLICATIONS WITHDRAWN
3
$171,493
4
$107,480
50
$174,621
4
$221,952
8
$166,695
9
$121,829
FILES CLOSED FOR INCOMPLETENESS
0
$0
3
$107,100
13
$214,364
0
$0
3
$184,967
2
$106,500
Aggregated Statistics For Year 2007 (Based on 4 partial tracts)
A) FHA, FSA/RHS & VA Home Purchase Loans
B) Conventional Home Purchase Loans
C) Refinancings
D) Home Improvement Loans
F) Non-occupant Loans on < 5 Family Dwellings (A B C & D)
G) Loans On Manufactured Home Dwelling (A B C & D)
Number
Average Value
Number
Average Value
Number
Average Value
Number
Average Value
Number
Average Value
Number
Average Value
LOANS ORIGINATED
15
$127,405
168
$166,990
237
$163,881
34
$85,048
115
$163,418
75
$98,911
APPLICATIONS APPROVED, NOT ACCEPTED
0
$0
36
$140,211
58
$187,886
6
$90,313
22
$158,046
18
$84,931
APPLICATIONS DENIED
2
$166,320
85
$142,435
180
$158,972
53
$80,499
50
$154,537
85
$95,017
APPLICATIONS WITHDRAWN
0
$0
16
$160,614
69
$155,111
6
$157,365
20
$151,914
9
$66,336
FILES CLOSED FOR INCOMPLETENESS
0
$0
9
$185,718
24
$190,721
0
$0
7
$204,726
2
$155,575
Aggregated Statistics For Year 2006 (Based on 4 partial tracts)
A) FHA, FSA/RHS & VA Home Purchase Loans
B) Conventional Home Purchase Loans
C) Refinancings
D) Home Improvement Loans
E) Loans on Dwellings For 5+ Families
F) Non-occupant Loans on < 5 Family Dwellings (A B C & D)
G) Loans On Manufactured Home Dwelling (A B C & D)
Number
Average Value
Number
Average Value
Number
Average Value
Number
Average Value
Number
Average Value
Number
Average Value
Number
Average Value
LOANS ORIGINATED
17
$134,628
255
$151,534
246
$154,788
36
$77,324
0
$0
136
$158,093
98
$89,813
APPLICATIONS APPROVED, NOT ACCEPTED
2
$135,080
44
$135,543
56
$137,186
6
$62,390
0
$0
24
$136,250
27
$86,448
APPLICATIONS DENIED
3
$126,110
77
$180,037
144
$145,035
38
$73,713
1
$907,200
35
$167,875
65
$98,237
APPLICATIONS WITHDRAWN
1
$115,520
26
$206,491
94
$138,935
3
$98,207
0
$0
11
$110,342
18
$103,801
FILES CLOSED FOR INCOMPLETENESS
1
$87,700
10
$107,244
26
$177,812
0
$0
0
$0
3
$99,793
2
$151,960
Aggregated Statistics For Year 2005 (Based on 4 partial tracts)
A) FHA, FSA/RHS & VA Home Purchase Loans
B) Conventional Home Purchase Loans
C) Refinancings
D) Home Improvement Loans
F) Non-occupant Loans on < 5 Family Dwellings (A B C & D)
G) Loans On Manufactured Home Dwelling (A B C & D)
Number
Average Value
Number
Average Value
Number
Average Value
Number
Average Value
Number
Average Value
Number
Average Value
LOANS ORIGINATED
12
$106,625
289
$147,177
199
$139,466
39
$79,586
114
$163,550
94
$84,145
APPLICATIONS APPROVED, NOT ACCEPTED
2
$48,385
37
$135,388
47
$107,505
8
$83,569
11
$120,662
20
$74,690
APPLICATIONS DENIED
6
$126,800
71
$123,265
206
$106,745
28
$60,771
25
$164,972
86
$76,242
APPLICATIONS WITHDRAWN
4
$78,192
34
$183,081
111
$119,991
6
$254,838
9
$110,771
23
$77,764
FILES CLOSED FOR INCOMPLETENESS
0
$0
10
$174,761
35
$151,785
2
$33,265
2
$310,525
5
$122,590
Aggregated Statistics For Year 2004 (Based on 4 partial tracts)
A) FHA, FSA/RHS & VA Home Purchase Loans
B) Conventional Home Purchase Loans
C) Refinancings
D) Home Improvement Loans
F) Non-occupant Loans on < 5 Family Dwellings (A B C & D)
G) Loans On Manufactured Home Dwelling (A B C & D)
Number
Average Value
Number
Average Value
Number
Average Value
Number
Average Value
Number
Average Value
Number
Average Value
LOANS ORIGINATED
26
$100,593
210
$125,947
169
$116,280
21
$42,951
74
$138,281
83
$75,901
APPLICATIONS APPROVED, NOT ACCEPTED
2
$143,345
44
$97,799
57
$93,833
5
$97,880
14
$93,760
32
$70,616
APPLICATIONS DENIED
5
$80,042
69
$89,084
170
$85,635
35
$56,882
15
$67,877
97
$68,809
APPLICATIONS WITHDRAWN
6
$65,578
19
$142,024
116
$103,959
3
$78,133
5
$97,478
39
$80,239
FILES CLOSED FOR INCOMPLETENESS
0
$0
6
$127,507
13
$100,601
2
$27,840
4
$99,120
3
$63,503
Aggregated Statistics For Year 2003 (Based on 4 partial tracts)
A) FHA, FSA/RHS & VA Home Purchase Loans
B) Conventional Home Purchase Loans
C) Refinancings
D) Home Improvement Loans
F) Non-occupant Loans on < 5 Family Dwellings (A B C & D)
Number
Average Value
Number
Average Value
Number
Average Value
Number
Average Value
Number
Average Value
LOANS ORIGINATED
17
$91,054
184
$105,649
292
$105,812
18
$28,797
71
$107,100
APPLICATIONS APPROVED, NOT ACCEPTED
2
$87,730
21
$94,370
57
$89,416
4
$12,450
8
$105,452
APPLICATIONS DENIED
6
$92,305
46
$79,892
160
$98,182
19
$24,833
5
$70,502
APPLICATIONS WITHDRAWN
8
$86,574
12
$122,588
114
$101,997
2
$62,885
3
$121,450
FILES CLOSED FOR INCOMPLETENESS
0
$0
6
$80,782
11
$128,625
0
$0
0
$0
Aggregated Statistics For Year 2002 (Based on 4 partial tracts)
A) FHA, FSA/RHS & VA Home Purchase Loans
B) Conventional Home Purchase Loans
C) Refinancings
D) Home Improvement Loans
E) Loans on Dwellings For 5+ Families
F) Non-occupant Loans on < 5 Family Dwellings (A B C & D)
Number
Average Value
Number
Average Value
Number
Average Value
Number
Average Value
Number
Average Value
Number
Average Value
LOANS ORIGINATED
14
$78,115
141
$96,965
220
$105,492
16
$21,846
2
$108,275
49
$109,435
APPLICATIONS APPROVED, NOT ACCEPTED
1
$66,530
12
$128,494
42
$69,749
2
$23,230
0
$0
1
$130,420
APPLICATIONS DENIED
2
$126,055
52
$76,296
119
$64,411
24
$19,741
0
$0
3
$19,293
APPLICATIONS WITHDRAWN
1
$81,650
10
$72,127
70
$89,783
2
$154,580
0
$0
2
$202,945
FILES CLOSED FOR INCOMPLETENESS
1
$52,920
2
$57,455
20
$81,439
0
$0
0
$0
0
$0
Aggregated Statistics For Year 2001 (Based on 4 partial tracts)
A) FHA, FSA/RHS & VA Home Purchase Loans
B) Conventional Home Purchase Loans
C) Refinancings
D) Home Improvement Loans
F) Non-occupant Loans on < 5 Family Dwellings (A B C & D)
Number
Average Value
Number
Average Value
Number
Average Value
Number
Average Value
Number
Average Value
LOANS ORIGINATED
9
$74,247
143
$75,068
163
$90,708
16
$26,176
34
$91,887
APPLICATIONS APPROVED, NOT ACCEPTED
0
$0
16
$67,292
28
$68,051
0
$0
2
$62,885
APPLICATIONS DENIED
2
$94,695
46
$55,021
143
$67,665
27
$20,020
8
$49,768
APPLICATIONS WITHDRAWN
1
$20,410
16
$83,963
70
$77,364
4
$23,562
4
$79,675
FILES CLOSED FOR INCOMPLETENESS
1
$28,730
3
$82,320
16
$101,308
1
$15,120
0
$0
Aggregated Statistics For Year 2000 (Based on 4 partial tracts)
A) FHA, FSA/RHS & VA Home Purchase Loans
B) Conventional Home Purchase Loans
C) Refinancings
D) Home Improvement Loans
F) Non-occupant Loans on < 5 Family Dwellings (A B C & D)
Number
Average Value
Number
Average Value
Number
Average Value
Number
Average Value
Number
Average Value
LOANS ORIGINATED
18
$75,662
176
$91,104
70
$75,332
29
$32,291
33
$105,188
APPLICATIONS APPROVED, NOT ACCEPTED
0
$0
37
$88,119
18
$54,080
16
$23,090
3
$37,770
APPLICATIONS DENIED
6
$79,347
97
$59,493
110
$49,740
25
$22,172
9
$45,292
APPLICATIONS WITHDRAWN
3
$89,383
18
$91,779
74
$60,593
6
$33,848
3
$32,320
FILES CLOSED FOR INCOMPLETENESS
2
$46,530
2
$143,930
25
$61,079
0
$0
0
$0
Aggregated Statistics For Year 1999 (Based on 2 partial tracts)
A) FHA, FSA/RHS & VA Home Purchase Loans
B) Conventional Home Purchase Loans
C) Refinancings
D) Home Improvement Loans
F) Non-occupant Loans on < 5 Family Dwellings (A B C & D)
Detailed PMIC statistics for the following Tracts:0007.01
, 0007.02
2002 - 2018 National Fire Incident Reporting System (NFIRS) incidents
According to the data from the years 2002 - 2018 the average number of fire incidents per year is 16. The highest number of reported fire incidents - 52 took place in 2006, and the least - 0 in 2003. The data has a rising trend.
When looking into fire subcategories, the most incidents belonged to: Outside Fires (59.7%), and Structure Fires (19.4%).
Fire incident types reported to NFIRS in Zip Code 32195


 Nearest zip codes: 32133, 32159, 32179, 34788, 34731, 32162.


 (Students: 382, Location: 16705 SE 134TH TER, Grades: PK-5)


 According to the data from the years 2002 - 2018 the average number of fire incidents per year is 16. The highest number of reported fire incidents - 52 took place in 2006, and the least - 0 in 2003. The data has a rising trend.
 When looking into fire subcategories, the most incidents belonged to: Outside Fires (59.7%), and Structure Fires (19.4%).