Estimated zip code population in 2022: 8,092 Zip code population in 2010: 8,600 Zip code population in 2000: 6,556
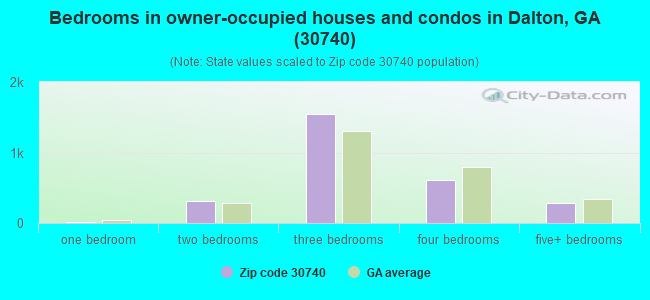
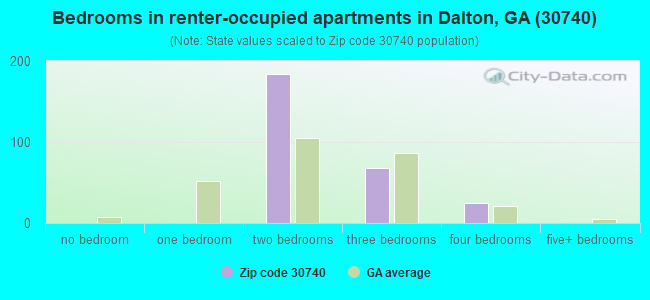
Houses and condos: 3,430 Renter-occupied apartments: 276
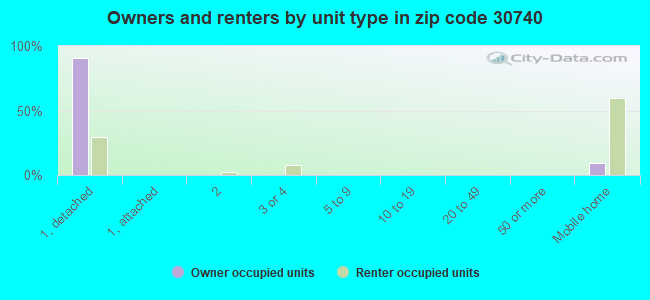
% of renters here:
9%
State:
34%
March 2022 cost of living index in zip code 30740: 81.0 (low, U.S. average is 100)
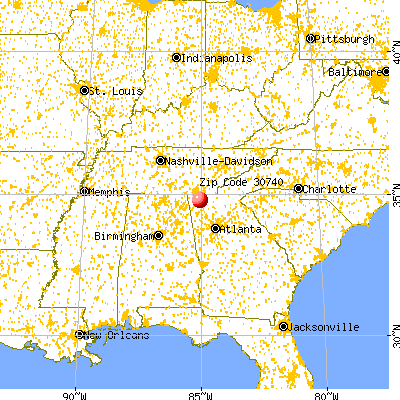
Land area: 50.8 sq. mi. Water area: 0.1 sq. mi.
Population density: 159 people per square mile
(very low).
OSM Map
General Map
Google Map
MSN Map
OSM Map
General Map
Google Map
MSN Map
OSM Map
General Map
Google Map
MSN Map
OSM Map
General Map
Google Map
MSN Map
Please wait while loading the map...
Real estate property taxes paid for housing units in 2022:
This zip code:
0.6% ($1,541)
Georgia:
0.7% ($2,160)
Median real estate property taxes paid for housing units with mortgages in 2022: $1,669 (0.6%) Median real estate property taxes paid for housing units with no mortgage in 2022: $1,148 (0.5%)
Business Search- 14 Million verified businesses
Males: 3,851
(47.6%)
Females: 4,241
(52.4%)
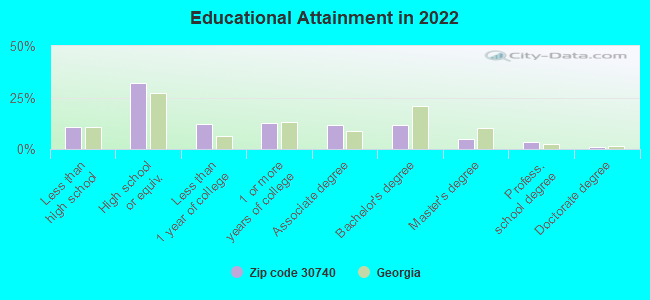
For population 25 years and over in 30740:
High school or higher: 88.7%
Bachelor's degree or higher: 20.7%
Graduate or professional degree: 9.0%
Unemployed: 6.2%
Mean travel time to work (commute): 25.7 minutes
For population 15 years and over in 30740:
Never married: 27.4%
Now married: 54.2%
Separated: 0.3%
Widowed: 5.3%
Divorced: 12.9%
Zip code 30740 compared to state average:
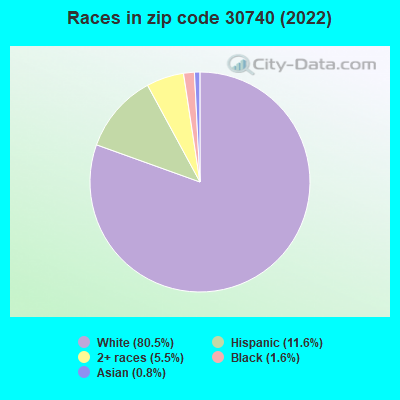
Black race population percentage significantly below state average.
Median age above state average.
Renting percentage significantly below state average.
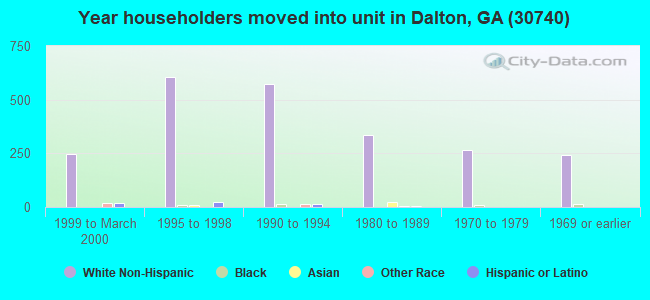
Length of stay since moving in significantly above state average.
Percentage of population with a bachelor's degree or higher below state average.
Averages for the 2020 tax year for zip code 30740, filed in 2021:
Average Adjusted Gross Income (AGI) in 2020: $80,962 (Individual Income Tax Returns)
Here:
$80,962
State:
$70,847
Salary/wage: $57,120 (reported on 84.5% of returns)
Here:
$57,120
State:
$59,126
(% of AGI for various income ranges: 1147.3% for AGIs below $25k, 3626.4% for AGIs $25k-50k, 6986.3% for AGIs $50k-75k, 10231.2% for AGIs $75k-100k, 17711.0% for AGIs $100k-200k, 102832.5% for AGIs over 200k)
Taxable interest for individuals: $4,840 (reported on 23.4% of returns)
This zip code:
$4,840
Georgia:
$2,011
(% of AGI for various income ranges: 9.4% for AGIs below $25k, 17.1% for AGIs $25k-50k, 26.6% for AGIs $50k-75k, 51.6% for AGIs $75k-100k, 185.3% for AGIs $100k-200k, 8572.5% for AGIs over 200k)
Ordinary dividends: $7,181 (reported on 12.2% of returns)
Here:
$7,181
State:
$8,996
(% of AGI for various income ranges: 18.7% for AGIs below $25k, 28.9% for AGIs $25k-50k, 32.4% for AGIs $50k-75k, 131.2% for AGIs $75k-100k, 208.7% for AGIs $100k-200k, 4865.0% for AGIs over 200k)
Net capital gain/loss in AGI: +$23,375 (reported on 13.0% of returns)
Here:
+$23,375
State:
+$28,402
(% of AGI for various income ranges: 5.8% for AGIs below $25k, 8.0% for AGIs $25k-50k, 43.9% for AGIs $50k-75k, 248.0% for AGIs $75k-100k, 720.7% for AGIs $100k-200k, 22097.5% for AGIs over 200k)
Profit/loss from business: +$12,287 (reported on 15.3% of returns)
Here:
+$12,287
State:
+$6,707
(% of AGI for various income ranges: 163.9% for AGIs below $25k, 122.8% for AGIs $25k-50k, 202.4% for AGIs $50k-75k, 196.0% for AGIs $75k-100k, 563.7% for AGIs $100k-200k, 4605.0% for AGIs over 200k)
Taxable individual retirement arrangement distribution: $17,979 (reported on 7.4% of returns)
30740:
$17,979
Georgia:
$20,525
(% of AGI for various income ranges: 43.1% for AGIs below $25k, 82.9% for AGIs $25k-50k, 130.0% for AGIs $50k-75k, 366.4% for AGIs $75k-100k, 512.0% for AGIs $100k-200k, 2840.0% for AGIs over 200k)
Total itemized deductions: $46,970 (reported on 7.6% of returns)
Here:
$46,970
State:
$34,001
(% of AGI for various income ranges: 108.2% for AGIs $25k-50k, 215.4% for AGIs $50k-75k, 324.0% for AGIs $75k-100k, 1093.3% for AGIs $100k-200k, 20495.0% for AGIs over 200k)
Charity contributions: $21,123 (reported on 6.6% of returns)
Here:
$21,123
State:
$14,164
(% of AGI for various income ranges: 18.0% for AGIs $25k-50k, 36.3% for AGIs $50k-75k, 106.8% for AGIs $75k-100k, 411.7% for AGIs $100k-200k, 9220.0% for AGIs over 200k)
Taxes paid: $7,793 (reported on 7.6% of returns)
30740:
$7,793
State:
$7,540
(% of AGI for various income ranges: 18.5% for AGIs $25k-50k, 41.7% for AGIs $50k-75k, 86.8% for AGIs $75k-100k, 274.7% for AGIs $100k-200k, 2422.5% for AGIs over 200k)
Earned income credit: $2,313 (reported on 17.6% of returns)
Here:
$2,313
State:
$2,530
(% of AGI for various income ranges: 97.9% for AGIs below $25k, 84.1% for AGIs $25k-50k)
Percentage of individuals using paid preparers for their 2020 taxes: 94.4%
Here:
94%
State:
93%
(% for various income ranges: 94.1% for AGIs below $25k, 94.3% for AGIs $25k-50k, 93.2% for AGIs $50k-75k, 97.4% for AGIs $75k-100k, 94.5% for AGIs $100k-200k, 93.8% for AGIs over 200k)
Averages for the 2012 tax year for zip code 30740, filed in 2013:
Average Adjusted Gross Income (AGI) in 2012: $58,893 (Individual Income Tax Returns)
Here:
$58,893
State:
$56,131
Salary/wage: $48,231 (reported on 87.7% of returns)
Here:
$48,231
State:
$47,942
(% of AGI for various income ranges: 76.2% for AGIs below $25k, 87.1% for AGIs $25k-50k, 80.8% for AGIs $50k-75k, 79.1% for AGIs $75k-100k, 76.9% for AGIs $100k-200k, 49.1% for AGIs over 200k)
Taxable interest for individuals: $1,346 (reported on 26.2% of returns)
This zip code:
$1,346
Georgia:
$1,706
(% of AGI for various income ranges: 1.3% for AGIs below $25k, 0.4% for AGIs $25k-50k, 0.4% for AGIs $50k-75k, 0.4% for AGIs $75k-100k, 0.6% for AGIs $100k-200k, 0.8% for AGIs over 200k)
Ordinary dividends: $5,204 (reported on 12.5% of returns)
Here:
$5,204
State:
$7,265
(% of AGI for various income ranges: 1.4% for AGIs below $25k, 0.4% for AGIs $25k-50k, 0.4% for AGIs $50k-75k, 0.2% for AGIs $75k-100k, 0.9% for AGIs $100k-200k, 2.4% for AGIs over 200k)
Net capital gain/loss in AGI: +$7,716 (reported on 10.1% of returns)
Here:
+$7,716
State:
+$16,323
(% of AGI for various income ranges: 0.3% for AGIs $25k-50k, 0.1% for AGIs $50k-75k, 0.6% for AGIs $100k-200k, 4.2% for AGIs over 200k)
Profit/loss from business: +$10,094 (reported on 16.9% of returns)
Here:
+$10,094
State:
+$7,583
(% of AGI for various income ranges: 8.4% for AGIs below $25k, 2.7% for AGIs $25k-50k, 1.6% for AGIs $50k-75k, 2.2% for AGIs $75k-100k, 2.5% for AGIs $100k-200k, 2.8% for AGIs over 200k)
Taxable individual retirement arrangement distribution: $13,110 (reported on 7.9% of returns)
30740:
$13,110
Georgia:
$17,199
(% of AGI for various income ranges: 2.3% for AGIs below $25k, 1.5% for AGIs $25k-50k, 2.9% for AGIs $50k-75k, 2.4% for AGIs $75k-100k, 2.9% for AGIs $100k-200k)
Total itemized deductions: $25,268 (21% of AGI, reported on 32.4% of returns)
Here:
$25,268
State:
$23,886
Here:
21.2% of AGI
State:
21.5% of AGI
(% of AGI for various income ranges: 7.5% for AGIs below $25k, 11.2% for AGIs $25k-50k, 12.1% for AGIs $50k-75k, 14.5% for AGIs $75k-100k, 15.1% for AGIs $100k-200k, 17.3% for AGIs over 200k)
Charity contributions: $5,888 (reported on 26.2% of returns)
Here:
$5,888
State:
$5,507
(% of AGI for various income ranges: 0.7% for AGIs below $25k, 1.6% for AGIs $25k-50k, 2.0% for AGIs $50k-75k, 2.8% for AGIs $75k-100k, 3.5% for AGIs $100k-200k, 3.4% for AGIs over 200k)
Taxes paid: $7,816 (reported on 32.2% of returns)
30740:
$7,816
State:
$7,838
(% of AGI for various income ranges: 0.9% for AGIs below $25k, 2.2% for AGIs $25k-50k, 3.1% for AGIs $50k-75k, 4.4% for AGIs $75k-100k, 5.7% for AGIs $100k-200k, 6.0% for AGIs over 200k)
Earned income credit: $2,220 (reported on 24.0% of returns)
Here:
$2,220
State:
$2,589
(% of AGI for various income ranges: 7.9% for AGIs below $25k, 1.6% for AGIs $25k-50k)
Percentage of individuals using paid preparers for their 2012 taxes: 54.2%
Here:
54%
State:
55%
(% for various income ranges: 51.1% for AGIs below $25k, 51.5% for AGIs $25k-50k, 57.4% for AGIs $50k-75k, 51.7% for AGIs $75k-100k, 61.8% for AGIs $100k-200k, 90.0% for AGIs over 200k)
Averages for the 2004 tax year for zip code 30740, filed in 2005:
Average Adjusted Gross Income (AGI) in 2004: $48,551 (Individual Income Tax Returns)
Here:
$48,551
State:
$47,553
Salary/wage: $42,313 (reported on 89.4% of returns)
Here:
$42,313
State:
$42,178
(% of AGI for various income ranges: 102.6% for AGIs below $10k, 86.7% for AGIs $10k-25k, 87.1% for AGIs $25k-50k, 87.5% for AGIs $50k-75k, 82.5% for AGIs $75k-100k, 63.8% for AGIs over 100k)
Taxable interest for individuals: $1,867 (reported on 32.6% of returns)
This zip code:
$1,867
Georgia:
$1,772
(% of AGI for various income ranges: 4.0% for AGIs below $10k, 1.3% for AGIs $10k-25k, 0.9% for AGIs $25k-50k, 1.0% for AGIs $50k-75k, 0.9% for AGIs $75k-100k, 1.6% for AGIs over 100k)
Taxable dividends: $2,971 (reported on 14.8% of returns)
Here:
$2,971
State:
$4,283
(% of AGI for various income ranges: 1.8% for AGIs below $10k, 0.5% for AGIs $10k-25k, 0.6% for AGIs $25k-50k, 0.5% for AGIs $50k-75k, 0.6% for AGIs $75k-100k, 1.4% for AGIs over 100k)
Net capital gain/loss: +$13,686 (reported on 12.2% of returns)
Here:
+$13,686
State:
+$16,461
(% of AGI for various income ranges: -0.7% for AGIs below $10k, 0.0% for AGIs $10k-25k, 0.6% for AGIs $25k-50k, 1.1% for AGIs $50k-75k, 1.7% for AGIs $75k-100k, 7.6% for AGIs over 100k)
Profit/loss from business: +$8,289 (reported on 16.3% of returns)
Here:
+$8,289
State:
+$8,201
(% of AGI for various income ranges: 16.6% for AGIs below $10k, 6.1% for AGIs $10k-25k, 2.3% for AGIs $25k-50k, 1.6% for AGIs $50k-75k, 2.1% for AGIs $75k-100k, 2.5% for AGIs over 100k)
IRA payment deduction: $3,411 (reported on 2.4% of returns)
30740:
$3,411
Georgia:
$2,969
(% of AGI for various income ranges: 0.3% for AGIs $10k-25k, 0.1% for AGIs $25k-50k, 0.2% for AGIs $50k-75k, 0.2% for AGIs $75k-100k, 0.1% for AGIs over 100k)
Self-employed pension: $13,900 (reported on 0.3% of returns)
Here:
$13,900
Georgia:
$16,203
Total itemized deductions: $20,139 (21% of AGI, reported on 33.4% of returns)
Here:
$20,139
State:
$19,944
Here:
21.4% of AGI
State:
22.6% of AGI
(% of AGI for various income ranges: 11.6% for AGIs below $10k, 8.0% for AGIs $10k-25k, 11.7% for AGIs $25k-50k, 13.6% for AGIs $50k-75k, 15.5% for AGIs $75k-100k, 16.1% for AGIs over 100k)
Charity contributions deductions: $5,085 (5% of AGI, reported on 28.4% of returns)
Here:
$5,085
State:
$4,354
Here:
5.1% of AGI
State:
4.7% of AGI
(% of AGI for various income ranges: 0.4% for AGIs below $10k, 0.9% for AGIs $10k-25k, 1.7% for AGIs $25k-50k, 2.3% for AGIs $50k-75k, 3.0% for AGIs $75k-100k, 4.5% for AGIs over 100k)
Total tax: $7,642 (reported on 73.8% of returns)
30740:
$7,642
State:
$8,223
(% of AGI for various income ranges: 3.6% for AGIs below $10k, 4.0% for AGIs $10k-25k, 5.9% for AGIs $25k-50k, 8.3% for AGIs $50k-75k, 10.1% for AGIs $75k-100k, 19.0% for AGIs over 100k)
Earned income credit: $1,763 (reported on 20.8% of returns)
Here:
$1,763
State:
$1,986
Percentage of individuals using paid preparers for their 2004 taxes: 64.4%
Here:
64%
State:
62%
(% for various income ranges: 58.2% for AGIs below $10k, 67.4% for AGIs $10k-25k, 64.6% for AGIs $25k-50k, 63.6% for AGIs $50k-75k, 61.6% for AGIs $75k-100k, 70.7% for AGIs over 100k)
Household received Food Stamps/SNAP in the past 12 months: 309 Household did not receive Food Stamps/SNAP in the past 12 months: 2,711
Women who had a birth in the past 12 months: 130 (130 now married, 0 unmarried) Women who did not have a birth in the past 12 months: 2,050 (806 now married, 1,244 unmarried)
Housing units in zip code 30740 with a mortgage: 1,555 (108 second mortgage, 38 both second mortgage and home equity loan) Houses without a mortgage: 37
Median monthly owner costs for units with a mortgage: $1,363 Median monthly owner costs for units without a mortgage: $425
Residents with income below the poverty level in 2022:
This zip code:
8.9%
Whole state:
12.7%
Residents with income below 50% of the poverty level in 2022:
This zip code:
3.6%
Whole state:
6.3%
Median number of rooms in houses and condos:
Here:
6.9
State:
6.8
Median number of rooms in apartments:
Here:
4.8
State:
4.6
Notable locations in this zip code not listed on our city pages
Notable locations in zip code 30740: Rocky Acres Bible Camp (A), Rocky Face Greenhouse (B), Whitfield County Fire Department Station 6 Westside (C), Whitfield County Fire Department Station 9 Mill Creek (D). Display/hide their locations on the map
Churches in zip code 30740 include: Rocky Face Baptist Church (A), Mill Creek Baptist Church (B), Griffin Chapel (C), Fairview Church (D), Stony Point Church (E), Fellowship Church (F), Dunnegan Church (G), Lakeside Church (H), Fairview Church (I). Display/hide their locations on the map
Cemeteries: Callaway Cemetery (1), Friendship Cemetery (2), Griffin Cemetery (3), Mill Creek Cemetery (4), Rocky Face Cemetery (5), Stony Point Cemetery (6), Suttle Cemetery (7). Display/hide their locations on the map
Streams, rivers, and creeks: Hayes Branch (A), Gordon Spring Creek (B), Cove Creek (C), North Fork Mill Creek (D), Hurricane Creek (E). Display/hide their locations on the map
1,126 married couples with children.
451 single-parent households (136 men, 315 women).
88.1% of residents of 30740 zip code speak English at home.
10.4% of residents speak Spanish at home (45% very well, 16% well, 27% not well, 12% not at all).
0.9% of residents speak other Indo-European language at home (100% very well).
0.2% of residents speak Asian or Pacific Island language at home (100% well).
0.3% of residents speak other language at home (100% very well).
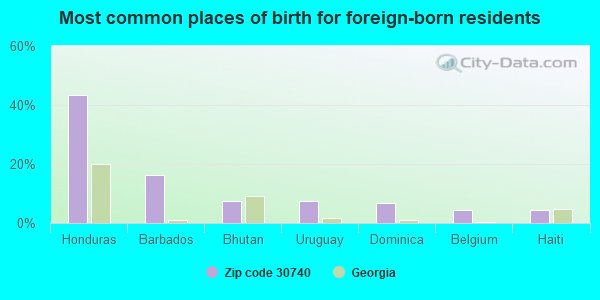
Foreign born population: 706 (8.7%) (73.6% of them are naturalized citizens)
This zip code:
8.7%
Whole state:
10.7%
43%Honduras
16%Barbados
8%Bhutan
7%Uruguay
7%Dominica
4%Belgium
4%Haiti
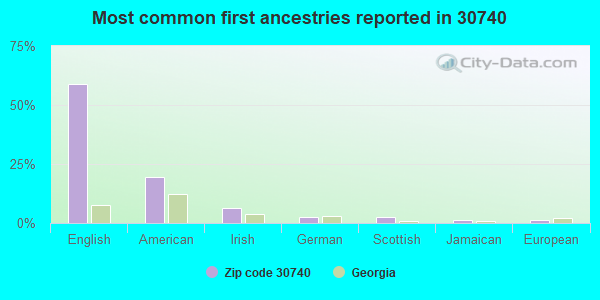
59%English
19%American
6%Irish
3%German
3%Scottish
1%Jamaican
1%European
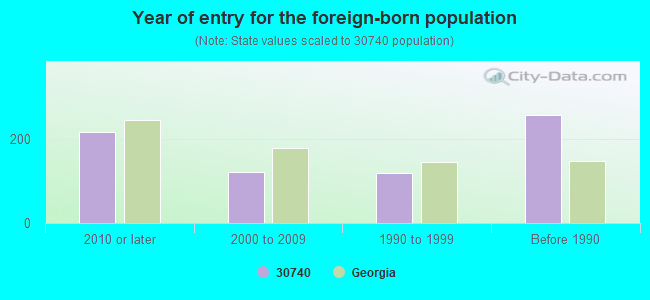
Year of entry for the foreign-born population
2172010 or later
1232000 to 2009
1191990 to 1999
258Before 1990
Facilities with environmental interests located in this zip code:
JOHNSONS HI VOLTAGE (2715 OLD CHATTANOOGA RD in ROCKY FACE, GA)
Conditionally Exempt Small Quantity Generators, less than 100 kg/month of hazardous waste (Resource Conservation and Recovery Act (tracking hazardous waste)) Organizations: TIM W JOHNSON (CONTACT/OPERATOR)
, TIM JOHNSON (CONTACT/OWNER)
Housing units lacking complete plumbing facilities: 4.2% Housing units lacking complete kitchen facilities: 5.5%
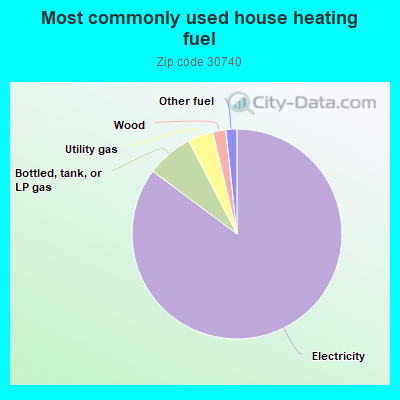
85.3%Electricity
7.2%Bottled, tank, or LP gas
3.9%Utility gas
2.0%Wood
1.7%Other fuel
Population in 1990: 6,029. Population change in the 1990s: +527 (+8.7%).
Place of birth for U.S.-born residents:
This state: 4,585
Northeast: 258
Midwest: 434
South: 1,957
West: 111
66% of the 30740 zip code residents lived in the same house 5 years ago. Out of people who lived in different houses, 69% lived in this county. Out of people who lived in different counties, 50% lived in Georgia.
98% of the 30740 zip code residents lived in the same house 1 year ago. Out of people who lived in different houses, 33% moved from this county. Out of people who lived in different houses, 74% moved from different county within same state. Out of people who lived in different houses, 7% moved from abroad.
Private vs. public school enrollment:
Students in private schools in grades 1 to 8 (elementary and middle school): 109
Here:
18.4%
Georgia:
12.1%
Students in private schools in grades 9 to 12 (high school): 40
Here:
7.2%
Georgia:
10.8%
Students in private undergraduate colleges: 82
Here:
25.7%
Georgia:
17.1%
Occupation by median earnings in the past 12 months ($)
130,595Legal occupations
118,922Architecture and engineering occupations
100,667Health diagnosing and treating practitioners and other technical occupations
70,924Management occupations
64,375Business and financial operations occupations
53,654Production occupations
Top industries in this zip code by the number of employees in 2005:
Construction: New Single-Family Housing Construction (except Operative Builders) (10-19 employees: 1 establishment, 5-9 employees: 1 establishment, 1-4 employees: 9 establishments)
Construction: Land Subdivision (20-49: 1, 1-4: 1)
Arts, Entertainment, and Recreation: Golf Courses and Country Clubs (20-49: 1)
Other Services (except Public Administration): Religious Organizations (5-9: 2, 1-4: 7)
Other Services (except Public Administration): Automotive Body, Paint, and Interior Repair and Maintenance (10-19: 1)
Accommodation and Food Services: Limited-Service Restaurants (10-19: 1)
Health Care and Social Assistance: Child Day Care Services (5-9: 2)
People in group quarters in 2010:
4 people in group homes for juveniles (non-correctional)
4 people in workers' group living quarters and job corps centers
Fatal accident statistics in 2013:
Fatal accident count: 1
Vehicles involved in fatal accidents: 1
Fatal accidents caused by drunken drivers: 0
Fatalities: 1
Persons involved in fatal accidents: 1
Pedestrians involved in fatal accidents: 0
Fatal accident statistics in 2010:
Fatal accident count: 1
Vehicles involved in fatal accidents: 1
Fatal accidents caused by drunken drivers: 1
Fatalities: 1
Persons involved in fatal accidents: 2
Pedestrians involved in fatal accidents: 0
Home Mortgage Disclosure Act Aggregated Statistics For Year 2009 (Based on 6 partial tracts)
A) FHA, FSA/RHS & VA Home Purchase Loans
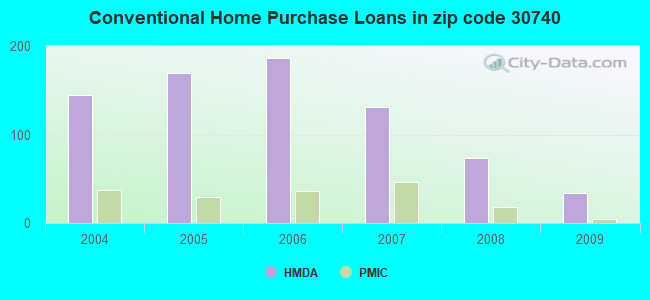
B) Conventional Home Purchase Loans
C) Refinancings
D) Home Improvement Loans
F) Non-occupant Loans on < 5 Family Dwellings (A B C & D)
G) Loans On Manufactured Home Dwelling (A B C & D)
Number
Average Value
Number
Average Value
Number
Average Value
Number
Average Value
Number
Average Value
Number
Average Value
LOANS ORIGINATED
32
$124,165
34
$159,805
206
$136,276
9
$41,329
39
$127,708
9
$55,098
APPLICATIONS APPROVED, NOT ACCEPTED
2
$233,120
2
$109,240
14
$130,597
1
$68,280
0
$0
1
$17,500
APPLICATIONS DENIED
6
$125,418
14
$126,226
103
$151,286
8
$42,528
4
$96,828
5
$59,118
APPLICATIONS WITHDRAWN
7
$107,489
12
$101,592
75
$160,815
2
$51,305
10
$156,701
0
$0
FILES CLOSED FOR INCOMPLETENESS
2
$84,535
4
$109,358
23
$154,642
0
$0
3
$78,480
2
$104,805
Aggregated Statistics For Year 2008 (Based on 6 partial tracts)
A) FHA, FSA/RHS & VA Home Purchase Loans
B) Conventional Home Purchase Loans
C) Refinancings
D) Home Improvement Loans
E) Loans on Dwellings For 5+ Families
F) Non-occupant Loans on < 5 Family Dwellings (A B C & D)
G) Loans On Manufactured Home Dwelling (A B C & D)
Number
Average Value
Number
Average Value
Number
Average Value
Number
Average Value
Number
Average Value
Number
Average Value
Number
Average Value
LOANS ORIGINATED
41
$131,010
74
$143,420
208
$131,752
17
$46,246
2
$653,520
50
$120,607
22
$62,865
APPLICATIONS APPROVED, NOT ACCEPTED
4
$79,932
6
$119,097
17
$157,071
3
$41,780
0
$0
0
$0
1
$54,090
APPLICATIONS DENIED
14
$108,061
16
$89,092
128
$123,080
25
$59,718
0
$0
9
$97,593
23
$59,590
APPLICATIONS WITHDRAWN
4
$115,788
9
$191,997
43
$171,339
6
$75,598
0
$0
6
$100,118
2
$12,655
FILES CLOSED FOR INCOMPLETENESS
4
$119,790
4
$147,982
11
$167,522
0
$0
0
$0
2
$53,055
2
$198,960
Aggregated Statistics For Year 2007 (Based on 6 partial tracts)
A) FHA, FSA/RHS & VA Home Purchase Loans
B) Conventional Home Purchase Loans
C) Refinancings
D) Home Improvement Loans
F) Non-occupant Loans on < 5 Family Dwellings (A B C & D)
G) Loans On Manufactured Home Dwelling (A B C & D)
Number
Average Value
Number
Average Value
Number
Average Value
Number
Average Value
Number
Average Value
Number
Average Value
LOANS ORIGINATED
30
$113,585
131
$146,436
247
$140,024
34
$45,081
58
$148,644
25
$53,718
APPLICATIONS APPROVED, NOT ACCEPTED
1
$56,200
13
$90,482
37
$125,880
10
$30,972
3
$98,203
6
$53,382
APPLICATIONS DENIED
4
$84,330
29
$136,031
175
$112,730
31
$45,983
9
$200,124
14
$64,015
APPLICATIONS WITHDRAWN
3
$102,243
12
$241,028
72
$120,675
4
$62,112
5
$129,892
0
$0
FILES CLOSED FOR INCOMPLETENESS
0
$0
3
$118,187
23
$133,930
0
$0
0
$0
0
$0
Aggregated Statistics For Year 2006 (Based on 6 partial tracts)
A) FHA, FSA/RHS & VA Home Purchase Loans
B) Conventional Home Purchase Loans
C) Refinancings
D) Home Improvement Loans
F) Non-occupant Loans on < 5 Family Dwellings (A B C & D)
G) Loans On Manufactured Home Dwelling (A B C & D)
Number
Average Value
Number
Average Value
Number
Average Value
Number
Average Value
Number
Average Value
Number
Average Value
LOANS ORIGINATED
24
$109,199
187
$127,482
232
$113,220
49
$36,813
41
$64,176
27
$51,814
APPLICATIONS APPROVED, NOT ACCEPTED
1
$56,540
18
$80,694
40
$113,399
7
$38,894
2
$88,220
5
$69,212
APPLICATIONS DENIED
5
$69,674
58
$85,025
156
$111,533
37
$39,912
13
$77,652
32
$58,597
APPLICATIONS WITHDRAWN
1
$88,270
20
$136,302
126
$124,031
7
$65,896
7
$162,846
0
$0
FILES CLOSED FOR INCOMPLETENESS
0
$0
6
$118,643
39
$117,230
2
$54,885
0
$0
0
$0
Aggregated Statistics For Year 2005 (Based on 6 partial tracts)
A) FHA, FSA/RHS & VA Home Purchase Loans
B) Conventional Home Purchase Loans
C) Refinancings
D) Home Improvement Loans
F) Non-occupant Loans on < 5 Family Dwellings (A B C & D)
G) Loans On Manufactured Home Dwelling (A B C & D)
Number
Average Value
Number
Average Value
Number
Average Value
Number
Average Value
Number
Average Value
Number
Average Value
LOANS ORIGINATED
29
$111,817
169
$106,665
242
$102,410
37
$25,180
25
$90,632
22
$48,522
APPLICATIONS APPROVED, NOT ACCEPTED
2
$121,905
17
$110,849
47
$82,325
2
$90,105
2
$143,455
5
$48,528
APPLICATIONS DENIED
8
$103,148
51
$113,838
177
$98,898
35
$36,955
5
$147,886
25
$46,372
APPLICATIONS WITHDRAWN
4
$102,712
17
$147,265
139
$112,951
11
$153,874
3
$57,953
7
$78,059
FILES CLOSED FOR INCOMPLETENESS
1
$133,350
5
$118,074
33
$116,378
0
$0
0
$0
2
$66,320
Aggregated Statistics For Year 2004 (Based on 6 partial tracts)
A) FHA, FSA/RHS & VA Home Purchase Loans
B) Conventional Home Purchase Loans
C) Refinancings
D) Home Improvement Loans
F) Non-occupant Loans on < 5 Family Dwellings (A B C & D)
G) Loans On Manufactured Home Dwelling (A B C & D)
2002 - 2018 National Fire Incident Reporting System (NFIRS) incidents
Based on the data from the years 2002 - 2018 the average number of fires per year is 28. The highest number of reported fire incidents - 64 took place in 2016, and the least - 1 in 2006. The data has a dropping trend.
When looking into fire subcategories, the most reports belonged to: Outside Fires (52.2%), and Structure Fires (27.4%).
Fire incident types reported to NFIRS in Zip Code 30740


 Nearest zip codes: 30720, 30755, 30739, 30736, 30721, 30756.


 Based on the data from the years 2002 - 2018 the average number of fires per year is 28. The highest number of reported fire incidents - 64 took place in 2016, and the least - 1 in 2006. The data has a dropping trend.
 When looking into fire subcategories, the most reports belonged to: Outside Fires (52.2%), and Structure Fires (27.4%).