Estimated zip code population in 2022: 3,701 Zip code population in 2010: 2,666 Zip code population in 2000: 2,440
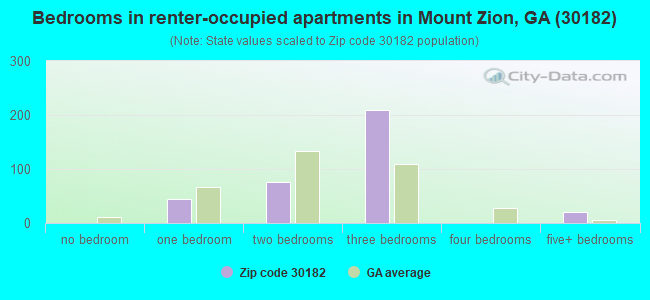
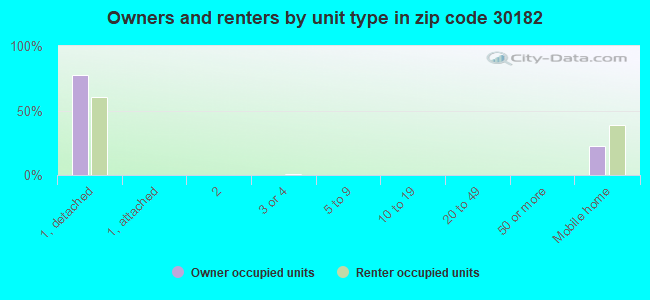
Houses and condos: 1,490 Renter-occupied apartments: 351
% of renters here:
24%
State:
34%
March 2022 cost of living index in zip code 30182: 88.5 (less than average, U.S. average is 100)
Land area: 35.6 sq. mi. Water area: 0.1 sq. mi.
Population density: 104 people per square mile
(very low).
OSM Map
General Map
Google Map
MSN Map
OSM Map
General Map
Google Map
MSN Map
OSM Map
General Map
Google Map
MSN Map
OSM Map
General Map
Google Map
MSN Map
Please wait while loading the map...
Real estate property taxes paid for housing units in 2022:
This zip code:
0.6% ($1,298)
Georgia:
0.7% ($2,160)
Median real estate property taxes paid for housing units with mortgages in 2022: $1,855 (0.7%) Median real estate property taxes paid for housing units with no mortgage in 2022: $814 (0.4%)
Business Search- 14 Million verified businesses
Males: 1,675
(45.2%)
Females: 2,027
(54.8%)
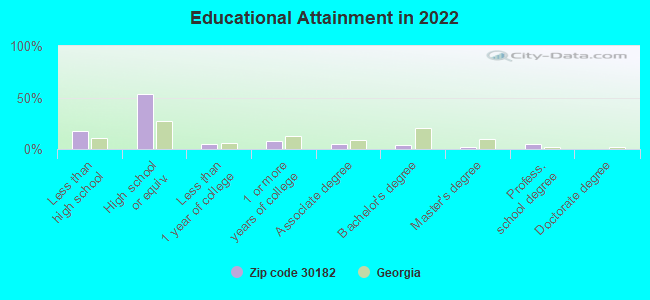
For population 25 years and over in 30182:
High school or higher: 79.7%
Bachelor's degree or higher: 11.4%
Graduate or professional degree: 7.5%
Unemployed: 3.7%
Mean travel time to work (commute): 34.4 minutes
For population 15 years and over in 30182:
Never married: 18.1%
Now married: 65.0%
Separated: 4.3%
Widowed: 4.9%
Divorced: 7.7%
Zip code 30182 compared to state average:
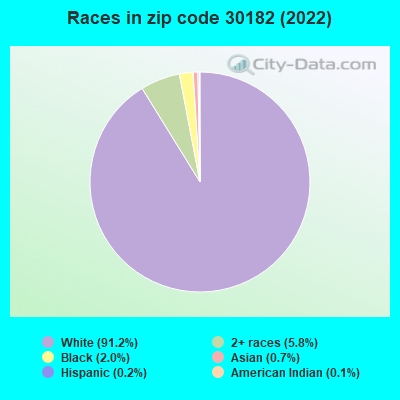
Black race population percentage significantly below state average.
Hispanic race population percentage significantly below state average.
Median age significantly above state average.
Foreign-born population percentage significantly below state average.
Length of stay since moving in significantly above state average.
Number of college students below state average.
Percentage of population with a bachelor's degree or higher significantly below state average.
Averages for the 2020 tax year for zip code 30182, filed in 2021:
Average Adjusted Gross Income (AGI) in 2020: $52,025 (Individual Income Tax Returns)
Here:
$52,025
State:
$70,847
Salary/wage: $47,101 (reported on 82.5% of returns)
Here:
$47,101
State:
$59,126
(% of AGI for various income ranges: 1086.9% for AGIs below $25k, 4332.3% for AGIs $25k-50k, 6940.8% for AGIs $50k-75k, 10070.0% for AGIs $75k-100k, 19480.0% for AGIs $100k-200k)
Taxable interest for individuals: $916 (reported on 15.1% of returns)
This zip code:
$916
Georgia:
$2,011
(% of AGI for various income ranges: 5.1% for AGIs below $25k, 10.0% for AGIs $25k-50k, 16.7% for AGIs $50k-75k, 10.0% for AGIs $75k-100k, 113.3% for AGIs $100k-200k)
Ordinary dividends: $1,025 (reported on 6.3% of returns)
Here:
$1,025
State:
$8,996
(% of AGI for various income ranges: 14.2% for AGIs $25k-50k, 50.0% for AGIs $100k-200k)
Net capital gain/loss in AGI: +$8,729 (reported on 5.6% of returns)
Here:
+$8,729
State:
+$28,402
(% of AGI for various income ranges: 678.9% for AGIs $100k-200k)
Profit/loss from business: +$8,159 (reported on 17.5% of returns)
Here:
+$8,159
State:
+$6,707
(% of AGI for various income ranges: 229.4% for AGIs below $25k, 52.3% for AGIs $25k-50k, 414.2% for AGIs $50k-75k, 398.9% for AGIs $100k-200k)
Taxable individual retirement arrangement distribution: $12,100 (reported on 4.8% of returns)
30182:
$12,100
Georgia:
$20,525
(% of AGI for various income ranges: 139.6% for AGIs $25k-50k, 453.7% for AGIs $75k-100k)
Total itemized deductions: $26,710 (reported on 7.9% of returns)
Here:
$26,710
State:
$34,001
(% of AGI for various income ranges: 650.4% for AGIs $25k-50k, 1088.9% for AGIs $100k-200k)
Charity contributions: $12,400 (reported on 7.1% of returns)
Here:
$12,400
State:
$14,164
(% of AGI for various income ranges: 322.7% for AGIs $25k-50k, 307.8% for AGIs $100k-200k)
Taxes paid: $7,183 (reported on 4.8% of returns)
30182:
$7,183
State:
$7,540
(% of AGI for various income ranges: 55.8% for AGIs $25k-50k, 317.8% for AGIs $100k-200k)
Earned income credit: $2,524 (reported on 23.0% of returns)
Here:
$2,524
State:
$2,530
(% of AGI for various income ranges: 131.7% for AGIs below $25k, 104.2% for AGIs $25k-50k)
Percentage of individuals using paid preparers for their 2020 taxes: 89.7%
Here:
90%
State:
93%
(% for various income ranges: 91.3% for AGIs below $25k, 83.3% for AGIs $25k-50k, 94.1% for AGIs $50k-75k, 91.7% for AGIs $75k-100k, 93.3% for AGIs $100k-200k)
Averages for the 2012 tax year for zip code 30182, filed in 2013:
Average Adjusted Gross Income (AGI) in 2012: $41,311 (Individual Income Tax Returns)
Here:
$41,311
State:
$56,131
Salary/wage: $39,122 (reported on 85.4% of returns)
Here:
$39,122
State:
$47,942
(% of AGI for various income ranges: 74.9% for AGIs below $25k, 87.7% for AGIs $25k-50k, 89.9% for AGIs $50k-75k, 83.9% for AGIs $75k-100k, 68.5% for AGIs $100k-200k)
Taxable interest for individuals: $1,100 (reported on 21.4% of returns)
This zip code:
$1,100
Georgia:
$1,706
(% of AGI for various income ranges: 0.5% for AGIs below $25k, 1.2% for AGIs $25k-50k, 0.2% for AGIs $50k-75k, 0.6% for AGIs $100k-200k)
Ordinary dividends: $790 (reported on 9.7% of returns)
Here:
$790
State:
$7,265
(% of AGI for various income ranges: 0.2% for AGIs $25k-50k, 0.3% for AGIs $50k-75k, 0.3% for AGIs $100k-200k)
Profit/loss from business: +$4,550 (reported on 19.4% of returns)
Here:
+$4,550
State:
+$7,583
(% of AGI for various income ranges: 10.6% for AGIs below $25k, 1.9% for AGIs $25k-50k, 0.3% for AGIs $50k-75k, 1.3% for AGIs $75k-100k)
Taxable individual retirement arrangement distribution: $9,583 (reported on 5.8% of returns)
30182:
$9,583
Georgia:
$17,199
Total itemized deductions: $18,382 (25% of AGI, reported on 27.2% of returns)
Here:
$18,382
State:
$23,886
Here:
24.8% of AGI
State:
21.5% of AGI
(% of AGI for various income ranges: 6.3% for AGIs below $25k, 9.8% for AGIs $25k-50k, 14.4% for AGIs $50k-75k, 15.8% for AGIs $75k-100k, 13.2% for AGIs $100k-200k)
Charity contributions: $3,662 (reported on 20.4% of returns)
Here:
$3,662
State:
$5,507
(% of AGI for various income ranges: 1.7% for AGIs $25k-50k, 1.9% for AGIs $50k-75k, 1.7% for AGIs $75k-100k, 2.8% for AGIs $100k-200k)
Taxes paid: $5,448 (reported on 26.2% of returns)
30182:
$5,448
State:
$7,838
(% of AGI for various income ranges: 0.8% for AGIs below $25k, 1.8% for AGIs $25k-50k, 3.6% for AGIs $50k-75k, 4.0% for AGIs $75k-100k, 5.8% for AGIs $100k-200k)
Earned income credit: $2,603 (reported on 28.2% of returns)
Here:
$2,603
State:
$2,589
(% of AGI for various income ranges: 10.0% for AGIs below $25k, 1.8% for AGIs $25k-50k)
Percentage of individuals using paid preparers for their 2012 taxes: 58.3%
Here:
58%
State:
55%
(% for various income ranges: 54.5% for AGIs below $25k, 58.6% for AGIs $25k-50k, 60.0% for AGIs $50k-75k, 71.4% for AGIs $75k-100k, 62.5% for AGIs $100k-200k)
Averages for the 2004 tax year for zip code 30182, filed in 2005:
Average Adjusted Gross Income (AGI) in 2004: $33,402 (Individual Income Tax Returns)
Here:
$33,402
State:
$47,553
Salary/wage: $33,360 (reported on 84.4% of returns)
Here:
$33,360
State:
$42,178
(% of AGI for various income ranges: 74.8% for AGIs below $10k, 79.8% for AGIs $10k-25k, 89.6% for AGIs $25k-50k, 86.6% for AGIs $50k-75k, 88.6% for AGIs $75k-100k, 69.0% for AGIs over 100k)
Taxable interest for individuals: $780 (reported on 28.7% of returns)
This zip code:
$780
Georgia:
$1,772
(% of AGI for various income ranges: 2.9% for AGIs below $10k, 0.4% for AGIs $10k-25k, 0.5% for AGIs $25k-50k, 0.3% for AGIs $50k-75k, 0.1% for AGIs $75k-100k, 2.0% for AGIs over 100k)
Taxable dividends: $454 (reported on 11.2% of returns)
Here:
$454
State:
$4,283
(% of AGI for various income ranges: 0.3% for AGIs below $10k, 0.2% for AGIs $10k-25k, 0.1% for AGIs $25k-50k, 0.1% for AGIs $50k-75k, 0.1% for AGIs $75k-100k, 0.3% for AGIs over 100k)
Net capital gain/loss: +$1,634 (reported on 6.7% of returns)
Here:
+$1,634
State:
+$16,461
(% of AGI for various income ranges: 1.6% for AGIs below $10k, 0.6% for AGIs $10k-25k, 0.1% for AGIs $25k-50k, 0.3% for AGIs $50k-75k, 0.6% for AGIs over 100k)
Profit/loss from business: +$6,559 (reported on 19.0% of returns)
Here:
+$6,559
State:
+$8,201
(% of AGI for various income ranges: 23.0% for AGIs below $10k, 9.9% for AGIs $10k-25k, 4.3% for AGIs $25k-50k, 1.7% for AGIs $50k-75k, 0.3% for AGIs $75k-100k)
Total itemized deductions: $16,563 (27% of AGI, reported on 27.6% of returns)
Here:
$16,563
State:
$19,944
Here:
26.6% of AGI
State:
22.6% of AGI
(% of AGI for various income ranges: 10.3% for AGIs $10k-25k, 11.1% for AGIs $25k-50k, 16.8% for AGIs $50k-75k, 14.2% for AGIs $75k-100k, 19.2% for AGIs over 100k)
Charity contributions deductions: $3,198 (5% of AGI, reported on 22.9% of returns)
Here:
$3,198
State:
$4,354
Here:
4.9% of AGI
State:
4.7% of AGI
(% of AGI for various income ranges: 1.1% for AGIs $10k-25k, 2.1% for AGIs $25k-50k, 2.7% for AGIs $50k-75k, 2.2% for AGIs $75k-100k, 2.9% for AGIs over 100k)
Total tax: $3,753 (reported on 69.2% of returns)
30182:
$3,753
State:
$8,223
(% of AGI for various income ranges: 4.3% for AGIs below $10k, 4.3% for AGIs $10k-25k, 5.6% for AGIs $25k-50k, 7.6% for AGIs $50k-75k, 10.0% for AGIs $75k-100k, 14.4% for AGIs over 100k)
Earned income credit: $1,820 (reported on 25.2% of returns)
Here:
$1,820
State:
$1,986
Percentage of individuals using paid preparers for their 2004 taxes: 70.5%
Here:
70%
State:
62%
(% for various income ranges: 63.5% for AGIs below $10k, 74.0% for AGIs $10k-25k, 72.6% for AGIs $25k-50k, 72.0% for AGIs $50k-75k, 68.7% for AGIs $75k-100k, 78.1% for AGIs over 100k)
Likely homosexual households (counted as self-reported same-sex unmarried-partner households)
Lesbian couples: 0.0% of all households
Gay men: 0.1% of all households
Household received Food Stamps/SNAP in the past 12 months: 110 Household did not receive Food Stamps/SNAP in the past 12 months: 1,311
Women who had a birth in the past 12 months: 2 (2 now married, 0 unmarried) Women who did not have a birth in the past 12 months: 808 (429 now married, 378 unmarried)
Housing units in zip code 30182 with a mortgage: 486 (77 second mortgage, 81 both second mortgage and home equity loan) Median monthly owner costs for units with a mortgage: $1,376 Median monthly owner costs for units without a mortgage: $468
Residents with income below the poverty level in 2022:
This zip code:
8.2%
Whole state:
12.7%
Residents with income below 50% of the poverty level in 2022:
This zip code:
6.4%
Whole state:
6.3%
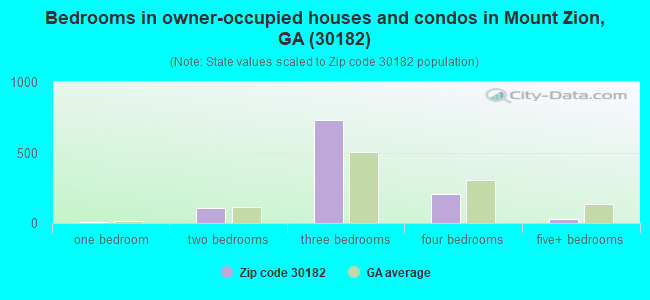
Median number of rooms in houses and condos:
Here:
6.3
State:
6.8
Median number of rooms in apartments:
Here:
4.9
State:
4.6
Notable locations in this zip code not listed on our city pages
Notable locations in zip code 30182: Camp Waco (A), Union Camp Ground (B), Kansas (C), Haralson County Fire Department Station 9 (D), Haralson County Fire Department Station 5 (E). Display/hide their locations on the map
Churches in zip code 30182 include: Antioch Church (A), Kansas Missionary Baptist Church (B), New Hope Church (C), Five Points Church (D), Shiloh Church (E), Union Church (F). Display/hide their locations on the map
Size of family households: 435 2-persons, 565 3-persons, 134 4-persons, 67 5-persons, 16 7-or-more-persons
Size of nonfamily households: 194 1-person, 19 2-persons
435 married couples with children.
203 single-parent households (9 men, 194 women).
93.9% of residents of 30182 zip code speak English at home.
0.9% of residents speak Spanish at home (100% very well).
3.5% of residents speak other Indo-European language at home (58% very well, 14% well, 29% not well).
1.7% of residents speak Asian or Pacific Island language at home (100% very well).
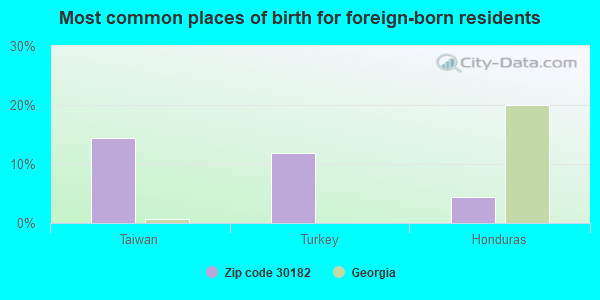
Foreign born population: 162 (4.4%) (62.6% of them are naturalized citizens)
This zip code:
4.4%
Whole state:
10.7%
14%Taiwan
12%Turkey
4%Honduras
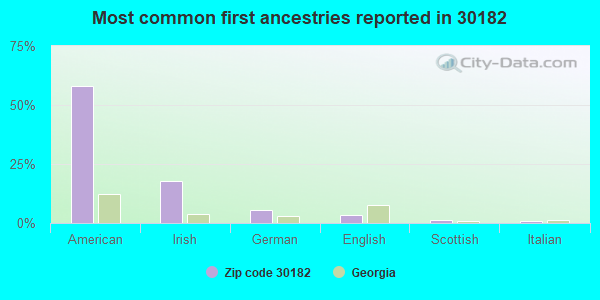
58%American
18%Irish
6%German
3%English
1%Scottish
1%Italian
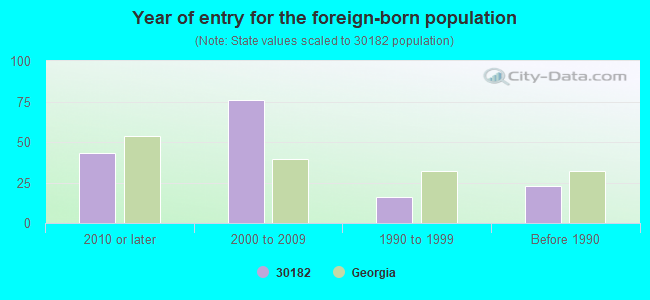
Year of entry for the foreign-born population
432010 or later
762000 to 2009
161990 to 1999
23Before 1990
Facilities with environmental interests located in this zip code:
CITY OF WACO (SOUTH WACO SCHOOL RD in WACO, GA)
National Pollutant Discharge Elimination System NON-MAJOR (Tracking pollutant discharge elimination systems) - permit Business SIC classification: SEWERAGE SYSTEMS Alternative names: WACO, CITY OF
Housing units lacking complete plumbing facilities: 4.1% Housing units lacking complete kitchen facilities: 1.5%
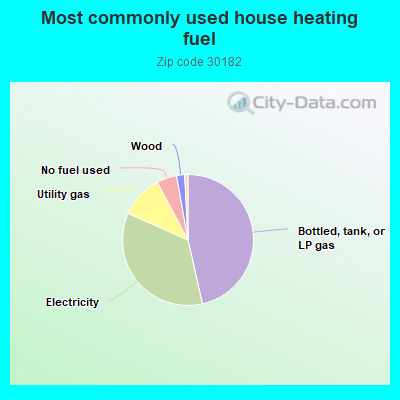
46.6%Bottled, tank, or LP gas
35.3%Electricity
10.6%Utility gas
5.0%No fuel used
2.0%Wood
0.8%Fuel oil, kerosene, etc.
Population in 1990: 2,297. Population change in the 1990s: +143 (+6.2%).
Place of birth for U.S.-born residents:
This state: 2,905
Northeast: 30
Midwest: 116
South: 348
West: 111
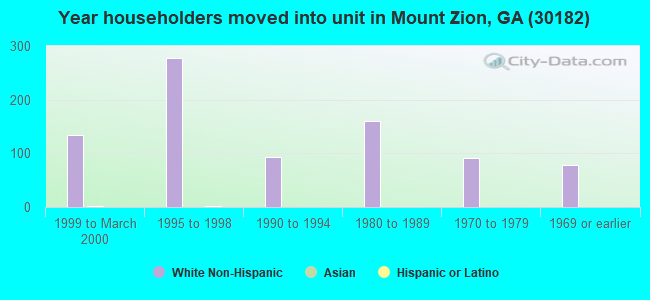
54% of the 30182 zip code residents lived in the same house 5 years ago. Out of people who lived in different houses, 43% lived in this county. Out of people who lived in different counties, 50% lived in Georgia.
91% of the 30182 zip code residents lived in the same house 1 year ago. Out of people who lived in different houses, 30% moved from this county. Out of people who lived in different houses, 67% moved from different county within same state.
Private vs. public school enrollment:
Students in private schools in grades 1 to 8 (elementary and middle school): 22
Here:
6.9%
Georgia:
12.1%
Students in private schools in grades 9 to 12 (high school): 1
Here:
0.5%
Georgia:
10.8%
Students in private undergraduate colleges:
Here:
0.0%
Georgia:
17.1%
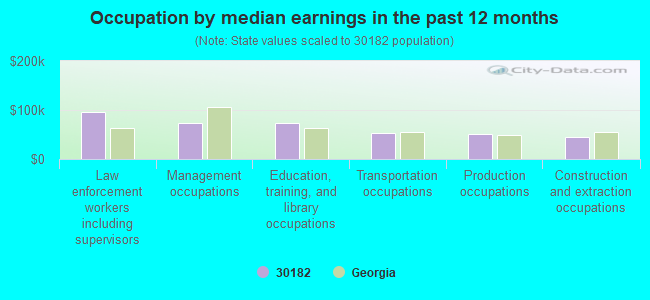
Occupation by median earnings in the past 12 months ($)
96,792Law enforcement workers including supervisors
73,428Management occupations
72,679Education, training, and library occupations
52,990Transportation occupations
51,357Production occupations
45,260Construction and extraction occupations
Companies with federal contracts located in this zip code:
FACILITIES MAINTENANCE CORPORA (109 BOWDON ST in WACO, GA; small business) : $335,297 in 16 contractsfrom 2000 to 2002
Contracts for Generators and Generators Sets, Electrical, Maintenance, Repair and Rebuilding of Equipment -- Engine Accessories, Maintenance, Repair and Rebuilding of Equipment -- Fire Fighting, Rescue, and Safety Equipment; and Environmental Protection Equipment and Materials, Adhesives, and moreby Army Signed by year:2000: $229,500; 2001: $85,987; 2002: $19,810; 2003: $0; 2004: $0; 2005: $0; 2006: $0.
Biggest contracts:
$79,500 with Army for Generators and Generators Sets, Electrical. Signed on 2000-09-27. Completion date: 2001-09-30.
$50,000 with Army for Maintenance, Repair and Rebuilding of Equipment -- Engine Accessories. Signed on 2000-09-06. Completion date: 2001-01-15.
$50,000 with Army for Maintenance, Repair and Rebuilding of Equipment -- Fire Fighting, Rescue, and Safety Equipment; and Environmental Protection Equipment and Materials. Signed on 2000-08-31. Completion date: 2001-08-31.
$50,000 with Army for Adhesives. Signed on 2000-08-30. Completion date: 2000-12-20.
MICHEAL A THOMPSON (5405 W HWY 78 in WACO, GA; small business)
$37,500 with Army for Maintenance, Repair and Rebuilding of Equipment -- Fire Fighting, Rescue, and Safety Equipment; and Environmental Protection Equipment and Materials. Signed on 2000-09-06. Completion date: 2001-08-31.
CAMPBELL, CHUCK (1466 OLD HIGHWAY 100 in WACO, GA; small business)
$34,828 with Army for Ground Effect Vehicles. Signed on 2000-09-27. Completion date: 2000-11-30.
Top industries in this zip code by the number of employees in 2005:
Accommodation and Food Services: Limited-Service Restaurants (20-49 employees: 1 establishment)
Other Services (except Public Administration): Religious Organizations (5-9: 1, 1-4: 2)
Wholesale Trade: Poultry and Poultry Product Merchant Wholesalers (5-9: 1)
Construction: Electrical Contractors (1-4: 2)
Finance and Insurance: Commercial Banking (1-4: 1)
Other Services (except Public Administration): Automotive Body, Paint, and Interior Repair and Maintenance (1-4: 1)
Construction: Residential Remodelers (1-4: 1)
Fatal accident statistics in 2014:
Fatal accident count: 1
Vehicles involved in fatal accidents: 1
Fatal accidents caused by drunken drivers: 0
Fatalities: 1
Persons involved in fatal accidents: 1
Pedestrians involved in fatal accidents: 0
Fatal accident statistics in 2011:
Fatal accident count: 3
Vehicles involved in fatal accidents: 4
Fatal accidents caused by drunken drivers: 1
Fatalities: 4
Persons involved in fatal accidents: 7
Pedestrians involved in fatal accidents: 0
Home Mortgage Disclosure Act Aggregated Statistics For Year 2009 (Based on 4 partial tracts)
A) FHA, FSA/RHS & VA Home Purchase Loans
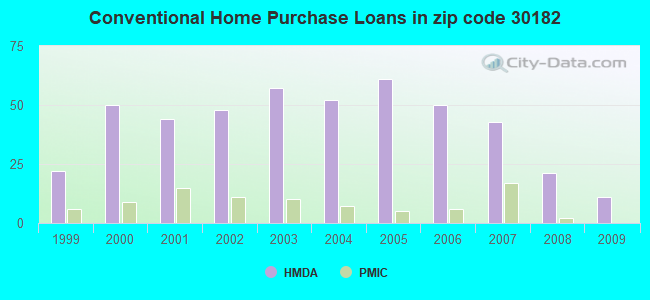
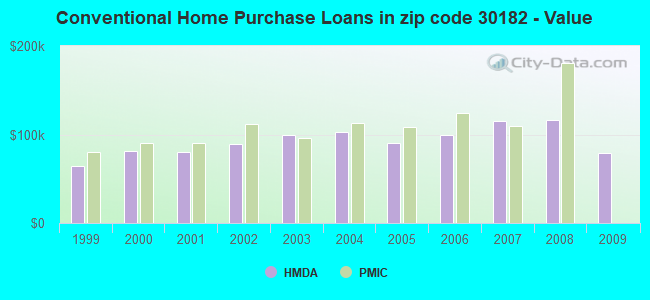
B) Conventional Home Purchase Loans
C) Refinancings
D) Home Improvement Loans
F) Non-occupant Loans on < 5 Family Dwellings (A B C & D)
G) Loans On Manufactured Home Dwelling (A B C & D)
Number
Average Value
Number
Average Value
Number
Average Value
Number
Average Value
Number
Average Value
Number
Average Value
LOANS ORIGINATED
12
$97,924
11
$79,182
76
$126,896
9
$18,161
15
$71,057
12
$42,246
APPLICATIONS APPROVED, NOT ACCEPTED
2
$94,775
1
$23,190
5
$93,246
0
$0
0
$0
1
$52,270
APPLICATIONS DENIED
2
$125,945
3
$111,067
39
$139,468
10
$35,277
3
$25,710
6
$49,848
APPLICATIONS WITHDRAWN
3
$101,567
1
$70,250
26
$135,175
2
$31,475
1
$37,480
1
$34,340
FILES CLOSED FOR INCOMPLETENESS
0
$0
0
$0
7
$157,460
0
$0
1
$53,340
0
$0
Aggregated Statistics For Year 2008 (Based on 4 partial tracts)
A) FHA, FSA/RHS & VA Home Purchase Loans
B) Conventional Home Purchase Loans
C) Refinancings
D) Home Improvement Loans
F) Non-occupant Loans on < 5 Family Dwellings (A B C & D)
G) Loans On Manufactured Home Dwelling (A B C & D)
Number
Average Value
Number
Average Value
Number
Average Value
Number
Average Value
Number
Average Value
Number
Average Value
LOANS ORIGINATED
12
$102,938
21
$116,395
94
$122,701
20
$30,535
34
$107,929
29
$58,132
APPLICATIONS APPROVED, NOT ACCEPTED
0
$0
2
$63,490
8
$85,748
3
$19,170
0
$0
3
$61,387
APPLICATIONS DENIED
2
$84,055
10
$80,988
56
$120,555
20
$25,705
6
$41,880
13
$64,977
APPLICATIONS WITHDRAWN
5
$70,016
1
$56,390
31
$141,365
3
$10,640
4
$60,628
3
$56,713
FILES CLOSED FOR INCOMPLETENESS
1
$92,330
0
$0
1
$97,850
0
$0
0
$0
0
$0
Aggregated Statistics For Year 2007 (Based on 4 partial tracts)
A) FHA, FSA/RHS & VA Home Purchase Loans
B) Conventional Home Purchase Loans
C) Refinancings
D) Home Improvement Loans
E) Loans on Dwellings For 5+ Families
F) Non-occupant Loans on < 5 Family Dwellings (A B C & D)
G) Loans On Manufactured Home Dwelling (A B C & D)
Number
Average Value
Number
Average Value
Number
Average Value
Number
Average Value
Number
Average Value
Number
Average Value
Number
Average Value
LOANS ORIGINATED
15
$126,022
43
$115,597
96
$138,097
26
$19,764
1
$289,900
27
$126,511
18
$50,506
APPLICATIONS APPROVED, NOT ACCEPTED
1
$45,800
5
$101,988
15
$118,060
3
$85,637
0
$0
2
$104,175
1
$122,190
APPLICATIONS DENIED
4
$87,722
10
$94,302
78
$120,493
21
$31,546
0
$0
8
$89,418
15
$72,010
APPLICATIONS WITHDRAWN
0
$0
9
$126,798
38
$167,487
4
$69,758
0
$0
2
$116,250
1
$97,440
FILES CLOSED FOR INCOMPLETENESS
1
$66,100
0
$0
8
$112,269
0
$0
0
$0
0
$0
1
$71,320
Aggregated Statistics For Year 2006 (Based on 4 partial tracts)
A) FHA, FSA/RHS & VA Home Purchase Loans
B) Conventional Home Purchase Loans
C) Refinancings
D) Home Improvement Loans
E) Loans on Dwellings For 5+ Families
F) Non-occupant Loans on < 5 Family Dwellings (A B C & D)
G) Loans On Manufactured Home Dwelling (A B C & D)
Number
Average Value
Number
Average Value
Number
Average Value
Number
Average Value
Number
Average Value
Number
Average Value
Number
Average Value
LOANS ORIGINATED
19
$113,091
50
$99,480
106
$119,118
19
$28,923
0
$0
32
$92,217
15
$59,543
APPLICATIONS APPROVED, NOT ACCEPTED
0
$0
4
$96,198
19
$108,829
3
$44,663
1
$1,160
1
$177,420
3
$93,230
APPLICATIONS DENIED
4
$118,570
18
$98,192
72
$122,752
24
$25,600
0
$0
9
$90,006
17
$67,652
APPLICATIONS WITHDRAWN
1
$64,600
9
$119,906
53
$136,969
3
$71,803
0
$0
3
$96,137
3
$116,423
FILES CLOSED FOR INCOMPLETENESS
0
$0
1
$32,270
16
$117,772
0
$0
0
$0
1
$110,160
1
$28,990
Aggregated Statistics For Year 2005 (Based on 4 partial tracts)
A) FHA, FSA/RHS & VA Home Purchase Loans
B) Conventional Home Purchase Loans
C) Refinancings
D) Home Improvement Loans
F) Non-occupant Loans on < 5 Family Dwellings (A B C & D)
G) Loans On Manufactured Home Dwelling (A B C & D)
Number
Average Value
Number
Average Value
Number
Average Value
Number
Average Value
Number
Average Value
Number
Average Value
LOANS ORIGINATED
16
$107,442
61
$90,287
110
$108,407
23
$45,065
33
$78,487
20
$63,590
APPLICATIONS APPROVED, NOT ACCEPTED
0
$0
8
$77,186
20
$116,342
2
$32,405
2
$52,760
4
$76,225
APPLICATIONS DENIED
3
$97,720
25
$83,957
89
$112,468
19
$48,755
10
$112,482
18
$67,773
APPLICATIONS WITHDRAWN
2
$127,785
9
$83,808
53
$121,675
5
$112,720
2
$59,510
2
$75,035
FILES CLOSED FOR INCOMPLETENESS
0
$0
2
$74,455
17
$120,407
1
$70,060
1
$69,690
1
$35,500
Aggregated Statistics For Year 2004 (Based on 4 partial tracts)
A) FHA, FSA/RHS & VA Home Purchase Loans
B) Conventional Home Purchase Loans
C) Refinancings
D) Home Improvement Loans
F) Non-occupant Loans on < 5 Family Dwellings (A B C & D)
G) Loans On Manufactured Home Dwelling (A B C & D)
Number
Average Value
Number
Average Value
Number
Average Value
Number
Average Value
Number
Average Value
Number
Average Value
LOANS ORIGINATED
18
$103,026
52
$102,367
119
$97,890
24
$33,884
38
$85,516
23
$60,038
APPLICATIONS APPROVED, NOT ACCEPTED
0
$0
5
$135,634
22
$83,122
2
$32,180
2
$75,430
8
$68,692
APPLICATIONS DENIED
2
$141,745
15
$123,722
73
$94,752
11
$36,092
8
$79,471
10
$68,735
APPLICATIONS WITHDRAWN
1
$133,280
7
$117,886
34
$97,051
4
$57,152
3
$95,773
5
$82,370
FILES CLOSED FOR INCOMPLETENESS
0
$0
1
$270,880
12
$91,268
0
$0
0
$0
2
$76,605
Aggregated Statistics For Year 2003 (Based on 4 partial tracts)
A) FHA, FSA/RHS & VA Home Purchase Loans
B) Conventional Home Purchase Loans
C) Refinancings
D) Home Improvement Loans
F) Non-occupant Loans on < 5 Family Dwellings (A B C & D)
Number
Average Value
Number
Average Value
Number
Average Value
Number
Average Value
Number
Average Value
LOANS ORIGINATED
14
$98,289
57
$98,946
160
$100,225
26
$36,886
29
$80,013
APPLICATIONS APPROVED, NOT ACCEPTED
1
$98,450
3
$125,473
16
$92,379
1
$45,220
1
$60,310
APPLICATIONS DENIED
2
$114,400
13
$79,266
70
$95,539
10
$29,290
5
$71,976
APPLICATIONS WITHDRAWN
2
$99,330
4
$110,648
21
$111,644
2
$217,940
1
$104,750
FILES CLOSED FOR INCOMPLETENESS
0
$0
2
$107,410
8
$106,489
0
$0
1
$67,260
Aggregated Statistics For Year 2002 (Based on 4 partial tracts)
A) FHA, FSA/RHS & VA Home Purchase Loans
B) Conventional Home Purchase Loans
C) Refinancings
D) Home Improvement Loans
F) Non-occupant Loans on < 5 Family Dwellings (A B C & D)
Number
Average Value
Number
Average Value
Number
Average Value
Number
Average Value
Number
Average Value
LOANS ORIGINATED
8
$97,660
48
$88,876
126
$98,047
28
$29,317
30
$70,441
APPLICATIONS APPROVED, NOT ACCEPTED
1
$19,710
7
$80,484
27
$89,219
1
$56,830
0
$0
APPLICATIONS DENIED
2
$79,150
10
$57,894
58
$86,141
8
$14,431
4
$62,800
APPLICATIONS WITHDRAWN
1
$27,250
3
$103,397
28
$99,752
0
$0
1
$96,900
FILES CLOSED FOR INCOMPLETENESS
0
$0
1
$96,100
12
$98,555
1
$43,480
1
$26,090
Aggregated Statistics For Year 2001 (Based on 4 partial tracts)
A) FHA, FSA/RHS & VA Home Purchase Loans
B) Conventional Home Purchase Loans
C) Refinancings
D) Home Improvement Loans
F) Non-occupant Loans on < 5 Family Dwellings (A B C & D)
Number
Average Value
Number
Average Value
Number
Average Value
Number
Average Value
Number
Average Value
LOANS ORIGINATED
15
$95,301
44
$80,108
112
$81,843
23
$14,246
19
$67,806
APPLICATIONS APPROVED, NOT ACCEPTED
0
$0
11
$52,249
15
$70,298
3
$39,167
1
$138,930
APPLICATIONS DENIED
1
$131,990
34
$58,958
58
$68,647
13
$12,233
4
$81,635
APPLICATIONS WITHDRAWN
1
$42,940
3
$97,767
27
$77,603
3
$7,257
1
$71,900
FILES CLOSED FOR INCOMPLETENESS
1
$108,420
1
$157,710
8
$96,012
0
$0
0
$0
Aggregated Statistics For Year 2000 (Based on 4 partial tracts)
A) FHA, FSA/RHS & VA Home Purchase Loans
B) Conventional Home Purchase Loans
C) Refinancings
D) Home Improvement Loans
F) Non-occupant Loans on < 5 Family Dwellings (A B C & D)
Number
Average Value
Number
Average Value
Number
Average Value
Number
Average Value
Number
Average Value
LOANS ORIGINATED
12
$80,159
50
$81,179
50
$71,809
25
$19,440
19
$61,797
APPLICATIONS APPROVED, NOT ACCEPTED
0
$0
10
$49,478
12
$66,777
7
$24,129
0
$0
APPLICATIONS DENIED
3
$71,533
42
$50,649
40
$51,978
13
$20,032
5
$63,934
APPLICATIONS WITHDRAWN
2
$70,915
3
$151,280
20
$58,942
2
$25,820
0
$0
FILES CLOSED FOR INCOMPLETENESS
0
$0
1
$38,850
12
$63,665
0
$0
0
$0
Aggregated Statistics For Year 1999 (Based on 2 partial tracts)
A) FHA, FSA/RHS & VA Home Purchase Loans
B) Conventional Home Purchase Loans
C) Refinancings
D) Home Improvement Loans
F) Non-occupant Loans on < 5 Family Dwellings (A B C & D)
Detailed PMIC statistics for the following Tracts:9903.00
, 9904.00
2002 - 2018 National Fire Incident Reporting System (NFIRS) incidents
Based on the data from the years 2002 - 2018 the average number of fire incidents per year is 17. The highest number of reported fires - 45 took place in 2006, and the least - 1 in 2005. The data has an increasing trend.
When looking into fire subcategories, the most reports belonged to: Outside Fires (55.9%), and Structure Fires (27.0%).
Fire incident types reported to NFIRS in Zip Code 30182

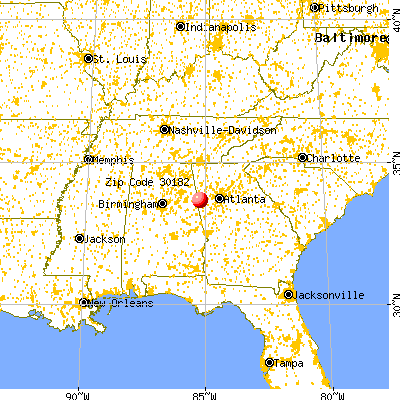


 Nearest zip codes: 30176, 30108, 30117, 30110, 36269, 30118.


 Based on the data from the years 2002 - 2018 the average number of fire incidents per year is 17. The highest number of reported fires - 45 took place in 2006, and the least - 1 in 2005. The data has an increasing trend.
 When looking into fire subcategories, the most reports belonged to: Outside Fires (55.9%), and Structure Fires (27.0%).