Estimated zip code population in 2022: 17,615 Zip code population in 2010: 14,450 Zip code population in 2000: 11,202
Houses and condos: 7,749 Renter-occupied apartments: 982
% of renters here:
14%
State:
28%
March 2022 cost of living index in zip code 29860: 90.1 (less than average, U.S. average is 100)
Land area: 52.0 sq. mi. Water area: 1.1 sq. mi.
Population density: 339 people per square mile
(very low).
OSM Map
General Map
Google Map
MSN Map
OSM Map
General Map
Google Map
MSN Map
OSM Map
General Map
Google Map
MSN Map
OSM Map
General Map
Google Map
MSN Map
Please wait while loading the map...
Real estate property taxes paid for housing units in 2022:
This zip code:
0.4% ($1,165)
South Carolina:
0.5% ($1,185)
Median real estate property taxes paid for housing units with mortgages in 2022: $1,243 (0.4%) Median real estate property taxes paid for housing units with no mortgage in 2022: $1,018 (0.4%)
Estimated median house/condo value in 2022: $280,861
29860:
$280,861
South Carolina:
$254,600
According to our research of South Carolina and other state lists, there were 3 registered sex offenders living in 29860 zip code as of May 28, 2024. The ratio of all residents to sex offenders in zip code 29860 is 5,403 to 1. The ratio of registered sex offenders to all residents in this zip code is much lower than the state average.
Median resident age:
This zip code:
44.5 years
South Carolina median age:
40.5 years
Average household size:
This zip code:
2.5 people
South Carolina:
2.4 people
Averages for the 2020 tax year for zip code 29860, filed in 2021:
Average Adjusted Gross Income (AGI) in 2020: $74,003 (Individual Income Tax Returns)
Here:
$74,003
State:
$65,754
Salary/wage: $66,244 (reported on 79.6% of returns)
Here:
$66,244
State:
$52,566
(% of AGI for various income ranges: 1124.8% for AGIs below $25k, 3757.3% for AGIs $25k-50k, 6342.5% for AGIs $50k-75k, 9618.1% for AGIs $75k-100k, 19232.6% for AGIs $100k-200k, 64749.1% for AGIs over 200k)
Taxable interest for individuals: $1,120 (reported on 31.0% of returns)
This zip code:
$1,120
South Carolina:
$1,749
(% of AGI for various income ranges: 13.6% for AGIs below $25k, 29.1% for AGIs $25k-50k, 39.6% for AGIs $50k-75k, 45.6% for AGIs $75k-100k, 72.8% for AGIs $100k-200k, 873.6% for AGIs over 200k)
Ordinary dividends: $4,931 (reported on 19.5% of returns)
Here:
$4,931
State:
$8,783
(% of AGI for various income ranges: 22.6% for AGIs below $25k, 53.9% for AGIs $25k-50k, 82.3% for AGIs $50k-75k, 106.1% for AGIs $75k-100k, 293.2% for AGIs $100k-200k, 2450.0% for AGIs over 200k)
Net capital gain/loss in AGI: +$10,353 (reported on 18.0% of returns)
Here:
+$10,353
State:
+$24,194
(% of AGI for various income ranges: 10.9% for AGIs below $25k, 40.7% for AGIs $25k-50k, 94.4% for AGIs $50k-75k, 141.9% for AGIs $75k-100k, 410.6% for AGIs $100k-200k, 8110.0% for AGIs over 200k)
Profit/loss from business: +$10,663 (reported on 18.8% of returns)
Here:
+$10,663
State:
+$11,253
(% of AGI for various income ranges: 252.2% for AGIs below $25k, 263.9% for AGIs $25k-50k, 242.4% for AGIs $50k-75k, 129.5% for AGIs $75k-100k, 357.5% for AGIs $100k-200k, 2658.2% for AGIs over 200k)
Taxable individual retirement arrangement distribution: $23,802 (reported on 10.8% of returns)
29860:
$23,802
South Carolina:
$21,604
(% of AGI for various income ranges: 49.5% for AGIs below $25k, 133.2% for AGIs $25k-50k, 311.8% for AGIs $50k-75k, 460.8% for AGIs $75k-100k, 817.9% for AGIs $100k-200k, 4730.9% for AGIs over 200k)
Total itemized deductions: $29,873 (reported on 10.4% of returns)
Here:
$29,873
State:
$35,199
(% of AGI for various income ranges: 138.4% for AGIs $25k-50k, 279.1% for AGIs $50k-75k, 525.3% for AGIs $75k-100k, 1142.0% for AGIs $100k-200k, 6466.4% for AGIs over 200k)
Charity contributions: $12,992 (reported on 9.1% of returns)
Here:
$12,992
State:
$14,319
(% of AGI for various income ranges: 38.2% for AGIs $25k-50k, 65.9% for AGIs $50k-75k, 162.7% for AGIs $75k-100k, 422.2% for AGIs $100k-200k, 3280.9% for AGIs over 200k)
Taxes paid: $7,777 (reported on 10.4% of returns)
29860:
$7,777
State:
$7,486
(% of AGI for various income ranges: 23.9% for AGIs $25k-50k, 62.3% for AGIs $50k-75k, 138.8% for AGIs $75k-100k, 334.7% for AGIs $100k-200k, 1548.2% for AGIs over 200k)
Earned income credit: $2,395 (reported on 14.0% of returns)
Here:
$2,395
State:
$2,397
(% of AGI for various income ranges: 115.0% for AGIs below $25k, 71.5% for AGIs $25k-50k)
Percentage of individuals using paid preparers for their 2020 taxes: 92.8%
Here:
93%
State:
93%
(% for various income ranges: 92.5% for AGIs below $25k, 92.4% for AGIs $25k-50k, 93.9% for AGIs $50k-75k, 92.6% for AGIs $75k-100k, 93.2% for AGIs $100k-200k, 92.1% for AGIs over 200k)
Averages for the 2012 tax year for zip code 29860, filed in 2013:
Average Adjusted Gross Income (AGI) in 2012: $61,210 (Individual Income Tax Returns)
Here:
$61,210
State:
$51,133
Salary/wage: $54,614 (reported on 82.2% of returns)
Here:
$54,614
State:
$42,173
(% of AGI for various income ranges: 67.0% for AGIs below $25k, 76.4% for AGIs $25k-50k, 74.2% for AGIs $50k-75k, 78.5% for AGIs $75k-100k, 76.6% for AGIs $100k-200k, 58.1% for AGIs over 200k)
Taxable interest for individuals: $1,075 (reported on 34.4% of returns)
This zip code:
$1,075
South Carolina:
$1,468
(% of AGI for various income ranges: 1.1% for AGIs below $25k, 0.7% for AGIs $25k-50k, 0.6% for AGIs $50k-75k, 0.4% for AGIs $75k-100k, 0.6% for AGIs $100k-200k, 0.6% for AGIs over 200k)
Ordinary dividends: $3,780 (reported on 20.1% of returns)
Here:
$3,780
State:
$6,511
(% of AGI for various income ranges: 1.3% for AGIs below $25k, 0.9% for AGIs $25k-50k, 1.1% for AGIs $50k-75k, 0.8% for AGIs $75k-100k, 1.4% for AGIs $100k-200k, 1.7% for AGIs over 200k)
Net capital gain/loss in AGI: +$4,036 (reported on 15.3% of returns)
Here:
+$4,036
State:
+$13,061
(% of AGI for various income ranges: 0.4% for AGIs $25k-50k, 0.4% for AGIs $50k-75k, 0.7% for AGIs $75k-100k, 0.9% for AGIs $100k-200k, 3.6% for AGIs over 200k)
Profit/loss from business: +$10,342 (reported on 18.4% of returns)
Here:
+$10,342
State:
+$10,167
(% of AGI for various income ranges: 15.1% for AGIs below $25k, 3.2% for AGIs $25k-50k, 1.5% for AGIs $50k-75k, 2.5% for AGIs $75k-100k, 1.2% for AGIs $100k-200k, 4.7% for AGIs over 200k)
Taxable individual retirement arrangement distribution: $18,837 (reported on 11.6% of returns)
29860:
$18,837
South Carolina:
$17,019
(% of AGI for various income ranges: 3.2% for AGIs below $25k, 2.3% for AGIs $25k-50k, 3.9% for AGIs $50k-75k, 3.2% for AGIs $75k-100k, 3.6% for AGIs $100k-200k, 4.9% for AGIs over 200k)
Self-employment retirement plans: $14,667 (reported on 0.5% of returns)
29860:
$14,667
South Carolina:
$21,023
Total itemized deductions: $21,017 (20% of AGI, reported on 41.9% of returns)
Here:
$21,017
State:
$22,890
Here:
20.4% of AGI
State:
21.4% of AGI
(% of AGI for various income ranges: 7.7% for AGIs below $25k, 13.7% for AGIs $25k-50k, 14.5% for AGIs $50k-75k, 14.9% for AGIs $75k-100k, 16.0% for AGIs $100k-200k, 13.5% for AGIs over 200k)
Charity contributions: $5,191 (reported on 37.2% of returns)
Here:
$5,191
State:
$5,169
(% of AGI for various income ranges: 1.1% for AGIs below $25k, 2.5% for AGIs $25k-50k, 2.9% for AGIs $50k-75k, 2.9% for AGIs $75k-100k, 3.6% for AGIs $100k-200k, 4.2% for AGIs over 200k)
Taxes paid: $7,358 (reported on 41.9% of returns)
29860:
$7,358
State:
$7,644
(% of AGI for various income ranges: 1.1% for AGIs below $25k, 3.0% for AGIs $25k-50k, 4.0% for AGIs $50k-75k, 5.0% for AGIs $75k-100k, 6.4% for AGIs $100k-200k, 6.3% for AGIs over 200k)
Earned income credit: $2,639 (reported on 17.6% of returns)
Here:
$2,639
State:
$2,418
(% of AGI for various income ranges: 8.9% for AGIs below $25k, 1.1% for AGIs $25k-50k)
Percentage of individuals using paid preparers for their 2012 taxes: 60.0%
Here:
60%
State:
57%
(% for various income ranges: 55.3% for AGIs below $25k, 58.8% for AGIs $25k-50k, 64.0% for AGIs $50k-75k, 64.4% for AGIs $75k-100k, 62.5% for AGIs $100k-200k, 78.6% for AGIs over 200k)
Averages for the 2004 tax year for zip code 29860, filed in 2005:
Average Adjusted Gross Income (AGI) in 2004: $53,695 (Individual Income Tax Returns)
Here:
$53,695
State:
$41,965
Salary/wage: $49,382 (reported on 86.1% of returns)
Here:
$49,382
State:
$35,695
(% of AGI for various income ranges: 89.8% for AGIs below $10k, 74.9% for AGIs $10k-25k, 79.3% for AGIs $25k-50k, 84.7% for AGIs $50k-75k, 87.6% for AGIs $75k-100k, 72.2% for AGIs over 100k)
Taxable interest for individuals: $1,327 (reported on 47.7% of returns)
This zip code:
$1,327
South Carolina:
$1,623
(% of AGI for various income ranges: 5.9% for AGIs below $10k, 2.0% for AGIs $10k-25k, 1.0% for AGIs $25k-50k, 0.8% for AGIs $50k-75k, 0.6% for AGIs $75k-100k, 1.4% for AGIs over 100k)
Taxable dividends: $2,200 (reported on 24.0% of returns)
Here:
$2,200
State:
$3,999
(% of AGI for various income ranges: 1.8% for AGIs below $10k, 1.1% for AGIs $10k-25k, 0.6% for AGIs $25k-50k, 0.5% for AGIs $50k-75k, 0.6% for AGIs $75k-100k, 1.5% for AGIs over 100k)
Net capital gain/loss: +$8,998 (reported on 18.5% of returns)
Here:
+$8,998
State:
+$13,100
(% of AGI for various income ranges: -1.7% for AGIs below $10k, -0.1% for AGIs $10k-25k, 0.5% for AGIs $25k-50k, 0.2% for AGIs $50k-75k, 0.4% for AGIs $75k-100k, 7.6% for AGIs over 100k)
Profit/loss from business: +$7,872 (reported on 17.8% of returns)
Here:
+$7,872
State:
+$9,144
(% of AGI for various income ranges: 23.7% for AGIs below $10k, 6.1% for AGIs $10k-25k, 2.6% for AGIs $25k-50k, 1.9% for AGIs $50k-75k, 1.3% for AGIs $75k-100k, 2.4% for AGIs over 100k)
IRA payment deduction: $3,378 (reported on 2.0% of returns)
29860:
$3,378
South Carolina:
$2,972
(% of AGI for various income ranges: 0.3% for AGIs $10k-25k, 0.2% for AGIs $25k-50k, 0.1% for AGIs $50k-75k, 0.1% for AGIs $75k-100k, 0.1% for AGIs over 100k)
Self-employed pension: $9,600 (reported on 0.5% of returns)
Here:
$9,600
South Carolina:
$15,117
Total itemized deductions: $18,579 (22% of AGI, reported on 48.9% of returns)
Here:
$18,579
State:
$19,039
Here:
21.6% of AGI
State:
22.8% of AGI
(% of AGI for various income ranges: 10.0% for AGIs below $10k, 9.2% for AGIs $10k-25k, 15.4% for AGIs $25k-50k, 19.4% for AGIs $50k-75k, 18.4% for AGIs $75k-100k, 16.9% for AGIs over 100k)
Charity contributions deductions: $4,492 (5% of AGI, reported on 45.6% of returns)
Here:
$4,492
State:
$4,305
Here:
5.1% of AGI
State:
5.0% of AGI
(% of AGI for various income ranges: 1.0% for AGIs below $10k, 1.6% for AGIs $10k-25k, 2.9% for AGIs $25k-50k, 3.6% for AGIs $50k-75k, 3.7% for AGIs $75k-100k, 4.8% for AGIs over 100k)
Total tax: $7,267 (reported on 79.2% of returns)
29860:
$7,267
State:
$6,497
(% of AGI for various income ranges: 5.2% for AGIs below $10k, 3.9% for AGIs $10k-25k, 6.3% for AGIs $25k-50k, 8.2% for AGIs $50k-75k, 9.6% for AGIs $75k-100k, 15.4% for AGIs over 100k)
Earned income credit: $1,943 (reported on 14.9% of returns)
Here:
$1,943
State:
$1,882
Percentage of individuals using paid preparers for their 2004 taxes: 66.7%
Here:
67%
State:
66%
(% for various income ranges: 60.3% for AGIs below $10k, 72.5% for AGIs $10k-25k, 70.9% for AGIs $25k-50k, 68.8% for AGIs $50k-75k, 62.9% for AGIs $75k-100k, 61.7% for AGIs over 100k)
Household received Food Stamps/SNAP in the past 12 months: 542 Household did not receive Food Stamps/SNAP in the past 12 months: 6,530
Women who had a birth in the past 12 months: 273 (174 now married, 99 unmarried) Women who did not have a birth in the past 12 months: 3,442 (1,817 now married, 1,637 unmarried)
Housing units in zip code 29860 with a mortgage: 3,882 (366 second mortgage, 23 home equity loan, 307 both second mortgage and home equity loan) Houses without a mortgage: 88
Median monthly owner costs for units with a mortgage: $1,375 Median monthly owner costs for units without a mortgage: $453
Residents with income below the poverty level in 2022:
This zip code:
6.1%
Whole state:
14.0%
Residents with income below 50% of the poverty level in 2022:
This zip code:
4.6%
Whole state:
7.3%
Median number of rooms in houses and condos:
Here:
6.7
State:
6.4
Median number of rooms in apartments:
Here:
6.3
State:
4.5
Notable locations in this zip code not listed on our city pages
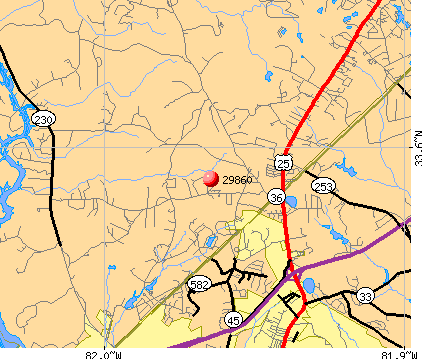
Notable locations in zip code 29860: North Augusta Golf Club (A), Merriwether Fire Department (B), County Line Fire Department (C), Merriwether Fire Department (D), North Augusta Fire Department Station 2 (E), Belvedere Fire Department (F). Display/hide their locations on the map
Churches in zip code 29860 include: Old Macedonia Church (A), Bethlehem Church (B), Mims Grove Church (C), Big Stevens Creek Church (D), Mealing Grove Baptist Church (E), Young Macedonia Church (F), Sweetwater Baptist Church (G). Display/hide their locations on the map
Reservoirs: Willow Wicks Lake (A), Laurel Lake (B), One of the Arrowhead Lakes (C), Rainsford Pond (D), Gregorys Lake (E), Swints Lake (F). Display/hide their locations on the map
In group quarters: 229 (-1 institutionalized population)
Size of family households: 3,466 2-persons, 994 3-persons, 621 4-persons, 435 5-persons, 120 6-persons, 97 7-or-more-persons
Size of nonfamily households: 1,256 1-person, 117 2-persons, 21 3-persons
2,501 married couples with children.
490 single-parent households (250 men, 240 women).
95.6% of residents of 29860 zip code speak English at home.
3.8% of residents speak Spanish at home (51% very well, 21% well, 8% not well, 20% not at all).
0.1% of residents speak other Indo-European language at home (100% very well).
Foreign born population: 560 (3.2%) (58.1% of them are naturalized citizens)
This zip code:
3.2%
Whole state:
5.2%
39%Honduras
25%Bhutan
10%Sweden
9%Barbados
6%England
5%France
4%Scotland
27%American
10%English
10%German
4%Irish
3%Norwegian
2%Scotch-Irish
2%Italian
Year of entry for the foreign-born population
192010 or later
4242000 to 2009
1181990 to 1999
164Before 1990
Facilities with environmental interests located in this zip code:
BP OIL COMPANY SWEETWATER TERMINAL (221 SWEETWATER ROAD HIGHWAY 36 in NORTH AUGUSTA, SC)
Conditionally Exempt Small Quantity Generators, less than 100 kg/month of hazardous waste (Resource Conservation and Recovery Act (tracking hazardous waste)) - notification HAZARDOUS WASTE BIENNIAL REPORTER (Resource Conservation and Recovery Act (tracking hazardous waste)) STATE MASTER (South Carolina database) - AIR MAJOR, AIR PROGRAM, National Pollutant Discharge Elimination System Permit STATE MASTER (South Carolina database) - HAZARDOUS WASTE PROGRAM STATE MASTER (South Carolina database) - UNDERGROUND STORAGE TANK PROGRAM TRI REPORTER (Tracking of toxic chemicals releasing facilities) Business SIC classification: PETROLEUM BULK STATIONS AND TERMINALS Organizations: TRC ENVIRONMENTAL CORPORATION (CONTACT/ENGINEERING/CONSULTING FIRM)
Alternative names: BP AMOCO, BP EXPLORATION & OIL INC - SWEETWATER TERMINAL
COLONIAL PIPLINE COMPANY NORTH AUGUSTA DISTRIBUTION FACILITY (219 SWEETWATER ROAD in NORTH AUGUSTA, SC)
Conditionally Exempt Small Quantity Generators, less than 100 kg/month of hazardous waste (Resource Conservation and Recovery Act (tracking hazardous waste)) - notification STATE MASTER (South Carolina database) - AIR PROGRAM, HAZARDOUS WASTE PROGRAM Business SIC classification: REFINED PETROLEUM PIPELINES Alternative names: COLONIAL PIPLINE CO-NA DELIVERY FA, COLONIAL PIPLINE CO NA DELIVERY FAC
Housing units lacking complete plumbing facilities: 2.5% Housing units lacking complete kitchen facilities: 2.7%
65.6%Electricity
27.4%Utility gas
5.6%Bottled, tank, or LP gas
0.6%Fuel oil, kerosene, etc.
0.5%No fuel used
Place of birth for U.S.-born residents:
This state: 4,789
Northeast: 862
Midwest: 1,896
South: 8,892
West: 602
66% of the 29860 zip code residents lived in the same house 5 years ago. Out of people who lived in different houses, 36% lived in this county. Out of people who lived in different counties, 50% lived in South Carolina.
92% of the 29860 zip code residents lived in the same house 1 year ago. Out of people who lived in different houses, 12% moved from this county. Out of people who lived in different houses, 35% moved from different county within same state. Out of people who lived in different houses, 61% moved from different state.
Private vs. public school enrollment:
Students in private schools in grades 1 to 8 (elementary and middle school): 388
Here:
20.4%
South Carolina:
14.4%
Students in private schools in grades 9 to 12 (high school): 18
Here:
3.6%
South Carolina:
11.1%
Students in private undergraduate colleges: 29
Here:
7.9%
South Carolina:
21.9%
Occupation by median earnings in the past 12 months ($)
172,821Fire fighting and prevention, and other protective service workers including supervisors
121,288Architecture and engineering occupations
89,036Business and financial operations occupations
87,563Health diagnosing and treating practitioners and other technical occupations
79,998Computer and mathematical occupations
74,023Life, physical, and social science occupations
Companies with federal contracts located in this zip code:
HAGLER SYSTEMS INC (890 W FIVE NOTCH RD in NORTH AUGUSTA, SC; small business) : $250,067 in 9 contractsfrom 2000 to 2006
Contracts for Power and Hand Pumps, Miscellaneous Ship and Marine Equipment, Ship and Boat Propulsion Components, Inspection Services (including commercial testing and lab services, except medical/dental) -- Ship and Marine Equipment, and moreby Bureau of Reclamation, Army, U.S. Army Corps of Engineers - civil program financing only Signed by year:2000: $157,000; 2001: $0; 2002: $0; 2003: $0; 2004: $8,600; 2005: $23,562; 2006: $60,905.
Biggest contracts:
$157,000 with Bureau of Reclamation for Power and Hand Pumps. Taking place in GA. Signed on 2000-06-15. Completion date: 2000-09-15.
$42,768 with Army for Miscellaneous Ship and Marine Equipment. Taking place in TN. Signed on 2006-07-11. Completion date: 2006-11-29.
$13,255 with Army for Miscellaneous Ship and Marine Equipment. Signed on 2006-06-09. Completion date: 2006-07-13.
$13,117 with Bureau of Reclamation for Miscellaneous Ship and Marine Equipment. Taking place in AZ. Signed on 2005-12-22. Completion date: 2006-03-31.
Top industries in this zip code by the number of employees in 2005:
Arts, Entertainment, and Recreation: Golf Courses and Country Clubs (50-99 employees: 1 establishment, 20-49 employees: 1 establishment, 1-4 employees: 1 establishment)
Accommodation and Food Services: Limited-Service Restaurants (20-49: 2, 10-19: 1)
Administrative and Support and Waste Management and Remediation Services: Landscaping Services (10-19: 3, 5-9: 2, 1-4: 3)
Construction: Land Subdivision (20-49: 1, 1-4: 1)
Accommodation and Food Services: Full-Service Restaurants (20-49: 1)
People in group quarters in 2010:
169 people in nursing facilities/skilled-nursing facilities
People in group quarters in 2000:
123 people in nursing homes
21 people in other noninstitutional group quarters
Fatal accident statistics in 2014:
Fatal accident count: 1
Vehicles involved in fatal accidents: 1
Fatal accidents caused by drunken drivers: 0
Fatalities: 1
Persons involved in fatal accidents: 1
Pedestrians involved in fatal accidents: 0
Fatal accident statistics in 2013:
Fatal accident count: 1
Vehicles involved in fatal accidents: 1
Fatal accidents caused by drunken drivers: 0
Fatalities: 1
Persons involved in fatal accidents: 1
Pedestrians involved in fatal accidents: 1
Home Mortgage Disclosure Act Aggregated Statistics For Year 2009 (Based on 2 partial tracts)
A) FHA, FSA/RHS & VA Home Purchase Loans
B) Conventional Home Purchase Loans
C) Refinancings
D) Home Improvement Loans
F) Non-occupant Loans on < 5 Family Dwellings (A B C & D)
G) Loans On Manufactured Home Dwelling (A B C & D)
Number
Average Value
Number
Average Value
Number
Average Value
Number
Average Value
Number
Average Value
Number
Average Value
LOANS ORIGINATED
84
$158,061
49
$134,514
225
$154,951
8
$141,240
9
$147,260
5
$19,662
APPLICATIONS APPROVED, NOT ACCEPTED
1
$222,670
1
$100,670
15
$149,471
0
$0
0
$0
0
$0
APPLICATIONS DENIED
2
$199,570
6
$152,985
49
$159,967
7
$27,071
0
$0
2
$86,460
APPLICATIONS WITHDRAWN
2
$117,255
2
$189,505
50
$148,429
2
$26,650
0
$0
0
$0
FILES CLOSED FOR INCOMPLETENESS
0
$0
2
$165,815
11
$195,211
1
$140,940
0
$0
0
$0
Aggregated Statistics For Year 2008 (Based on 2 partial tracts)
A) FHA, FSA/RHS & VA Home Purchase Loans
B) Conventional Home Purchase Loans
C) Refinancings
D) Home Improvement Loans
F) Non-occupant Loans on < 5 Family Dwellings (A B C & D)
G) Loans On Manufactured Home Dwelling (A B C & D)
Number
Average Value
Number
Average Value
Number
Average Value
Number
Average Value
Number
Average Value
Number
Average Value
LOANS ORIGINATED
52
$146,364
65
$133,928
104
$149,177
9
$60,141
8
$111,778
6
$39,283
APPLICATIONS APPROVED, NOT ACCEPTED
0
$0
6
$225,825
18
$119,361
1
$10,660
0
$0
0
$0
APPLICATIONS DENIED
4
$115,182
4
$81,132
39
$147,382
14
$70,303
1
$105,410
2
$79,945
APPLICATIONS WITHDRAWN
2
$180,030
6
$119,625
37
$174,651
1
$76,990
1
$80,540
1
$76,990
FILES CLOSED FOR INCOMPLETENESS
0
$0
5
$127,442
11
$194,565
4
$63,365
0
$0
1
$76,990
Aggregated Statistics For Year 2007 (Based on 2 partial tracts)
A) FHA, FSA/RHS & VA Home Purchase Loans
B) Conventional Home Purchase Loans
C) Refinancings
D) Home Improvement Loans
F) Non-occupant Loans on < 5 Family Dwellings (A B C & D)
G) Loans On Manufactured Home Dwelling (A B C & D)
Number
Average Value
Number
Average Value
Number
Average Value
Number
Average Value
Number
Average Value
Number
Average Value
LOANS ORIGINATED
30
$140,944
178
$132,979
121
$123,148
12
$54,581
17
$98,026
13
$59,767
APPLICATIONS APPROVED, NOT ACCEPTED
0
$0
18
$124,164
20
$111,096
5
$67,274
0
$0
4
$67,215
APPLICATIONS DENIED
6
$154,367
15
$153,735
62
$146,464
24
$70,719
5
$92,856
6
$77,183
APPLICATIONS WITHDRAWN
2
$113,700
11
$103,905
30
$151,603
6
$84,685
4
$86,165
1
$28,430
FILES CLOSED FOR INCOMPLETENESS
1
$200,160
4
$130,580
13
$172,194
1
$67,510
1
$170,550
0
$0
Aggregated Statistics For Year 2006 (Based on 2 partial tracts)
A) FHA, FSA/RHS & VA Home Purchase Loans
B) Conventional Home Purchase Loans
C) Refinancings
D) Home Improvement Loans
F) Non-occupant Loans on < 5 Family Dwellings (A B C & D)
G) Loans On Manufactured Home Dwelling (A B C & D)
Number
Average Value
Number
Average Value
Number
Average Value
Number
Average Value
Number
Average Value
Number
Average Value
LOANS ORIGINATED
36
$147,425
227
$127,717
115
$130,562
17
$57,339
17
$146,796
5
$64,906
APPLICATIONS APPROVED, NOT ACCEPTED
0
$0
15
$124,678
23
$70,034
0
$0
0
$0
2
$113,700
APPLICATIONS DENIED
2
$82,315
12
$110,149
40
$127,590
21
$19,796
4
$68,695
4
$60,700
APPLICATIONS WITHDRAWN
4
$125,548
14
$140,774
39
$127,854
4
$126,730
0
$0
1
$17,770
FILES CLOSED FOR INCOMPLETENESS
1
$207,270
0
$0
11
$156,448
0
$0
0
$0
0
$0
Aggregated Statistics For Year 2005 (Based on 2 partial tracts)
A) FHA, FSA/RHS & VA Home Purchase Loans
B) Conventional Home Purchase Loans
C) Refinancings
D) Home Improvement Loans
F) Non-occupant Loans on < 5 Family Dwellings (A B C & D)
G) Loans On Manufactured Home Dwelling (A B C & D)
Number
Average Value
Number
Average Value
Number
Average Value
Number
Average Value
Number
Average Value
Number
Average Value
LOANS ORIGINATED
36
$131,962
168
$129,833
109
$133,500
11
$95,829
13
$176,293
2
$24,870
APPLICATIONS APPROVED, NOT ACCEPTED
0
$0
17
$110,846
27
$98,524
5
$39,796
0
$0
0
$0
APPLICATIONS DENIED
2
$178,845
21
$88,040
56
$104,756
20
$58,214
5
$84,330
11
$63,204
APPLICATIONS WITHDRAWN
1
$187,140
12
$128,803
38
$141,505
2
$33,165
2
$114,885
0
$0
FILES CLOSED FOR INCOMPLETENESS
0
$0
5
$114,176
25
$141,560
2
$44,415
1
$144,500
0
$0
Aggregated Statistics For Year 2004 (Based on 2 partial tracts)
A) FHA, FSA/RHS & VA Home Purchase Loans
B) Conventional Home Purchase Loans
C) Refinancings
D) Home Improvement Loans
F) Non-occupant Loans on < 5 Family Dwellings (A B C & D)
G) Loans On Manufactured Home Dwelling (A B C & D)
Number
Average Value
Number
Average Value
Number
Average Value
Number
Average Value
Number
Average Value
Number
Average Value
LOANS ORIGINATED
45
$135,180
149
$124,378
108
$127,784
8
$41,158
1
$76,990
5
$40,270
APPLICATIONS APPROVED, NOT ACCEPTED
0
$0
9
$107,649
20
$102,569
1
$296,100
0
$0
1
$94,750
APPLICATIONS DENIED
0
$0
18
$102,977
68
$121,366
9
$44,086
1
$81,720
12
$72,939
APPLICATIONS WITHDRAWN
1
$194,240
7
$135,867
65
$141,381
4
$24,578
0
$0
0
$0
FILES CLOSED FOR INCOMPLETENESS
0
$0
1
$172,920
20
$131,172
0
$0
0
$0
1
$114,890
Aggregated Statistics For Year 2003 (Based on 2 partial tracts)
A) FHA, FSA/RHS & VA Home Purchase Loans
B) Conventional Home Purchase Loans
C) Refinancings
D) Home Improvement Loans
F) Non-occupant Loans on < 5 Family Dwellings (A B C & D)
Number
Average Value
Number
Average Value
Number
Average Value
Number
Average Value
Number
Average Value
LOANS ORIGINATED
53
$117,457
144
$122,610
329
$117,626
9
$119,230
8
$91,346
APPLICATIONS APPROVED, NOT ACCEPTED
0
$0
5
$113,940
32
$96,010
1
$153,970
0
$0
APPLICATIONS DENIED
4
$86,460
15
$106,280
59
$117,316
11
$23,042
4
$45,008
APPLICATIONS WITHDRAWN
5
$107,544
14
$139,167
37
$116,999
6
$19,148
0
$0
FILES CLOSED FOR INCOMPLETENESS
0
$0
2
$166,410
11
$142,451
0
$0
0
$0
Aggregated Statistics For Year 2002 (Based on 2 partial tracts)
A) FHA, FSA/RHS & VA Home Purchase Loans
B) Conventional Home Purchase Loans
C) Refinancings
D) Home Improvement Loans
F) Non-occupant Loans on < 5 Family Dwellings (A B C & D)
Number
Average Value
Number
Average Value
Number
Average Value
Number
Average Value
Number
Average Value
LOANS ORIGINATED
43
$110,259
148
$117,128
195
$117,663
12
$16,187
9
$97,779
APPLICATIONS APPROVED, NOT ACCEPTED
0
$0
5
$93,568
15
$131,863
0
$0
0
$0
APPLICATIONS DENIED
1
$307,940
14
$65,311
51
$98,979
5
$22,030
4
$51,818
APPLICATIONS WITHDRAWN
2
$150,420
11
$95,936
38
$105,069
0
$0
0
$0
FILES CLOSED FOR INCOMPLETENESS
0
$0
2
$74,615
14
$89,676
0
$0
1
$56,850
Aggregated Statistics For Year 2001 (Based on 2 partial tracts)
A) FHA, FSA/RHS & VA Home Purchase Loans
B) Conventional Home Purchase Loans
C) Refinancings
D) Home Improvement Loans
F) Non-occupant Loans on < 5 Family Dwellings (A B C & D)
Number
Average Value
Number
Average Value
Number
Average Value
Number
Average Value
Number
Average Value
LOANS ORIGINATED
40
$106,300
103
$108,045
147
$103,986
20
$23,036
9
$46,323
APPLICATIONS APPROVED, NOT ACCEPTED
0
$0
8
$69,139
13
$138,028
2
$31,980
0
$0
APPLICATIONS DENIED
1
$158,710
24
$69,139
45
$87,330
6
$26,255
4
$52,705
APPLICATIONS WITHDRAWN
2
$140,350
6
$67,905
30
$96,331
1
$23,690
1
$75,800
FILES CLOSED FOR INCOMPLETENESS
0
$0
1
$68,700
6
$54,877
0
$0
0
$0
Aggregated Statistics For Year 2000 (Based on 2 partial tracts)
A) FHA, FSA/RHS & VA Home Purchase Loans
B) Conventional Home Purchase Loans
C) Refinancings
D) Home Improvement Loans
F) Non-occupant Loans on < 5 Family Dwellings (A B C & D)
Number
Average Value
Number
Average Value
Number
Average Value
Number
Average Value
Number
Average Value
LOANS ORIGINATED
12
$94,949
95
$104,053
46
$80,745
20
$11,252
7
$55,159
APPLICATIONS APPROVED, NOT ACCEPTED
0
$0
8
$80,242
9
$96,726
4
$29,905
0
$0
APPLICATIONS DENIED
2
$56,850
9
$59,747
27
$75,582
6
$9,080
0
$0
APPLICATIONS WITHDRAWN
1
$124,360
9
$100,016
18
$95,410
1
$14,210
1
$31,980
FILES CLOSED FOR INCOMPLETENESS
0
$0
0
$0
0
$0
0
$0
0
$0
Aggregated Statistics For Year 1999 (Based on 1 partial tract)
A) FHA, FSA/RHS & VA Home Purchase Loans
B) Conventional Home Purchase Loans
C) Refinancings
D) Home Improvement Loans
E) Loans on Dwellings For 5+ Families
F) Non-occupant Loans on < 5 Family Dwellings (A B C & D)
Detailed PMIC statistics for the following Tracts:0205.00
2002 - 2018 National Fire Incident Reporting System (NFIRS) incidents
According to the data from the years 2002 - 2018 the average number of fire incidents per year is 36. The highest number of reported fire incidents - 66 took place in 2004, and the least - 2 in 2011. The data has a rising trend.
When looking into fire subcategories, the most incidents belonged to: Outside Fires (49.4%), and Structure Fires (33.1%).
Fire incident types reported to NFIRS in Zip Code 29860

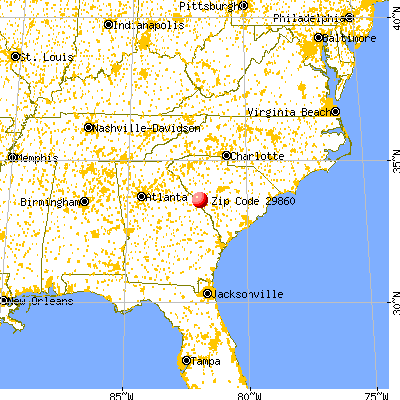


 Nearest zip codes: 29841, 29821, 29829, 30907, 30904, 30912.


 According to the data from the years 2002 - 2018 the average number of fire incidents per year is 36. The highest number of reported fire incidents - 66 took place in 2004, and the least - 2 in 2011. The data has a rising trend.
 When looking into fire subcategories, the most incidents belonged to: Outside Fires (49.4%), and Structure Fires (33.1%).