Estimated zip code population in 2022: 31,106
Zip code population in 2010: 22,281
Zip code population in 2000: 15,018
Houses and condos: 12,177
Renter-occupied apartments: 2,153
% of renters here:
18%State:
28%
March 2022 cost of living index in zip code 29316: 83.2
(low, U.S. average is 100)
Land area: 21.8
sq. mi.
Water area: 0.0
sq. mi.
Population density: 1,429 people per square mile (low).
OSM Map
General Map
Google Map
MSN Map
OSM Map
General Map
Google Map
MSN Map
OSM Map
General Map
Google Map
MSN Map
OSM Map
General Map
Google Map
MSN Map
Please wait while loading the map...
Real estate property taxes paid for housing units in 2022:
This zip code:
0.5% ($1,231)South Carolina:
0.5% ($1,185)
Median real estate property taxes paid for housing units with mortgages in 2022: $1,311 (0.5%)
Median real estate property taxes paid for housing units with no mortgage in 2022: $993 (0.5%)
Profiles of local businesses
Business Search - 14 Million verified businesses
Males: 14,182 Females: 16,930
For population 25 years and over in 29316:
High school or higher: 94.6%Bachelor's degree or higher: 27.5%Graduate or professional degree: 10.3%Unemployed: 3.0%Mean travel time to work (commute): 24.2 minutes
For population 15 years and over in 29316:
Never married: 21.6%Now married: 62.0%Separated: 1.4%Widowed: 5.8%Divorced: 9.2%
Zip code 29316 compared to state average:
Black race population percentage below state average. Median age below state average. Renting percentage below state average. House age below state average. 23,218 74.6% White 4,280 13.8% Black 1,502 4.8% Hispanic or Latino 1,187 3.8% Asian 841 2.7% Two or more races 42 0.1% American Indian 33 0.1% Some other race
Data:
Median household income ($)
Median household income (% change since 2000)
Household income diversity
Ratio of average income to average house value (%)
Ratio of average income to average rent
Median household income ($) - White
Median household income ($) - Black or African American
Median household income ($) - Asian
Median household income ($) - Hispanic or Latino
Median household income ($) - American Indian and Alaska Native
Median household income ($) - Multirace
Median household income ($) - Other Race
Median household income for houses/condos with a mortgage ($)
Median household income for apartments without a mortgage ($)
Races - White alone (%)
Races - White alone (% change since 2000)
Races - Black alone (%)
Races - Black alone (% change since 2000)
Races - American Indian alone (%)
Races - American Indian alone (% change since 2000)
Races - Asian alone (%)
Races - Asian alone (% change since 2000)
Races - Hispanic (%)
Races - Hispanic (% change since 2000)
Races - Native Hawaiian and Other Pacific Islander alone (%)
Races - Native Hawaiian and Other Pacific Islander alone (% change since 2000)
Races - Two or more races (%)
Races - Two or more races (% change since 2000)
Races - Other race alone (%)
Races - Other race alone (% change since 2000)
Racial diversity
Unemployment (%)
Unemployment (% change since 2000)
Unemployment (%) - White
Unemployment (%) - Black or African American
Unemployment (%) - Asian
Unemployment (%) - Hispanic or Latino
Unemployment (%) - American Indian and Alaska Native
Unemployment (%) - Multirace
Unemployment (%) - Other Race
Population density (people per square mile)
Population - Males (%)
Population - Females (%)
Population - Males (%) - White
Population - Males (%) - Black or African American
Population - Males (%) - Asian
Population - Males (%) - Hispanic or Latino
Population - Males (%) - American Indian and Alaska Native
Population - Males (%) - Multirace
Population - Males (%) - Other Race
Population - Females (%) - White
Population - Females (%) - Black or African American
Population - Females (%) - Asian
Population - Females (%) - Hispanic or Latino
Population - Females (%) - American Indian and Alaska Native
Population - Females (%) - Multirace
Population - Females (%) - Other Race
Coronavirus confirmed cases (May 29, 2024)
Deaths caused by coronavirus (May 29, 2024)
Coronavirus confirmed cases (per 100k population) (May 29, 2024)
Deaths caused by coronavirus (per 100k population) (May 29, 2024)
Daily increase in number of cases (May 29, 2024)
Weekly increase in number of cases (May 29, 2024)
Cases doubled (in days) (May 29, 2024)
Hospitalized patients (Apr 18, 2022)
Negative test results (Apr 18, 2022)
Total test results (Apr 18, 2022)
COVID Vaccine doses distributed (per 100k population) (Sep 19, 2023)
COVID Vaccine doses administered (per 100k population) (Sep 19, 2023)
COVID Vaccine doses distributed (Sep 19, 2023)
COVID Vaccine doses administered (Sep 19, 2023)
Likely homosexual households (%)
Likely homosexual households (% change since 2000)
Likely homosexual households - Lesbian couples (%)
Likely homosexual households - Lesbian couples (% change since 2000)
Likely homosexual households - Gay men (%)
Likely homosexual households - Gay men (% change since 2000)
Cost of living index
Median gross rent ($)
Median contract rent ($)
Median monthly housing costs ($)
Median house or condo value ($)
Median house or condo value ($ change since 2000)
Mean house or condo value by units in structure - 1, detached ($)
Mean house or condo value by units in structure - 1, attached ($)
Mean house or condo value by units in structure - 2 ($)
Mean house or condo value by units in structure by units in structure - 3 or 4 ($)
Mean house or condo value by units in structure - 5 or more ($)
Mean house or condo value by units in structure - Boat, RV, van, etc. ($)
Mean house or condo value by units in structure - Mobile home ($)
Median house or condo value ($) - White
Median house or condo value ($) - Black or African American
Median house or condo value ($) - Asian
Median house or condo value ($) - Hispanic or Latino
Median house or condo value ($) - American Indian and Alaska Native
Median house or condo value ($) - Multirace
Median house or condo value ($) - Other Race
Median resident age
Resident age diversity
Median resident age - Males
Median resident age - Females
Median resident age - White
Median resident age - Black or African American
Median resident age - Asian
Median resident age - Hispanic or Latino
Median resident age - American Indian and Alaska Native
Median resident age - Multirace
Median resident age - Other Race
Median resident age - Males - White
Median resident age - Males - Black or African American
Median resident age - Males - Asian
Median resident age - Males - Hispanic or Latino
Median resident age - Males - American Indian and Alaska Native
Median resident age - Males - Multirace
Median resident age - Males - Other Race
Median resident age - Females - White
Median resident age - Females - Black or African American
Median resident age - Females - Asian
Median resident age - Females - Hispanic or Latino
Median resident age - Females - American Indian and Alaska Native
Median resident age - Females - Multirace
Median resident age - Females - Other Race
Commute - mean travel time to work (minutes)
Travel time to work - Less than 5 minutes (%)
Travel time to work - Less than 5 minutes (% change since 2000)
Travel time to work - 5 to 9 minutes (%)
Travel time to work - 5 to 9 minutes (% change since 2000)
Travel time to work - 10 to 19 minutes (%)
Travel time to work - 10 to 19 minutes (% change since 2000)
Travel time to work - 20 to 29 minutes (%)
Travel time to work - 20 to 29 minutes (% change since 2000)
Travel time to work - 30 to 39 minutes (%)
Travel time to work - 30 to 39 minutes (% change since 2000)
Travel time to work - 40 to 59 minutes (%)
Travel time to work - 40 to 59 minutes (% change since 2000)
Travel time to work - 60 to 89 minutes (%)
Travel time to work - 60 to 89 minutes (% change since 2000)
Travel time to work - 90 or more minutes (%)
Travel time to work - 90 or more minutes (% change since 2000)
Marital status - Never married (%)
Marital status - Now married (%)
Marital status - Separated (%)
Marital status - Widowed (%)
Marital status - Divorced (%)
Median family income ($)
Median family income (% change since 2000)
Median non-family income ($)
Median non-family income (% change since 2000)
Median per capita income ($)
Median per capita income (% change since 2000)
Median family income ($) - White
Median family income ($) - Black or African American
Median family income ($) - Asian
Median family income ($) - Hispanic or Latino
Median family income ($) - American Indian and Alaska Native
Median family income ($) - Multirace
Median family income ($) - Other Race
Median year house/condo built
Median year apartment built
Year house built - Built 2005 or later (%)
Year house built - Built 2000 to 2004 (%)
Year house built - Built 1990 to 1999 (%)
Year house built - Built 1980 to 1989 (%)
Year house built - Built 1970 to 1979 (%)
Year house built - Built 1960 to 1969 (%)
Year house built - Built 1950 to 1959 (%)
Year house built - Built 1940 to 1949 (%)
Year house built - Built 1939 or earlier (%)
Average household size
Household density (households per square mile)
Average household size - White
Average household size - Black or African American
Average household size - Asian
Average household size - Hispanic or Latino
Average household size - American Indian and Alaska Native
Average household size - Multirace
Average household size - Other Race
Occupied housing units (%)
Vacant housing units (%)
Owner occupied housing units (%)
Renter occupied housing units (%)
Vacancy status - For rent (%)
Vacancy status - For sale only (%)
Vacancy status - Rented or sold, not occupied (%)
Vacancy status - For seasonal, recreational, or occasional use (%)
Vacancy status - For migrant workers (%)
Vacancy status - Other vacant (%)
Residents with income below the poverty level (%)
Residents with income below 50% of the poverty level (%)
Children below poverty level (%)
Poor families by family type - Married-couple family (%)
Poor families by family type - Male, no wife present (%)
Poor families by family type - Female, no husband present (%)
Poverty status for native-born residents (%)
Poverty status for foreign-born residents (%)
Poverty among high school graduates not in families (%)
Poverty among people who did not graduate high school not in families (%)
Residents with income below the poverty level (%) - White
Residents with income below the poverty level (%) - Black or African American
Residents with income below the poverty level (%) - Asian
Residents with income below the poverty level (%) - Hispanic or Latino
Residents with income below the poverty level (%) - American Indian and Alaska Native
Residents with income below the poverty level (%) - Multirace
Residents with income below the poverty level (%) - Other Race
Air pollution - Air Quality Index (AQI)
Air pollution - CO
Air pollution - NO2
Air pollution - SO2
Air pollution - Ozone
Air pollution - PM10
Air pollution - PM25
Air pollution - Pb
Crime - Murders per 100,000 population
Crime - Rapes per 100,000 population
Crime - Robberies per 100,000 population
Crime - Assaults per 100,000 population
Crime - Burglaries per 100,000 population
Crime - Thefts per 100,000 population
Crime - Auto thefts per 100,000 population
Crime - Arson per 100,000 population
Crime - City-data.com crime index
Crime - Violent crime index
Crime - Property crime index
Crime - Murders per 100,000 population (5 year average)
Crime - Rapes per 100,000 population (5 year average)
Crime - Robberies per 100,000 population (5 year average)
Crime - Assaults per 100,000 population (5 year average)
Crime - Burglaries per 100,000 population (5 year average)
Crime - Thefts per 100,000 population (5 year average)
Crime - Auto thefts per 100,000 population (5 year average)
Crime - Arson per 100,000 population (5 year average)
Crime - City-data.com crime index (5 year average)
Crime - Violent crime index (5 year average)
Crime - Property crime index (5 year average)
1996 Presidential Elections Results (%) - Democratic Party (Clinton)
1996 Presidential Elections Results (%) - Republican Party (Dole)
1996 Presidential Elections Results (%) - Other
2000 Presidential Elections Results (%) - Democratic Party (Gore)
2000 Presidential Elections Results (%) - Republican Party (Bush)
2000 Presidential Elections Results (%) - Other
2004 Presidential Elections Results (%) - Democratic Party (Kerry)
2004 Presidential Elections Results (%) - Republican Party (Bush)
2004 Presidential Elections Results (%) - Other
2008 Presidential Elections Results (%) - Democratic Party (Obama)
2008 Presidential Elections Results (%) - Republican Party (McCain)
2008 Presidential Elections Results (%) - Other
2012 Presidential Elections Results (%) - Democratic Party (Obama)
2012 Presidential Elections Results (%) - Republican Party (Romney)
2012 Presidential Elections Results (%) - Other
2016 Presidential Elections Results (%) - Democratic Party (Clinton)
2016 Presidential Elections Results (%) - Republican Party (Trump)
2016 Presidential Elections Results (%) - Other
2020 Presidential Elections Results (%) - Democratic Party (Biden)
2020 Presidential Elections Results (%) - Republican Party (Trump)
2020 Presidential Elections Results (%) - Other
Ancestries Reported - Arab (%)
Ancestries Reported - Czech (%)
Ancestries Reported - Danish (%)
Ancestries Reported - Dutch (%)
Ancestries Reported - English (%)
Ancestries Reported - French (%)
Ancestries Reported - French Canadian (%)
Ancestries Reported - German (%)
Ancestries Reported - Greek (%)
Ancestries Reported - Hungarian (%)
Ancestries Reported - Irish (%)
Ancestries Reported - Italian (%)
Ancestries Reported - Lithuanian (%)
Ancestries Reported - Norwegian (%)
Ancestries Reported - Polish (%)
Ancestries Reported - Portuguese (%)
Ancestries Reported - Russian (%)
Ancestries Reported - Scotch-Irish (%)
Ancestries Reported - Scottish (%)
Ancestries Reported - Slovak (%)
Ancestries Reported - Subsaharan African (%)
Ancestries Reported - Swedish (%)
Ancestries Reported - Swiss (%)
Ancestries Reported - Ukrainian (%)
Ancestries Reported - United States (%)
Ancestries Reported - Welsh (%)
Ancestries Reported - West Indian (%)
Ancestries Reported - Other (%)
Educational Attainment - No schooling completed (%)
Educational Attainment - Less than high school (%)
Educational Attainment - High school or equivalent (%)
Educational Attainment - Less than 1 year of college (%)
Educational Attainment - 1 or more years of college (%)
Educational Attainment - Associate degree (%)
Educational Attainment - Bachelor's degree (%)
Educational Attainment - Master's degree (%)
Educational Attainment - Professional school degree (%)
Educational Attainment - Doctorate degree (%)
School Enrollment - Nursery, preschool (%)
School Enrollment - Kindergarten (%)
School Enrollment - Grade 1 to 4 (%)
School Enrollment - Grade 5 to 8 (%)
School Enrollment - Grade 9 to 12 (%)
School Enrollment - College undergrad (%)
School Enrollment - Graduate or professional (%)
School Enrollment - Not enrolled in school (%)
School enrollment - Public schools (%)
School enrollment - Private schools (%)
School enrollment - Not enrolled (%)
Median number of rooms in houses and condos
Median number of rooms in apartments
Housing units lacking complete plumbing facilities (%)
Housing units lacking complete kitchen facilities (%)
Density of houses
Urban houses (%)
Rural houses (%)
Households with people 60 years and over (%)
Households with people 65 years and over (%)
Households with people 75 years and over (%)
Households with one or more nonrelatives (%)
Households with no nonrelatives (%)
Population in households (%)
Family households (%)
Nonfamily households (%)
Population in families (%)
Family households with own children (%)
Median number of bedrooms in owner occupied houses
Mean number of bedrooms in owner occupied houses
Median number of bedrooms in renter occupied houses
Mean number of bedrooms in renter occupied houses
Median number of vehichles in owner occupied houses
Mean number of vehichles in owner occupied houses
Median number of vehichles in renter occupied houses
Mean number of vehichles in renter occupied houses
Mortgage status - with mortgage (%)
Mortgage status - with second mortgage (%)
Mortgage status - with home equity loan (%)
Mortgage status - with both second mortgage and home equity loan (%)
Mortgage status - without a mortgage (%)
Average family size
Average family size - White
Average family size - Black or African American
Average family size - Asian
Average family size - Hispanic or Latino
Average family size - American Indian and Alaska Native
Average family size - Multirace
Average family size - Other Race
Geographical mobility - Same house 1 year ago (%)
Geographical mobility - Moved within same county (%)
Geographical mobility - Moved from different county within same state (%)
Geographical mobility - Moved from different state (%)
Geographical mobility - Moved from abroad (%)
Place of birth - Born in state of residence (%)
Place of birth - Born in other state (%)
Place of birth - Native, outside of US (%)
Place of birth - Foreign born (%)
Housing units in structures - 1, detached (%)
Housing units in structures - 1, attached (%)
Housing units in structures - 2 (%)
Housing units in structures - 3 or 4 (%)
Housing units in structures - 5 to 9 (%)
Housing units in structures - 10 to 19 (%)
Housing units in structures - 20 to 49 (%)
Housing units in structures - 50 or more (%)
Housing units in structures - Mobile home (%)
Housing units in structures - Boat, RV, van, etc. (%)
House/condo owner moved in on average (years ago)
Renter moved in on average (years ago)
Year householder moved into unit - Moved in 1999 to March 2000 (%)
Year householder moved into unit - Moved in 1995 to 1998 (%)
Year householder moved into unit - Moved in 1990 to 1994 (%)
Year householder moved into unit - Moved in 1980 to 1989 (%)
Year householder moved into unit - Moved in 1970 to 1979 (%)
Year householder moved into unit - Moved in 1969 or earlier (%)
Means of transportation to work - Drove car alone (%)
Means of transportation to work - Carpooled (%)
Means of transportation to work - Public transportation (%)
Means of transportation to work - Bus or trolley bus (%)
Means of transportation to work - Streetcar or trolley car (%)
Means of transportation to work - Subway or elevated (%)
Means of transportation to work - Railroad (%)
Means of transportation to work - Ferryboat (%)
Means of transportation to work - Taxicab (%)
Means of transportation to work - Motorcycle (%)
Means of transportation to work - Bicycle (%)
Means of transportation to work - Walked (%)
Means of transportation to work - Other means (%)
Working at home (%)
Industry diversity
Most Common Industries - Agriculture, forestry, fishing and hunting, and mining (%)
Most Common Industries - Agriculture, forestry, fishing and hunting (%)
Most Common Industries - Mining, quarrying, and oil and gas extraction (%)
Most Common Industries - Construction (%)
Most Common Industries - Manufacturing (%)
Most Common Industries - Wholesale trade (%)
Most Common Industries - Retail trade (%)
Most Common Industries - Transportation and warehousing, and utilities (%)
Most Common Industries - Transportation and warehousing (%)
Most Common Industries - Utilities (%)
Most Common Industries - Information (%)
Most Common Industries - Finance and insurance, and real estate and rental and leasing (%)
Most Common Industries - Finance and insurance (%)
Most Common Industries - Real estate and rental and leasing (%)
Most Common Industries - Professional, scientific, and management, and administrative and waste management services (%)
Most Common Industries - Professional, scientific, and technical services (%)
Most Common Industries - Management of companies and enterprises (%)
Most Common Industries - Administrative and support and waste management services (%)
Most Common Industries - Educational services, and health care and social assistance (%)
Most Common Industries - Educational services (%)
Most Common Industries - Health care and social assistance (%)
Most Common Industries - Arts, entertainment, and recreation, and accommodation and food services (%)
Most Common Industries - Arts, entertainment, and recreation (%)
Most Common Industries - Accommodation and food services (%)
Most Common Industries - Other services, except public administration (%)
Most Common Industries - Public administration (%)
Occupation diversity
Most Common Occupations - Management, business, science, and arts occupations (%)
Most Common Occupations - Management, business, and financial occupations (%)
Most Common Occupations - Management occupations (%)
Most Common Occupations - Business and financial operations occupations (%)
Most Common Occupations - Computer, engineering, and science occupations (%)
Most Common Occupations - Computer and mathematical occupations (%)
Most Common Occupations - Architecture and engineering occupations (%)
Most Common Occupations - Life, physical, and social science occupations (%)
Most Common Occupations - Education, legal, community service, arts, and media occupations (%)
Most Common Occupations - Community and social service occupations (%)
Most Common Occupations - Legal occupations (%)
Most Common Occupations - Education, training, and library occupations (%)
Most Common Occupations - Arts, design, entertainment, sports, and media occupations (%)
Most Common Occupations - Healthcare practitioners and technical occupations (%)
Most Common Occupations - Health diagnosing and treating practitioners and other technical occupations (%)
Most Common Occupations - Health technologists and technicians (%)
Most Common Occupations - Service occupations (%)
Most Common Occupations - Healthcare support occupations (%)
Most Common Occupations - Protective service occupations (%)
Most Common Occupations - Fire fighting and prevention, and other protective service workers including supervisors (%)
Most Common Occupations - Law enforcement workers including supervisors (%)
Most Common Occupations - Food preparation and serving related occupations (%)
Most Common Occupations - Building and grounds cleaning and maintenance occupations (%)
Most Common Occupations - Personal care and service occupations (%)
Most Common Occupations - Sales and office occupations (%)
Most Common Occupations - Sales and related occupations (%)
Most Common Occupations - Office and administrative support occupations (%)
Most Common Occupations - Natural resources, construction, and maintenance occupations (%)
Most Common Occupations - Farming, fishing, and forestry occupations (%)
Most Common Occupations - Construction and extraction occupations (%)
Most Common Occupations - Installation, maintenance, and repair occupations (%)
Most Common Occupations - Production, transportation, and material moving occupations (%)
Most Common Occupations - Production occupations (%)
Most Common Occupations - Transportation occupations (%)
Most Common Occupations - Material moving occupations (%)
People in Group quarters - Institutionalized population (%)
People in Group quarters - Correctional institutions (%)
People in Group quarters - Federal prisons and detention centers (%)
People in Group quarters - Halfway houses (%)
People in Group quarters - Local jails and other confinement facilities (including police lockups) (%)
People in Group quarters - Military disciplinary barracks (%)
People in Group quarters - State prisons (%)
People in Group quarters - Other types of correctional institutions (%)
People in Group quarters - Nursing homes (%)
People in Group quarters - Hospitals/wards, hospices, and schools for the handicapped (%)
People in Group quarters - Hospitals/wards and hospices for chronically ill (%)
People in Group quarters - Hospices or homes for chronically ill (%)
People in Group quarters - Military hospitals or wards for chronically ill (%)
People in Group quarters - Other hospitals or wards for chronically ill (%)
People in Group quarters - Hospitals or wards for drug/alcohol abuse (%)
People in Group quarters - Mental (Psychiatric) hospitals or wards (%)
People in Group quarters - Schools, hospitals, or wards for the mentally retarded (%)
People in Group quarters - Schools, hospitals, or wards for the physically handicapped (%)
People in Group quarters - Institutions for the deaf (%)
People in Group quarters - Institutions for the blind (%)
People in Group quarters - Orthopedic wards and institutions for the physically handicapped (%)
People in Group quarters - Wards in general hospitals for patients who have no usual home elsewhere (%)
People in Group quarters - Wards in military hospitals for patients who have no usual home elsewhere (%)
People in Group quarters - Juvenile institutions (%)
People in Group quarters - Long-term care (%)
People in Group quarters - Homes for abused, dependent, and neglected children (%)
People in Group quarters - Residential treatment centers for emotionally disturbed children (%)
People in Group quarters - Training schools for juvenile delinquents (%)
People in Group quarters - Short-term care, detention or diagnostic centers for delinquent children (%)
People in Group quarters - Type of juvenile institution unknown (%)
People in Group quarters - Noninstitutionalized population (%)
People in Group quarters - College dormitories (includes college quarters off campus) (%)
People in Group quarters - Military quarters (%)
People in Group quarters - On base (%)
People in Group quarters - Barracks, unaccompanied personnel housing (UPH), (Enlisted/Officer), ;and similar group living quarters for military personnel (%)
People in Group quarters - Transient quarters for temporary residents (%)
People in Group quarters - Military ships (%)
People in Group quarters - Group homes (%)
People in Group quarters - Homes or halfway houses for drug/alcohol abuse (%)
People in Group quarters - Homes for the mentally ill (%)
People in Group quarters - Homes for the mentally retarded (%)
People in Group quarters - Homes for the physically handicapped (%)
People in Group quarters - Other group homes (%)
People in Group quarters - Religious group quarters (%)
People in Group quarters - Dormitories (%)
People in Group quarters - Agriculture workers' dormitories on farms (%)
People in Group quarters - Job Corps and vocational training facilities (%)
People in Group quarters - Other workers' dormitories (%)
People in Group quarters - Crews of maritime vessels (%)
People in Group quarters - Other nonhousehold living situations (%)
People in Group quarters - Other noninstitutional group quarters (%)
Residents speaking English at home (%)
Residents speaking English at home - Born in the United States (%)
Residents speaking English at home - Native, born elsewhere (%)
Residents speaking English at home - Foreign born (%)
Residents speaking Spanish at home (%)
Residents speaking Spanish at home - Born in the United States (%)
Residents speaking Spanish at home - Native, born elsewhere (%)
Residents speaking Spanish at home - Foreign born (%)
Residents speaking other language at home (%)
Residents speaking other language at home - Born in the United States (%)
Residents speaking other language at home - Native, born elsewhere (%)
Residents speaking other language at home - Foreign born (%)
Class of Workers - Employee of private company (%)
Class of Workers - Self-employed in own incorporated business (%)
Class of Workers - Private not-for-profit wage and salary workers (%)
Class of Workers - Local government workers (%)
Class of Workers - State government workers (%)
Class of Workers - Federal government workers (%)
Class of Workers - Self-employed workers in own not incorporated business and Unpaid family workers (%)
House heating fuel used in houses and condos - Utility gas (%)
House heating fuel used in houses and condos - Bottled, tank, or LP gas (%)
House heating fuel used in houses and condos - Electricity (%)
House heating fuel used in houses and condos - Fuel oil, kerosene, etc. (%)
House heating fuel used in houses and condos - Coal or coke (%)
House heating fuel used in houses and condos - Wood (%)
House heating fuel used in houses and condos - Solar energy (%)
House heating fuel used in houses and condos - Other fuel (%)
House heating fuel used in houses and condos - No fuel used (%)
House heating fuel used in apartments - Utility gas (%)
House heating fuel used in apartments - Bottled, tank, or LP gas (%)
House heating fuel used in apartments - Electricity (%)
House heating fuel used in apartments - Fuel oil, kerosene, etc. (%)
House heating fuel used in apartments - Coal or coke (%)
House heating fuel used in apartments - Wood (%)
House heating fuel used in apartments - Solar energy (%)
House heating fuel used in apartments - Other fuel (%)
House heating fuel used in apartments - No fuel used (%)
Armed forces status - In Armed Forces (%)
Armed forces status - Civilian (%)
Armed forces status - Civilian - Veteran (%)
Armed forces status - Civilian - Nonveteran (%)
Fatal accidents locations in years 2005-2021
Fatal accidents locations in 2005
Fatal accidents locations in 2006
Fatal accidents locations in 2007
Fatal accidents locations in 2008
Fatal accidents locations in 2009
Fatal accidents locations in 2010
Fatal accidents locations in 2011
Fatal accidents locations in 2012
Fatal accidents locations in 2013
Fatal accidents locations in 2014
Fatal accidents locations in 2015
Fatal accidents locations in 2016
Fatal accidents locations in 2017
Fatal accidents locations in 2018
Fatal accidents locations in 2019
Fatal accidents locations in 2020
Fatal accidents locations in 2021
Alcohol use - People drinking some alcohol every month (%)
Alcohol use - People not drinking at all (%)
Alcohol use - Average days/month drinking alcohol
Alcohol use - Average drinks/week
Alcohol use - Average days/year people drink much
Audiometry - Average condition of hearing (%)
Audiometry - People that can hear a whisper from across a quiet room (%)
Audiometry - People that can hear normal voice from across a quiet room (%)
Audiometry - Ears ringing, roaring, buzzing (%)
Audiometry - Had a job exposure to loud noise (%)
Audiometry - Had off-work exposure to loud noise (%)
Blood Pressure & Cholesterol - Has high blood pressure (%)
Blood Pressure & Cholesterol - Checking blood pressure at home (%)
Blood Pressure & Cholesterol - Frequently checking blood cholesterol (%)
Blood Pressure & Cholesterol - Has high cholesterol level (%)
Consumer Behavior - Money monthly spent on food at supermarket/grocery store
Consumer Behavior - Money monthly spent on food at other stores
Consumer Behavior - Money monthly spent on eating out
Consumer Behavior - Money monthly spent on carryout/delivered foods
Consumer Behavior - Income spent on food at supermarket/grocery store (%)
Consumer Behavior - Income spent on food at other stores (%)
Consumer Behavior - Income spent on eating out (%)
Consumer Behavior - Income spent on carryout/delivered foods (%)
Current Health Status - General health condition (%)
Current Health Status - Blood donors (%)
Current Health Status - Has blood ever tested for HIV virus (%)
Current Health Status - Left-handed people (%)
Dermatology - People using sunscreen (%)
Diabetes - Diabetics (%)
Diabetes - Had a blood test for high blood sugar (%)
Diabetes - People taking insulin (%)
Diet Behavior & Nutrition - Diet health (%)
Diet Behavior & Nutrition - Milk product consumption (# of products/month)
Diet Behavior & Nutrition - Meals not home prepared (#/week)
Diet Behavior & Nutrition - Meals from fast food or pizza place (#/week)
Diet Behavior & Nutrition - Ready-to-eat foods (#/month)
Diet Behavior & Nutrition - Frozen meals/pizza (#/month)
Drug Use - People that ever used marijuana or hashish (%)
Drug Use - Ever used hard drugs (%)
Drug Use - Ever used any form of cocaine (%)
Drug Use - Ever used heroin (%)
Drug Use - Ever used methamphetamine (%)
Health Insurance - People covered by health insurance (%)
Kidney Conditions-Urology - Avg. # of times urinating at night
Medical Conditions - People with asthma (%)
Medical Conditions - People with anemia (%)
Medical Conditions - People with psoriasis (%)
Medical Conditions - People with overweight (%)
Medical Conditions - Elderly people having difficulties in thinking or remembering (%)
Medical Conditions - People who ever received blood transfusion (%)
Medical Conditions - People having trouble seeing even with glass/contacts (%)
Medical Conditions - People with arthritis (%)
Medical Conditions - People with gout (%)
Medical Conditions - People with congestive heart failure (%)
Medical Conditions - People with coronary heart disease (%)
Medical Conditions - People with angina pectoris (%)
Medical Conditions - People who ever had heart attack (%)
Medical Conditions - People who ever had stroke (%)
Medical Conditions - People with emphysema (%)
Medical Conditions - People with thyroid problem (%)
Medical Conditions - People with chronic bronchitis (%)
Medical Conditions - People with any liver condition (%)
Medical Conditions - People who ever had cancer or malignancy (%)
Mental Health - People who have little interest in doing things (%)
Mental Health - People feeling down, depressed, or hopeless (%)
Mental Health - People who have trouble sleeping or sleeping too much (%)
Mental Health - People feeling tired or having little energy (%)
Mental Health - People with poor appetite or overeating (%)
Mental Health - People feeling bad about themself (%)
Mental Health - People who have trouble concentrating on things (%)
Mental Health - People moving or speaking slowly or too fast (%)
Mental Health - People having thoughts they would be better off dead (%)
Oral Health - Average years since last visit a dentist
Oral Health - People embarrassed because of mouth (%)
Oral Health - People with gum disease (%)
Oral Health - General health of teeth and gums (%)
Oral Health - Average days a week using dental floss/device
Oral Health - Average days a week using mouthwash for dental problem
Oral Health - Average number of teeth
Pesticide Use - Households using pesticides to control insects (%)
Pesticide Use - Households using pesticides to kill weeds (%)
Physical Activity - People doing vigorous-intensity work activities (%)
Physical Activity - People doing moderate-intensity work activities (%)
Physical Activity - People walking or bicycling (%)
Physical Activity - People doing vigorous-intensity recreational activities (%)
Physical Activity - People doing moderate-intensity recreational activities (%)
Physical Activity - Average hours a day doing sedentary activities
Physical Activity - Average hours a day watching TV or videos
Physical Activity - Average hours a day using computer
Physical Functioning - People having limitations keeping them from working (%)
Physical Functioning - People limited in amount of work they can do (%)
Physical Functioning - People that need special equipment to walk (%)
Physical Functioning - People experiencing confusion/memory problems (%)
Physical Functioning - People requiring special healthcare equipment (%)
Prescription Medications - Average number of prescription medicines taking
Preventive Aspirin Use - Adults 40+ taking low-dose aspirin (%)
Reproductive Health - Vaginal deliveries (%)
Reproductive Health - Cesarean deliveries (%)
Reproductive Health - Deliveries resulted in a live birth (%)
Reproductive Health - Pregnancies resulted in a delivery (%)
Reproductive Health - Women breastfeeding newborns (%)
Reproductive Health - Women that had a hysterectomy (%)
Reproductive Health - Women that had both ovaries removed (%)
Reproductive Health - Women that have ever taken birth control pills (%)
Reproductive Health - Women taking birth control pills (%)
Reproductive Health - Women that have ever used Depo-Provera or injectables (%)
Reproductive Health - Women that have ever used female hormones (%)
Sexual Behavior - People 18+ that ever had sex (vaginal, anal, or oral) (%)
Sexual Behavior - Males 18+ that ever had vaginal sex with a woman (%)
Sexual Behavior - Males 18+ that ever performed oral sex on a woman (%)
Sexual Behavior - Males 18+ that ever had anal sex with a woman (%)
Sexual Behavior - Males 18+ that ever had any sex with a man (%)
Sexual Behavior - Females 18+ that ever had vaginal sex with a man (%)
Sexual Behavior - Females 18+ that ever performed oral sex on a man (%)
Sexual Behavior - Females 18+ that ever had anal sex with a man (%)
Sexual Behavior - Females 18+ that ever had any kind of sex with a woman (%)
Sexual Behavior - Average age people first had sex
Sexual Behavior - Average number of female sex partners in lifetime (males 18+)
Sexual Behavior - Average number of female vaginal sex partners in lifetime (males 18+)
Sexual Behavior - Average age people first performed oral sex on a woman (18+)
Sexual Behavior - Average number of woman performed oral sex on in lifetime (18+)
Sexual Behavior - Average number of male sex partners in lifetime (males 18+)
Sexual Behavior - Average number of male anal sex partners in lifetime (males 18+)
Sexual Behavior - Average age people first performed oral sex on a man (18+)
Sexual Behavior - Average number of male oral sex partners in lifetime (18+)
Sexual Behavior - People using protection when performing oral sex (%)
Sexual Behavior - Average number of times people have vaginal or anal sex a year
Sexual Behavior - People having sex without condom (%)
Sexual Behavior - Average number of male sex partners in lifetime (females 18+)
Sexual Behavior - Average number of male vaginal sex partners in lifetime (females 18+)
Sexual Behavior - Average number of female sex partners in lifetime (females 18+)
Sexual Behavior - Circumcised males 18+ (%)
Sleep Disorders - Average hours sleeping at night
Sleep Disorders - People that has trouble sleeping (%)
Smoking-Cigarette Use - People smoking cigarettes (%)
Taste & Smell - People 40+ having problems with smell (%)
Taste & Smell - People 40+ having problems with taste (%)
Taste & Smell - People 40+ that ever had wisdom teeth removed (%)
Taste & Smell - People 40+ that ever had tonsils teeth removed (%)
Taste & Smell - People 40+ that ever had a loss of consciousness because of a head injury (%)
Taste & Smell - People 40+ that ever had a broken nose or other serious injury to face or skull (%)
Taste & Smell - People 40+ that ever had two or more sinus infections (%)
Weight - Average height (inches)
Weight - Average weight (pounds)
Weight - Average BMI
Weight - People that are obese (%)
Weight - People that ever were obese (%)
Weight - People trying to lose weight (%)
Urban population: 27,464
Rural population: 3,641
Estimated median house/condo value in 2022: $231,401
29316:
$231,401South Carolina:
$254,600
According to our research of South Carolina and other state lists, there were 4 registered sex offenders living in 29316 zip code as of May 28, 2024 . The ratio of all residents to sex offenders in zip code 29316 is 6,198 to 1.The ratio of registered sex offenders to all residents in this zip code is much lower than the state average.
Median resident age: This zip code:
35.3 yearsSouth Carolina median age:
40.5 years
Average household size: This zip code:
2.5 peopleSouth Carolina:
2.4 people
Averages for the 2020 tax year for zip code 29316, filed in 2021:
Average Adjusted Gross Income (AGI) in 2020: $57,306 (Individual Income Tax Returns) Here:
$57,306State:
$65,754
Salary/wage: $50,940 (reported on 85.4% of returns )Here:
$50,940State:
$52,566
(% of AGI for various income ranges: 1182.0% for AGIs below $25k , 3868.5% for AGIs $25k-50k , 7127.2% for AGIs $50k-75k , 10331.4% for AGIs $75k-100k , 18403.2% for AGIs $100k-200k , 59731.0% for AGIs over 200k ) Taxable interest for individuals: $1,091 (reported on 18.5% of returns )This zip code:
$1,091South Carolina:
$1,749
(% of AGI for various income ranges: 10.6% for AGIs below $25k , 11.9% for AGIs $25k-50k , 19.5% for AGIs $50k-75k , 54.5% for AGIs $75k-100k , 65.5% for AGIs $100k-200k , 668.0% for AGIs over 200k ) Ordinary dividends: $5,453 (reported on 11.9% of returns )(% of AGI for various income ranges: 16.8% for AGIs below $25k , 17.0% for AGIs $25k-50k , 33.8% for AGIs $50k-75k , 68.1% for AGIs $75k-100k , 206.3% for AGIs $100k-200k , 5125.0% for AGIs over 200k ) Net capital gain/loss in AGI: +$8,239 (reported on 11.1% of returns )Here:
+$8,239State:
+$24,194
(% of AGI for various income ranges: 6.2% for AGIs below $25k , 17.2% for AGIs $25k-50k , 49.7% for AGIs $50k-75k , 139.4% for AGIs $75k-100k , 364.4% for AGIs $100k-200k , 6778.0% for AGIs over 200k ) Profit/loss from business: +$10,073 (reported on 17.1% of returns )Here:
+$10,073State:
+$11,253
(% of AGI for various income ranges: 121.0% for AGIs below $25k , 221.5% for AGIs $25k-50k , 265.9% for AGIs $50k-75k , 165.2% for AGIs $75k-100k , 524.1% for AGIs $100k-200k , 2561.0% for AGIs over 200k ) Taxable individual retirement arrangement distribution: $16,615 (reported on 7.6% of returns )29316:
$16,615South Carolina:
$21,604
(% of AGI for various income ranges: 47.4% for AGIs below $25k , 75.0% for AGIs $25k-50k , 158.8% for AGIs $50k-75k , 287.8% for AGIs $75k-100k , 655.9% for AGIs $100k-200k , 2264.0% for AGIs over 200k ) Total itemized deductions: $29,108 (reported on 5.7% of returns )Here:
$29,108State:
$35,199
(% of AGI for various income ranges: 30.7% for AGIs below $25k , 75.4% for AGIs $25k-50k , 203.2% for AGIs $50k-75k , 345.0% for AGIs $75k-100k , 803.6% for AGIs $100k-200k , 5892.0% for AGIs over 200k ) Charity contributions: $11,935 (reported on 4.8% of returns )Here:
$11,935State:
$14,319
(% of AGI for various income ranges: 2.7% for AGIs below $25k , 15.1% for AGIs $25k-50k , 46.6% for AGIs $50k-75k , 83.2% for AGIs $75k-100k , 290.3% for AGIs $100k-200k , 3243.0% for AGIs over 200k ) Taxes paid: $6,862 (reported on 5.7% of returns )(% of AGI for various income ranges: 3.3% for AGIs below $25k , 11.9% for AGIs $25k-50k , 49.8% for AGIs $50k-75k , 92.4% for AGIs $75k-100k , 234.1% for AGIs $100k-200k , 1034.0% for AGIs over 200k ) Earned income credit: $2,363 (reported on 18.0% of returns )(% of AGI for various income ranges: 100.3% for AGIs below $25k , 90.2% for AGIs $25k-50k , 2.3% for AGIs $50k-75k ) Percentage of individuals using paid preparers for their 2020 taxes: 94.1%(% for various income ranges: 93.0% for AGIs below $25k , 93.9% for AGIs $25k-50k , 94.1% for AGIs $50k-75k , 95.5% for AGIs $75k-100k , 95.5% for AGIs $100k-200k , 96.7% for AGIs over 200k )
Averages for the 2012 tax year for zip code 29316, filed in 2013:
Average Adjusted Gross Income (AGI) in 2012: $47,515 (Individual Income Tax Returns) Here:
$47,515State:
$51,133
Salary/wage: $43,767 (reported on 88.1% of returns )Here:
$43,767State:
$42,173
(% of AGI for various income ranges: 76.8% for AGIs below $25k , 84.0% for AGIs $25k-50k , 82.2% for AGIs $50k-75k , 84.5% for AGIs $75k-100k , 81.8% for AGIs $100k-200k , 63.7% for AGIs over 200k ) Taxable interest for individuals: $892 (reported on 23.9% of returns )This zip code:
$892South Carolina:
$1,468
(% of AGI for various income ranges: 0.8% for AGIs below $25k , 0.4% for AGIs $25k-50k , 0.3% for AGIs $50k-75k , 0.3% for AGIs $75k-100k , 0.5% for AGIs $100k-200k , 0.6% for AGIs over 200k ) Ordinary dividends: $2,492 (reported on 12.9% of returns )(% of AGI for various income ranges: 0.7% for AGIs below $25k , 0.5% for AGIs $25k-50k , 0.5% for AGIs $50k-75k , 0.5% for AGIs $75k-100k , 0.7% for AGIs $100k-200k , 2.1% for AGIs over 200k ) Net capital gain/loss in AGI: +$2,990 (reported on 8.9% of returns )Here:
+$2,990State:
+$13,061
(% of AGI for various income ranges: 0.2% for AGIs $50k-75k , 0.4% for AGIs $75k-100k , 0.9% for AGIs $100k-200k , 3.5% for AGIs over 200k ) Profit/loss from business: +$10,093 (reported on 14.4% of returns )Here:
+$10,093State:
+$10,167
(% of AGI for various income ranges: 7.9% for AGIs below $25k , 2.9% for AGIs $25k-50k , 2.2% for AGIs $50k-75k , 2.1% for AGIs $75k-100k , 2.6% for AGIs $100k-200k , 3.7% for AGIs over 200k ) Taxable individual retirement arrangement distribution: $11,932 (reported on 8.2% of returns )29316:
$11,932South Carolina:
$17,019
(% of AGI for various income ranges: 3.0% for AGIs below $25k , 1.9% for AGIs $25k-50k , 2.1% for AGIs $50k-75k , 2.1% for AGIs $75k-100k , 2.3% for AGIs $100k-200k ) Self-employment retirement plans: $15,150 (reported on 0.2% of returns )29316:
$15,150South Carolina:
$21,023
Total itemized deductions: $18,387 (23% of AGI, reported on 34.3% of returns )Here:
$18,387State:
$22,890
Here:
22.6% of AGIState:
21.4% of AGI
(% of AGI for various income ranges: 7.5% for AGIs below $25k , 11.2% for AGIs $25k-50k , 13.1% for AGIs $50k-75k , 14.6% for AGIs $75k-100k , 16.2% for AGIs $100k-200k , 14.0% for AGIs over 200k ) Charity contributions: $4,490 (reported on 29.3% of returns )(% of AGI for various income ranges: 1.0% for AGIs below $25k , 2.0% for AGIs $25k-50k , 2.5% for AGIs $50k-75k , 3.0% for AGIs $75k-100k , 3.9% for AGIs $100k-200k , 3.8% for AGIs over 200k ) Taxes paid: $5,855 (reported on 34.3% of returns )(% of AGI for various income ranges: 1.1% for AGIs below $25k , 2.3% for AGIs $25k-50k , 3.7% for AGIs $50k-75k , 4.9% for AGIs $75k-100k , 6.4% for AGIs $100k-200k , 6.6% for AGIs over 200k ) Earned income credit: $2,316 (reported on 20.7% of returns )(% of AGI for various income ranges: 7.3% for AGIs below $25k , 1.4% for AGIs $25k-50k ) Percentage of individuals using paid preparers for their 2012 taxes: 54.0%(% for various income ranges: 51.1% for AGIs below $25k , 55.0% for AGIs $25k-50k , 56.0% for AGIs $50k-75k , 53.4% for AGIs $75k-100k , 57.1% for AGIs $100k-200k , 80.0% for AGIs over 200k )
Averages for the 2004 tax year for zip code 29316, filed in 2005:
Average Adjusted Gross Income (AGI) in 2004: $41,969 (Individual Income Tax Returns) Here:
$41,969State:
$41,965
Salary/wage: $39,443 (reported on 90.6% of returns )Here:
$39,443State:
$35,695
(% of AGI for various income ranges: 125.7% for AGIs below $10k , 83.1% for AGIs $10k-25k , 86.6% for AGIs $25k-50k , 88.3% for AGIs $50k-75k , 87.1% for AGIs $75k-100k , 76.1% for AGIs over 100k ) Taxable interest for individuals: $906 (reported on 34.4% of returns )This zip code:
$906South Carolina:
$1,623
(% of AGI for various income ranges: 4.2% for AGIs below $10k , 1.1% for AGIs $10k-25k , 0.6% for AGIs $25k-50k , 0.4% for AGIs $50k-75k , 0.7% for AGIs $75k-100k , 0.9% for AGIs over 100k ) Taxable dividends: $1,193 (reported on 16.7% of returns )(% of AGI for various income ranges: 2.2% for AGIs below $10k , 0.6% for AGIs $10k-25k , 0.5% for AGIs $25k-50k , 0.3% for AGIs $50k-75k , 0.4% for AGIs $75k-100k , 0.6% for AGIs over 100k ) Net capital gain/loss: +$4,539 (reported on 12.1% of returns )Here:
+$4,539State:
+$13,100
(% of AGI for various income ranges: -0.8% for AGIs below $10k , 0.4% for AGIs $10k-25k , 0.4% for AGIs $25k-50k , 0.4% for AGIs $50k-75k , 0.7% for AGIs $75k-100k , 4.5% for AGIs over 100k ) Profit/loss from business: +$6,245 (reported on 15.3% of returns )Here:
+$6,245State:
+$9,144
(% of AGI for various income ranges: 2.9% for AGIs below $10k , 2.9% for AGIs $10k-25k , 2.3% for AGIs $25k-50k , 1.8% for AGIs $50k-75k , 2.5% for AGIs $75k-100k , 2.2% for AGIs over 100k ) IRA payment deduction: $3,240 (reported on 2.2% of returns )29316:
$3,240South Carolina:
$2,972
(% of AGI for various income ranges: 0.2% for AGIs $10k-25k , 0.2% for AGIs $25k-50k , 0.2% for AGIs $50k-75k , 0.1% for AGIs $75k-100k , 0.1% for AGIs over 100k ) Self-employed pension: $5,500 (reported on 0.2% of returns )Here:
$5,500South Carolina:
$15,117
Total itemized deductions: $16,569 (25% of AGI, reported on 42.5% of returns )Here:
$16,569State:
$19,039
Here:
24.7% of AGIState:
22.8% of AGI
(% of AGI for various income ranges: 14.4% for AGIs below $10k , 9.4% for AGIs $10k-25k , 15.3% for AGIs $25k-50k , 18.5% for AGIs $50k-75k , 18.8% for AGIs $75k-100k , 17.9% for AGIs over 100k ) Charity contributions deductions: $3,640 (5% of AGI, reported on 37.0% of returns )Here:
5.2% of AGIState:
5.0% of AGI
(% of AGI for various income ranges: 1.5% for AGIs below $10k , 1.4% for AGIs $10k-25k , 2.5% for AGIs $25k-50k , 3.2% for AGIs $50k-75k , 3.7% for AGIs $75k-100k , 4.4% for AGIs over 100k ) Total tax: $4,892 (reported on 74.7% of returns )(% of AGI for various income ranges: 3.2% for AGIs below $10k , 3.5% for AGIs $10k-25k , 6.0% for AGIs $25k-50k , 7.7% for AGIs $50k-75k , 9.5% for AGIs $75k-100k , 14.9% for AGIs over 100k ) Earned income credit: $1,690 (reported on 16.3% of returns )Percentage of individuals using paid preparers for their 2004 taxes: 61.7%(% for various income ranges: 51.7% for AGIs below $10k , 64.6% for AGIs $10k-25k , 66.0% for AGIs $25k-50k , 65.3% for AGIs $50k-75k , 56.4% for AGIs $75k-100k , 58.3% for AGIs over 100k )
Estimated median household income in 2022: This zip code:
$76,520South Carolina:
$64,115
Nearest zip codes: 29303 ,
29378 ,
29320 ,
29349 ,
29338 ,
29333 .
Valley Falls Zip Code Map
Percentage of family households: This zip code:
58.5%South Carolina:
44.7%
Percentage of households with unmarried partners: This zip code:
4.9%South Carolina:
47.7%
Likely homosexual households (counted as self-reported same-sex unmarried-partner households)
Lesbian couples: 0.2% of all households Gay men: 0.0% of all households
Household received Food Stamps/SNAP in the past 12 months: 615Household did not receive Food Stamps/SNAP in the past 12 months: 11,572
Women who had a birth in the past 12 months: 584 (480 now married , 120 unmarried) Women who did not have a birth in the past 12 months: 7,488 (4,293 now married , 3,237 unmarried)
Housing units in zip code 29316 with a mortgage: 6,879 (376
second mortgage , 317
both second mortgage and home equity loan )
Houses without a mortgage: 97
Median monthly owner costs for units with a mortgage: $1,243
Median monthly owner costs for units without a mortgage: $363
Residents with income below the poverty level in 2022:
This zip code:
9.2%Whole state:
14.0%
Residents with income below 50% of the poverty level in 2022:
This zip code:
5.7%Whole state:
7.3%
Median number of rooms in houses and condos: Median number of rooms in apartments: Notable locations in this zip code not listed on our city pages
Click to draw/clear zip code borders Notable location: (A) . Display/hide its location on the map
Churches in zip code 29316 include: (A) , Mountain View Baptist Church (B) , Community Bible Church (C) , Carlisle Wesleyan Methodist Church (D) , Boiling Springs First Baptist Church (E) , Holdens Chapel Baptist Church (F) , Valley Falls Baptist Church (G) , New Pisgah Church (H) . Display/hide their locations on the map
Cemetery: (1) . Display/hide its location on the map
Streams, rivers, and creeks: (A) , Fawn Branch (B) . Display/hide their locations on the map
Year house built (houses)
215 2020 or later3,593 2010 to 20193,245 2000 to 20091,869 1990 to 19991,418 1980 to 19891,090 1970 to 1979432 1960 to 1969332 1950 to 195922 1940 to 194973 1939 or earlier
Zip code 29316 household income distribution in 2022 491 Less than $10,000321 $10,000 to $14,999359 $15,000 to $19,999426 $20,000 to $24,999468 $25,000 to $29,999413 $30,000 to $34,999418 $35,000 to $39,999676 $40,000 to $44,999460 $45,000 to $49,999743 $50,000 to $59,9991,180 $60,000 to $74,9992,678 $75,000 to $99,9991,212 $100,000 to $124,999840 $125,000 to $149,999870 $150,000 to $199,999695 $200,000 or moreEstimate of home value of owner-occupied houses/condos in 2022 in zip code 29316 180 Less than $10,00027 $10,000 to $14,99937 $15,000 to $19,99971 $20,000 to $24,99935 $25,000 to $29,99961 $30,000 to $34,99949 $35,000 to $39,9992 $50,000 to $59,99937 $60,000 to $69,99957 $70,000 to $79,99948 $80,000 to $89,99989 $90,000 to $99,999302 $100,000 to $124,999594 $125,000 to $149,9991,045 $150,000 to $174,9991,655 $175,000 to $199,9991,527 $200,000 to $249,9991,579 $250,000 to $299,9991,157 $300,000 to $399,999462 $400,000 to $499,999159 $500,000 to $749,99959 $750,000 to $999,99922 $1,000,000 to $1,499,99923 $1,500,000 to $1,999,999147 $2,000,000 or moreRent paid by renters in 2022 in zip code 29316 7 $150 to $19998 $250 to $2996 $300 to $34954 $400 to $44913 $450 to $49939 $500 to $549103 $600 to $649249 $650 to $699178 $700 to $749116 $750 to $79980 $800 to $899285 $900 to $999374 $1,000 to $1,249167 $1,250 to $1,499239 $1,500 to $1,999148 No cash rent
Median gross rent in 2022: $1,014.
Median price asked for vacant for-sale houses and condos in 2022: $245,448.
Estimated median house (or condo) value in 2022 for: White Non-Hispanic householders: $236,177Black or African American householders: $257,669Asian householders: $253,848Some other race householders: $348,176Two or more races householders: $202,983Hispanic or Latino householders: $365,608Estimated median house or condo value in 2022: $231,401
29316:
$231,401South Carolina:
$254,600
Lower value quartile - upper value quartile: $191,715 - $302,617
Mean price in 2022: Detached houses: $221,313Here:
$221,313State:
$368,255
Townhouses or other attached units: $68,808Here:
$68,808State:
$292,023
Mobile homes: $77,443Here:
$77,443State:
$102,531
Housing units in structures:
One, detached: 9,844One, attached: 542Two: 2633 or 4: 1095 to 9: 19010 to 19: 25920 to 49: 49950 or more: 16Mobile homes: 565Unemployment : 3.0%
Means of transportation to work in zip code 29316 80.8% 12,669 Drove a car alone7.8% 1,219 Carpooled0.4% 62 Motorcycle0.4% 65 Walked0.8% 133 Other means9.2% 1,443 Worked at homeTravel time to work (commute) in zip code 29316 261 Less than 5 minutes889 5 to 9 minutes1,408 10 to 14 minutes3,166 15 to 19 minutes2,930 20 to 24 minutes1,220 25 to 29 minutes2,170 30 to 34 minutes265 35 to 39 minutes297 40 to 44 minutes751 45 to 59 minutes479 60 to 89 minutes304 90 or more minutes
Percentage of zip code residents living and working in this county: 82.4%
Household type by relationship:
Households: 31,106
Male householders: 5,531 (1,133 living alone ), Female householders: 6,689 (1,525 living alone )7,308 spouses (7,273 opposite-sex spouses ), 368 unmarried partners , (368 opposite-sex unmarried partners ), 9,605 children (8,642 natural , 464 adopted , 511 stepchildren ), 271 grandchildren , 290 brothers or sisters , 518 parents , 3 foster children , 460 other relatives , 105 non-relatives In group quarters: 83 (-1 institutionalized population )
Size of family households: 4,003 2-persons , 2,319 3-persons , 1,809 4-persons , 748 5-persons , 329 6-persons , 81 7-or-more-persons
Size of nonfamily households: 2,659 1-person , 229 2-persons , 6 6-persons
6,295 married couples with children. single-parent households (176 men , 982 women ).
87.9% of residents of 29316 zip code speak English at home. of residents speak Spanish at home (58% very well, 26% well, 15% not well ).of residents speak other Indo-European language at home (56% very well, 17% well, 17% not well, 9% not at all ).of residents speak Asian or Pacific Island language at home (70% very well, 21% well, 9% not well ).of residents speak other language at home (100% not well ).
Foreign born population: 2,385 (7.7%)
(68.6%
of them are naturalized citizens )
This zip code:
7.7%Whole state:
5.2%
19% Serbia 15% Honduras 9% Bhutan 8% Albania 6% Chile 5% Sweden 5% Lithuania 20% American 10% Irish 9% English 5% German 3% Ukrainian 2% Scottish 2% Scotch-Irish
Year of entry for the foreign-born population
723 2010 or later 605 2000 to 2009 547 1990 to 1999 787 Before 1990
There are
48 Medical Specialists in Zip Code 29316 .
Facilities with environmental interests located in this zip code:
COLOR CONVERTING INDUSTRIES (150 BELCHER RD. in BOILING SPRINGS, SC)
AIR SYNTHETIC MINOR (AIRS/AFS) SUPERFUND (Superfund database) CRITERIA AND HAZARDOUS AIR POLLUTANT INVENTORY (Inventory of air pollution sources) National Pollutant Discharge Elimination System NON-MAJOR (Tracking pollutant discharge elimination systems) - permit HAZARDOUS WASTE BIENNIAL REPORTER (Resource Conservation and Recovery Act (tracking hazardous waste)) Large Quantity Generators, more that 1000 kg of hazardous waste/month (Resource Conservation and Recovery Act (tracking hazardous waste)) STATE MASTER (South Carolina database) - AIR MAJOR, AIR PROGRAM, TRI REPORTER, HAZARDOUS WASTE PROGRAM TRI REPORTER (Tracking of toxic chemicals releasing facilities) Business SIC classification: PRINTING INKOrganizations: VIROGROUP INC/WELCH (CONTACT/ENGINEERING/CONSULTING FIRM)
, CCI COLOR CONVERTING INC (CONTACT/OPERATOR)
, SIEGWERK USA INC (CONTACT/OPERATOR)
, RONALD BARRY (CONTACT/OWNER)
, CCI COLOR CONVERTING INC (CONTACT/OWNER)
, SIEGWERK USA INC (CONTACT/OWNER)
Alternative names: CCI COLOR CONVERTING INC, SIEGWERK USA INC, TIMCO PROPERTY(TECHNICAL INK MANUFACTURING COMPANY)
BOILING SPRINGS ELEMENTARY SCHOOL (700 DOUBLE BRIDGE ROAD in BOILING SPRINGS, SC)
(National Center for Education Statistics) - STATE ID-4202015 STATE MASTER (South Carolina database) - DRINKING WATER PROGRAM Organizations: SPARTANBURG COUNTY SCHOOL DISTRICT 02 (SCHOOL DISTRICT)
BOILING SPRINGS HIGH SCHOOL (2251 OLD FURNACE RD in BOILING SPRINGS, SC)
(Geographic Names Information System) (National Center for Education Statistics) - STATE ID-4202012 Organizations: SPARTANBURG COUNTY SCHOOL DISTRICT 02 (SCHOOL DISTRICT)
ECKERD EXPRESS PHOTO 8039 (8951 VALLEY FALLS RD in BOILING SPRINGS, SC)
Small Quantity Generators, between 100 kg and 1000 kg of hazardous waste/month (Resource Conservation and Recovery Act (tracking hazardous waste)) - notification STATE MASTER (South Carolina database) - HAZARDOUS WASTE PROGRAM Organizations: ECKERD CORPORATION (CONTACT/OWNER)
BOILING SPRINGS HIGH NINTH GRADE CA (3655 BOILING SPRING ROAD in BOILING SPRING, SC)
(National Center for Education Statistics) - STATE ID-4202025 Organizations: SPARTANBURG COUNTY SCHOOL DISTRICT 02 (SCHOOL DISTRICT)
BOILING SPRINGS JUNIOR HIGH (3655 BOILING SPRINGS RD in SPARTANBURG, SC)
(National Center for Education Statistics) - STATE ID-4202014 Organizations: SPARTANBURG COUNTY SCHOOL DISTRICT 02 (SCHOOL DISTRICT)
BOILING SPRINGS MIDDLE (1850 OLD FURNACE ROAD in BOILING SPRINGS, SC)
(National Center for Education Statistics) - STATE ID-4202024 Organizations: SPARTANBURG COUNTY SCHOOL DISTRICT 02 (SCHOOL DISTRICT)
BABB DRUMS (BABB ROAD in LITTLE CHICAGO, SC)
SUPERFUND (Superfund database)
Housing units lacking complete plumbing facilities: 0.4%
Housing units lacking complete kitchen facilities: 0.7%
68.4% Electricity 27.8% Utility gas 2.1% Bottled, tank, or LP gas 0.5% No fuel used
Place of birth for U.S.-born residents:
This state: 18,350Northeast: 1,619Midwest: 1,379South: 5,312West: 1,585
54% of the 29316 zip code residents lived in the same house 5 years ago.
Out of people who lived in different houses, 72% lived in this county.
Out of people who lived in different counties, 50% lived in South Carolina.
88% of the 29316 zip code residents lived in the same house 1 year ago.
Out of people who lived in different houses, 40% moved from this county.
Out of people who lived in different houses, 20% moved from different county within same state.
Out of people who lived in different houses, 39% moved from different state.
Out of people who lived in different houses, 1% moved from abroad.
Private vs. public school enrollment:
Students in private schools in grades 1 to 8 (elementary and middle school): 589
Here:
16.4%South Carolina:
14.4%
Students in private schools in grades 9 to 12 (high school): 219
Here:
16.9%South Carolina:
11.1%
Students in private undergraduate colleges: 420
Here:
24.8%South Carolina:
21.9%
Occupation by median earnings in the past 12 months ($)
102,742 Life, physical, and social science occupations 83,965 Business and financial operations occupations 80,235 Architecture and engineering occupations 79,940 Computer and mathematical occupations 72,345 Health diagnosing and treating practitioners and other technical occupations 65,956 Management occupations
Top industries in this zip code by the number of employees in 2005:
Administrative and Support and Waste Management and Remediation Services: Temporary Help Services (250-499 employees: 1 establishment)Accommodation and Food Services: Limited-Service Restaurants (50-99: 1, 20-49: 4, 10-19: 2, 1-4: 6)Accommodation and Food Services: Full-Service Restaurants (50-99: 2, 20-49: 1, 10-19: 3, 5-9: 2, 1-4: 2)Other Services (except Public Administration): Religious Organizations (50-99: 1, 20-49: 1, 5-9: 4, 1-4: 12)Health Care and Social Assistance: Child Day Care Services (20-49: 2, 10-19: 3, 5-9: 2, 1-4: 1)Administrative and Support and Waste Management and Remediation Services: Janitorial Services (20-49: 3, 5-9: 1, 1-4: 4)
People in group quarters in 2010:
12 people in residential treatment centers for adults
People in group quarters in 2000:
43 people in nursing homes
23 people in homes for the mentally retarded
Fatal accident statistics in 2014:
Fatal accident count: 2Vehicles involved in fatal accidents: 3Fatal accidents caused by drunken drivers: 1Fatalities: 2Persons involved in fatal accidents: 3Pedestrians involved in fatal accidents: 1
Fatal accident statistics in 2013:
Fatal accident count: 5Vehicles involved in fatal accidents: 11Fatal accidents caused by drunken drivers: 1Fatalities: 5Persons involved in fatal accidents: 18Pedestrians involved in fatal accidents: 0
Home Mortgage Disclosure Act Aggregated Statistics For Year 2009(Based on 8 partial tracts) A) FHA, FSA/RHS & VA B) Conventional C) Refinancings D) Home Improvement Loans E) Loans on Dwellings For 5+ Families F) Non-occupant Loans on G) Loans On Manufactured Number Average Value Number Average Value Number Average Value Number Average Value Number Average Value Number Average Value Number Average Value
LOANS ORIGINATED 222 $133,791 161 $146,923 558 $143,372 22 $55,609 1 $115,280 44 $113,011 4 $53,002 APPLICATIONS APPROVED, NOT ACCEPTED 8 $134,271 4 $162,762 59 $147,224 5 $29,044 0 $0 2 $207,545 1 $76,710 APPLICATIONS DENIED 49 $126,117 37 $150,842 240 $136,161 20 $29,121 0 $0 13 $90,261 8 $58,055 APPLICATIONS WITHDRAWN 24 $133,365 21 $152,870 151 $150,777 5 $86,862 0 $0 5 $134,178 2 $52,765 FILES CLOSED FOR INCOMPLETENESS 7 $140,356 4 $82,795 50 $157,318 2 $34,830 0 $0 1 $167,610 0 $0
Aggregated Statistics For Year 2008(Based on 8 partial tracts) A) FHA, FSA/RHS & VA B) Conventional C) Refinancings D) Home Improvement Loans E) Loans on Dwellings For 5+ Families F) Non-occupant Loans on G) Loans On Manufactured Number Average Value Number Average Value Number Average Value Number Average Value Number Average Value Number Average Value Number Average Value
LOANS ORIGINATED 159 $132,423 307 $138,329 314 $132,466 32 $60,371 3 $818,220 95 $110,264 13 $57,779 APPLICATIONS APPROVED, NOT ACCEPTED 5 $129,038 27 $164,448 55 $105,011 3 $21,367 0 $0 12 $68,717 4 $63,948 APPLICATIONS DENIED 39 $128,774 50 $106,872 272 $124,680 48 $44,900 0 $0 20 $109,344 11 $69,025 APPLICATIONS WITHDRAWN 14 $133,105 27 $154,937 96 $134,000 4 $85,505 0 $0 9 $76,633 2 $36,800 FILES CLOSED FOR INCOMPLETENESS 4 $112,740 5 $128,550 23 $137,857 2 $121,970 0 $0 0 $0 0 $0
Aggregated Statistics For Year 2007(Based on 8 partial tracts) A) FHA, FSA/RHS & VA B) Conventional C) Refinancings D) Home Improvement Loans F) Non-occupant Loans on G) Loans On Manufactured Number Average Value Number Average Value Number Average Value Number Average Value Number Average Value Number Average Value
LOANS ORIGINATED 59 $124,746 588 $133,275 315 $110,633 60 $47,804 134 $117,830 22 $61,184 APPLICATIONS APPROVED, NOT ACCEPTED 4 $117,548 57 $108,081 69 $99,374 6 $44,042 17 $82,507 12 $48,523 APPLICATIONS DENIED 14 $113,037 100 $105,588 342 $113,552 55 $45,368 28 $88,901 24 $57,264 APPLICATIONS WITHDRAWN 3 $126,217 59 $142,019 142 $125,274 6 $48,493 14 $116,172 2 $65,180 FILES CLOSED FOR INCOMPLETENESS 2 $139,635 21 $136,707 31 $131,617 3 $56,163 5 $103,732 0 $0
Aggregated Statistics For Year 2006(Based on 8 partial tracts) A) FHA, FSA/RHS & VA B) Conventional C) Refinancings D) Home Improvement Loans E) Loans on Dwellings For 5+ Families F) Non-occupant Loans on G) Loans On Manufactured Number Average Value Number Average Value Number Average Value Number Average Value Number Average Value Number Average Value Number Average Value
LOANS ORIGINATED 46 $145,492 780 $114,350 416 $95,658 58 $34,587 1 $1,631,710 217 $87,614 31 $55,830 APPLICATIONS APPROVED, NOT ACCEPTED 2 $185,015 99 $103,600 70 $104,066 14 $31,772 0 $0 20 $90,800 11 $52,021 APPLICATIONS DENIED 19 $131,473 179 $97,690 383 $107,563 67 $36,443 0 $0 35 $85,413 48 $56,636 APPLICATIONS WITHDRAWN 5 $120,404 88 $101,151 181 $112,410 10 $95,998 0 $0 26 $72,671 4 $60,578 FILES CLOSED FOR INCOMPLETENESS 1 $116,270 29 $99,981 65 $126,450 2 $145,190 0 $0 2 $80,030 1 $40,960
Aggregated Statistics For Year 2005(Based on 8 partial tracts) A) FHA, FSA/RHS & VA B) Conventional C) Refinancings D) Home Improvement Loans F) Non-occupant Loans on G) Loans On Manufactured Number Average Value Number Average Value Number Average Value Number Average Value Number Average Value Number Average Value
LOANS ORIGINATED 54 $128,377 702 $110,576 425 $108,498 55 $47,761 161 $107,522 22 $117,624 APPLICATIONS APPROVED, NOT ACCEPTED 1 $123,270 65 $113,554 75 $94,455 16 $31,363 12 $117,952 13 $56,542 APPLICATIONS DENIED 11 $98,001 153 $84,633 407 $103,055 66 $28,118 49 $53,228 54 $56,768 APPLICATIONS WITHDRAWN 8 $120,749 57 $102,998 223 $118,425 30 $123,203 19 $65,620 3 $81,063 FILES CLOSED FOR INCOMPLETENESS 1 $165,830 15 $103,694 68 $112,495 1 $35,470 2 $172,420 1 $61,190
Aggregated Statistics For Year 2004(Based on 8 partial tracts) A) FHA, FSA/RHS & VA B) Conventional C) Refinancings D) Home Improvement Loans E) Loans on Dwellings For 5+ Families F) Non-occupant Loans on G) Loans On Manufactured Number Average Value Number Average Value Number Average Value Number Average Value Number Average Value Number Average Value Number Average Value
LOANS ORIGINATED 57 $118,619 540 $111,638 522 $102,852 52 $40,750 1 $12,698,980 130 $111,345 22 $125,093 APPLICATIONS APPROVED, NOT ACCEPTED 0 $0 54 $102,050 68 $91,678 5 $26,418 0 $0 7 $86,156 9 $48,692 APPLICATIONS DENIED 9 $97,973 95 $97,722 350 $96,261 47 $25,570 0 $0 22 $101,068 44 $59,900 APPLICATIONS WITHDRAWN 6 $111,218 63 $106,852 188 $106,372 16 $39,264 0 $0 16 $87,632 9 $61,640 FILES CLOSED FOR INCOMPLETENESS 1 $71,340 15 $90,594 48 $104,562 1 $62,760 0 $0 3 $74,617 1 $39,640
Aggregated Statistics For Year 2003(Based on 8 partial tracts) A) FHA, FSA/RHS & VA B) Conventional C) Refinancings D) Home Improvement Loans E) Loans on Dwellings For 5+ Families F) Non-occupant Loans on Number Average Value Number Average Value Number Average Value Number Average Value Number Average Value Number Average Value
LOANS ORIGINATED 83 $115,187 494 $115,973 1,064 $101,805 26 $23,101 1 $536,940 110 $82,006 APPLICATIONS APPROVED, NOT ACCEPTED 1 $102,070 36 $102,565 116 $105,038 7 $24,459 0 $0 7 $81,089 APPLICATIONS DENIED 7 $120,884 109 $84,609 356 $95,472 28 $20,764 0 $0 17 $101,584 APPLICATIONS WITHDRAWN 6 $106,128 61 $117,339 175 $104,726 5 $28,536 0 $0 9 $85,528 FILES CLOSED FOR INCOMPLETENESS 4 $122,835 13 $105,850 28 $115,449 3 $23,640 0 $0 2 $59,855
Aggregated Statistics For Year 2002(Based on 8 partial tracts) A) FHA, FSA/RHS & VA B) Conventional C) Refinancings D) Home Improvement Loans F) Non-occupant Loans on Number Average Value Number Average Value Number Average Value Number Average Value Number Average Value
LOANS ORIGINATED 55 $101,746 407 $101,861 693 $98,328 31 $17,866 91 $83,577 APPLICATIONS APPROVED, NOT ACCEPTED 2 $79,265 31 $87,919 68 $96,814 6 $13,545 3 $69,430 APPLICATIONS DENIED 8 $102,662 95 $71,311 296 $89,607 40 $14,215 11 $80,032 APPLICATIONS WITHDRAWN 11 $108,949 32 $115,212 142 $91,568 2 $72,875 5 $98,708 FILES CLOSED FOR INCOMPLETENESS 1 $70,940 9 $133,512 40 $91,726 0 $0 3 $56,477
Aggregated Statistics For Year 2001(Based on 8 partial tracts) A) FHA, FSA/RHS & VA B) Conventional C) Refinancings D) Home Improvement Loans F) Non-occupant Loans on Number Average Value Number Average Value Number Average Value Number Average Value Number Average Value
LOANS ORIGINATED 90 $96,893 379 $98,738 584 $91,798 44 $17,362 82 $77,458 APPLICATIONS APPROVED, NOT ACCEPTED 2 $103,240 40 $62,221 82 $85,135 5 $12,876 4 $67,360 APPLICATIONS DENIED 8 $75,622 119 $67,178 288 $72,048 47 $16,113 11 $71,660 APPLICATIONS WITHDRAWN 8 $91,549 26 $103,810 122 $83,387 14 $36,554 6 $64,617 FILES CLOSED FOR INCOMPLETENESS 2 $125,860 9 $148,157 35 $90,651 0 $0 1 $81,350
Aggregated Statistics For Year 2000(Based on 8 partial tracts) A) FHA, FSA/RHS & VA B) Conventional C) Refinancings D) Home Improvement Loans F) Non-occupant Loans on Number Average Value Number Average Value Number Average Value Number Average Value Number Average Value
LOANS ORIGINATED 79 $92,046 323 $92,736 210 $73,513 51 $14,280 59 $68,943 APPLICATIONS APPROVED, NOT ACCEPTED 12 $40,595 62 $63,190 75 $77,757 15 $17,777 4 $62,770 APPLICATIONS DENIED 21 $72,748 180 $55,823 290 $63,262 61 $18,025 15 $72,077 APPLICATIONS WITHDRAWN 9 $104,672 26 $85,827 97 $64,964 7 $18,699 1 $48,400 FILES CLOSED FOR INCOMPLETENESS 2 $112,580 5 $69,514 30 $77,396 1 $44,920 1 $44,920
Aggregated Statistics For Year 1999(Based on 4 partial tracts) A) FHA, FSA/RHS & VA B) Conventional C) Refinancings D) Home Improvement Loans E) Loans on Dwellings For 5+ Families F) Non-occupant Loans on Number Average Value Number Average Value Number Average Value Number Average Value Number Average Value Number Average Value
LOANS ORIGINATED 32 $94,984 217 $94,177 190 $74,151 28 $16,194 1 $1,048,480 37 $68,419 APPLICATIONS APPROVED, NOT ACCEPTED 1 $106,440 36 $54,577 57 $71,761 8 $20,722 0 $0 5 $54,152 APPLICATIONS DENIED 6 $92,205 118 $57,512 146 $68,611 23 $10,978 0 $0 9 $85,306 APPLICATIONS WITHDRAWN 2 $114,115 19 $92,290 54 $67,218 2 $25,520 1 $98,370 1 $44,890 FILES CLOSED FOR INCOMPLETENESS 1 $132,010 3 $104,883 15 $67,264 1 $65,020 0 $0 2 $42,735
Detailed HMDA statistics for the following Tracts:
0218.01
,
0218.02 ,
0224.02 ,
0224.03
Private Mortgage Insurance Companies Aggregated Statistics For Year 2009(Based on 8 partial tracts) A) Conventional B) Refinancings D) Loans On Manufactured Number Average Value Number Average Value Number Average Value
LOANS ORIGINATED 42 $171,365 53 $164,783 0 $0 APPLICATIONS APPROVED, NOT ACCEPTED 12 $290,174 15 $118,200 0 $0 APPLICATIONS DENIED 13 $154,366 6 $141,345 1 $36,360 APPLICATIONS WITHDRAWN 3 $191,673 2 $112,600 0 $0 FILES CLOSED FOR INCOMPLETENESS 0 $0 0 $0 0 $0
Aggregated Statistics For Year 2008(Based on 8 partial tracts) A) Conventional B) Refinancings C) Non-occupant Loans on Number Average Value Number Average Value Number Average Value
LOANS ORIGINATED 134 $148,046 47 $156,602 11 $119,450 APPLICATIONS APPROVED, NOT ACCEPTED 40 $141,037 28 $177,091 3 $108,123 APPLICATIONS DENIED 7 $161,473 5 $101,916 4 $152,470 APPLICATIONS WITHDRAWN 1 $119,570 1 $117,380 1 $119,570 FILES CLOSED FOR INCOMPLETENESS 4 $151,588 1 $120,230 4 $144,455
Aggregated Statistics For Year 2007(Based on 8 partial tracts) A) Conventional B) Refinancings C) Non-occupant Loans on D) Loans On Manufactured Number Average Value Number Average Value Number Average Value Number Average Value
LOANS ORIGINATED 282 $136,089 61 $135,946 32 $115,531 0 $0 APPLICATIONS APPROVED, NOT ACCEPTED 24 $171,426 11 $131,396 2 $175,490 0 $0 APPLICATIONS DENIED 5 $85,298 3 $100,523 4 $81,000 1 $27,750 APPLICATIONS WITHDRAWN 8 $137,762 2 $156,895 2 $117,245 0 $0 FILES CLOSED FOR INCOMPLETENESS 0 $0 0 $0 0 $0 0 $0
Aggregated Statistics For Year 2006(Based on 8 partial tracts) A) Conventional B) Refinancings C) Non-occupant Loans on D) Loans On Manufactured Number Average Value Number Average Value Number Average Value Number Average Value
LOANS ORIGINATED 223 $135,522 41 $129,215 27 $113,499 1 $40,960 APPLICATIONS APPROVED, NOT ACCEPTED 15 $142,081 11 $148,735 1 $72,670 0 $0 APPLICATIONS DENIED 1 $232,440 1 $94,470 0 $0 0 $0 APPLICATIONS WITHDRAWN 7 $157,107 6 $155,912 2 $49,545 1 $72,670 FILES CLOSED FOR INCOMPLETENESS 0 $0 0 $0 0 $0 0 $0
Aggregated Statistics For Year 2005(Based on 8 partial tracts) A) Conventional B) Refinancings C) Non-occupant Loans on D) Loans On Manufactured Number Average Value Number Average Value Number Average Value Number Average Value
LOANS ORIGINATED 145 $123,710 65 $125,342 16 $100,163 0 $0 APPLICATIONS APPROVED, NOT ACCEPTED 12 $191,558 13 $124,519 1 $26,420 0 $0 APPLICATIONS DENIED 1 $19,510 1 $83,240 1 $83,240 0 $0 APPLICATIONS WITHDRAWN 15 $123,777 2 $107,500 1 $178,200 1 $55,790 FILES CLOSED FOR INCOMPLETENESS 0 $0 0 $0 0 $0 0 $0
Aggregated Statistics For Year 2004(Based on 8 partial tracts) A) Conventional B) Refinancings C) Non-occupant Loans on D) Loans On Manufactured Number Average Value Number Average Value Number Average Value Number Average Value
LOANS ORIGINATED 165 $127,319 62 $114,595 10 $87,724 3 $78,180 APPLICATIONS APPROVED, NOT ACCEPTED 22 $151,527 21 $132,575 3 $198,007 1 $68,570 APPLICATIONS DENIED 4 $84,340 0 $0 0 $0 0 $0 APPLICATIONS WITHDRAWN 9 $140,318 6 $111,518 3 $88,817 0 $0 FILES CLOSED FOR INCOMPLETENESS 2 $115,340 2 $165,830 1 $117,060 0 $0
Aggregated Statistics For Year 2003(Based on 8 partial tracts) A) Conventional B) Refinancings C) Non-occupant Loans on Number Average Value Number Average Value Number Average Value
LOANS ORIGINATED 173 $126,391 230 $112,866 13 $91,608 APPLICATIONS APPROVED, NOT ACCEPTED 46 $130,885 39 $117,802 6 $62,480 APPLICATIONS DENIED 4 $100,220 4 $100,132 1 $35,470 APPLICATIONS WITHDRAWN 12 $231,128 13 $107,505 0 $0 FILES CLOSED FOR INCOMPLETENESS 4 $78,718 2 $100,370 0 $0
Aggregated Statistics For Year 2002(Based on 8 partial tracts) A) Conventional B) Refinancings C) Non-occupant Loans on Number Average Value Number Average Value Number Average Value
LOANS ORIGINATED 168 $117,477 167 $112,901 13 $83,689 APPLICATIONS APPROVED, NOT ACCEPTED 27 $109,399 22 $112,761 1 $120,870 APPLICATIONS DENIED 5 $111,146 12 $107,325 1 $113,900 APPLICATIONS WITHDRAWN 5 $132,626 13 $119,202 1 $64,080 FILES CLOSED FOR INCOMPLETENESS 3 $174,617 2 $125,445 0 $0
Aggregated Statistics For Year 2001(Based on 8 partial tracts) A) Conventional B) Refinancings C) Non-occupant Loans on Number Average Value Number Average Value Number Average Value
LOANS ORIGINATED 165 $110,398 110 $106,807 4 $77,420 APPLICATIONS APPROVED, NOT ACCEPTED 15 $107,531 15 $94,435 1 $56,950 APPLICATIONS DENIED 6 $100,240 8 $105,548 0 $0 APPLICATIONS WITHDRAWN 3 $74,307 7 $117,821 0 $0 FILES CLOSED FOR INCOMPLETENESS 1 $99,320 3 $91,243 0 $0
Aggregated Statistics For Year 2000(Based on 8 partial tracts) A) Conventional B) Refinancings C) Non-occupant Loans on Number Average Value Number Average Value Number Average Value
LOANS ORIGINATED 137 $110,390 30 $89,970 5 $95,876 APPLICATIONS APPROVED, NOT ACCEPTED 9 $135,041 5 $99,556 0 $0 APPLICATIONS DENIED 7 $93,500 2 $71,830 1 $116,170 APPLICATIONS WITHDRAWN 2 $96,660 2 $109,440 0 $0 FILES CLOSED FOR INCOMPLETENESS 2 $76,625 0 $0 0 $0
Aggregated Statistics For Year 1999(Based on 4 partial tracts) A) Conventional B) Refinancings C) Non-occupant Loans on Number Average Value Number Average Value Number Average Value
LOANS ORIGINATED 80 $108,148 22 $100,985 3 $81,747 APPLICATIONS APPROVED, NOT ACCEPTED 5 $129,294 4 $84,892 0 $0 APPLICATIONS DENIED 2 $120,530 1 $69,460 1 $38,820 APPLICATIONS WITHDRAWN 1 $111,040 0 $0 0 $0 FILES CLOSED FOR INCOMPLETENESS 2 $85,850 0 $0 0 $0
Detailed PMIC statistics for the following Tracts:
0218.01
,
0218.02 ,
0224.02 ,
0224.03
2002 - 2018 National Fire Incident Reporting System (NFIRS) incidents See full 2006 National Fire Incident Reporting System statistics for zip code 29316, South Carolina
Most common first names in zip code 29316 among deceased individuals Name Count Lived (average)
James 37 70.6 years William 30 75.1 years John 27 77.0 years Mary 26 75.5 years Robert 19 74.0 years Charles 17 72.0 years Dorothy 15 81.5 years Helen 13 75.3 years Thomas 10 68.5 years Henry 10 79.5 years
Most common last names in zip code 29316 among deceased individuals Last name Count Lived (average)
Smith 20 71.5 years Bishop 15 73.5 years Fowler 12 68.1 years Kimbrell 10 69.1 years Seay 10 77.0 years Horton 9 78.8 years Martin 8 70.1 years Wilson 8 82.1 years Davis 7 82.1 years Johnson 7 78.6 years
Businesses in zip code 29316
Name Count Name Count
AT&T 1 H&R Block 1 Ace Hardware 1 Little Caesars Pizza 1 Advance Auto Parts 1 Lowe's 1 Applebee's 1 MasterBrand Cabinets 2 Arby's 1 Papa John's Pizza 1 AutoZone 1 RadioShack 1 Blockbuster 1 Rite Aid 1 Burger King 1 SONIC Drive-In 1 CVS 1 Subway 2 Chick-Fil-A 1 T-Mobile 2 Comfort Inn 1 U-Haul 1 Days Inn 1 UPS 1 Dennys 1 Waffle House 2 Domino's Pizza 1 Walgreens 1 FedEx 1 Walmart 1 GameStop 1 Wendy's 1
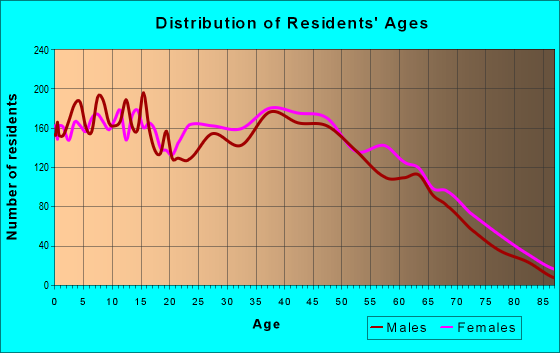
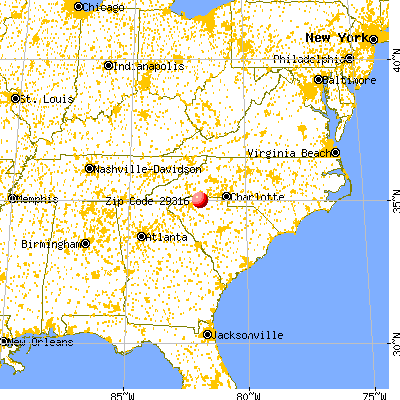


 Nearest zip codes: 29303, 29378, 29320, 29349, 29338, 29333.


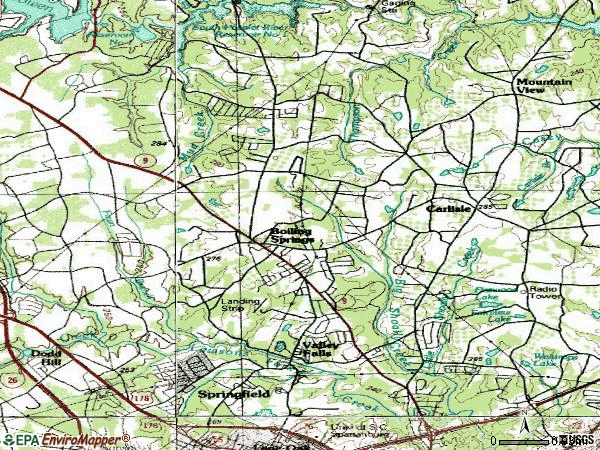

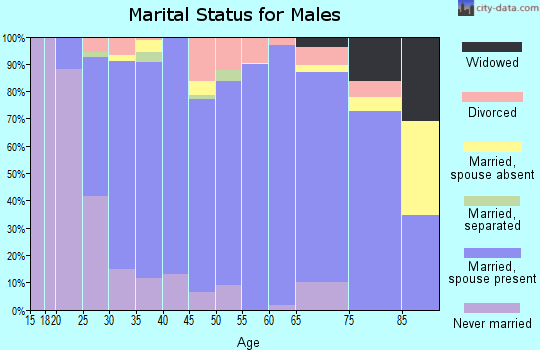


 According to the data from the years 2002 - 2018 the average number of fire incidents per year is 88. The highest number of reported fire incidents - 170 took place in 2004, and the least - 8 in 2002. The data has an increasing trend.
 When looking into fire subcategories, the most reports belonged to: Structure Fires (41.7%), and Outside Fires (41.6%).