Estimated zip code population in 2022: 35,148
Zip code population in 2010: 31,296
Zip code population in 2000: 26,376
Houses and condos: 14,903
Renter-occupied apartments: 2,469
% of renters here:
17%State:
33%
March 2022 cost of living index in zip code 28409: 94.0
(less than average, U.S. average is 100)
Land area: 23.8
sq. mi.
Water area: 5.9
sq. mi.
Population density: 1,476 people per square mile (low).
OSM Map
General Map
Google Map
MSN Map
OSM Map
General Map
Google Map
MSN Map
OSM Map
General Map
Google Map
MSN Map
OSM Map
General Map
Google Map
MSN Map
Please wait while loading the map...
Real estate property taxes paid for housing units in 2022:
This zip code:
0.6% ($2,431)North Carolina:
0.6% ($1,769)
Median real estate property taxes paid for housing units with mortgages in 2022: $2,481 (0.6%)
Median real estate property taxes paid for housing units with no mortgage in 2022: $2,181 (0.6%)
Profiles of local businesses
Business Search - 14 Million verified businesses
Males: 16,984 Females: 18,164
For population 25 years and over in 28409:
High school or higher: 98.1%Bachelor's degree or higher: 53.5%Graduate or professional degree: 21.1%Unemployed: 2.7%Mean travel time to work (commute): 21.1 minutes
For population 15 years and over in 28409:
Never married: 21.7%Now married: 62.6%Separated: 1.0%Widowed: 5.6%Divorced: 9.1%
Zip code 28409 compared to state average:
Median household income above state average. Median house value above state average. Black race population percentage significantly below state average. Hispanic race population percentage below state average. Median age above state average. Foreign-born population percentage significantly below state average. Renting percentage below state average. Length of stay since moving in above state average. Number of rooms per house above state average. Percentage of population with a bachelor's degree or higher above state average. 31,147 88.6% White 1,427 4.1% Hispanic or Latino 994 2.8% Black 964 2.7% Two or more races 342 1.0% Asian 128 0.4% American Indian 143 0.4% Some other race
Data:
Median household income ($)
Median household income (% change since 2000)
Household income diversity
Ratio of average income to average house value (%)
Ratio of average income to average rent
Median household income ($) - White
Median household income ($) - Black or African American
Median household income ($) - Asian
Median household income ($) - Hispanic or Latino
Median household income ($) - American Indian and Alaska Native
Median household income ($) - Multirace
Median household income ($) - Other Race
Median household income for houses/condos with a mortgage ($)
Median household income for apartments without a mortgage ($)
Races - White alone (%)
Races - White alone (% change since 2000)
Races - Black alone (%)
Races - Black alone (% change since 2000)
Races - American Indian alone (%)
Races - American Indian alone (% change since 2000)
Races - Asian alone (%)
Races - Asian alone (% change since 2000)
Races - Hispanic (%)
Races - Hispanic (% change since 2000)
Races - Native Hawaiian and Other Pacific Islander alone (%)
Races - Native Hawaiian and Other Pacific Islander alone (% change since 2000)
Races - Two or more races (%)
Races - Two or more races (% change since 2000)
Races - Other race alone (%)
Races - Other race alone (% change since 2000)
Racial diversity
Unemployment (%)
Unemployment (% change since 2000)
Unemployment (%) - White
Unemployment (%) - Black or African American
Unemployment (%) - Asian
Unemployment (%) - Hispanic or Latino
Unemployment (%) - American Indian and Alaska Native
Unemployment (%) - Multirace
Unemployment (%) - Other Race
Population density (people per square mile)
Population - Males (%)
Population - Females (%)
Population - Males (%) - White
Population - Males (%) - Black or African American
Population - Males (%) - Asian
Population - Males (%) - Hispanic or Latino
Population - Males (%) - American Indian and Alaska Native
Population - Males (%) - Multirace
Population - Males (%) - Other Race
Population - Females (%) - White
Population - Females (%) - Black or African American
Population - Females (%) - Asian
Population - Females (%) - Hispanic or Latino
Population - Females (%) - American Indian and Alaska Native
Population - Females (%) - Multirace
Population - Females (%) - Other Race
Coronavirus confirmed cases (Jun 05, 2024)
Deaths caused by coronavirus (Jun 05, 2024)
Coronavirus confirmed cases (per 100k population) (Jun 05, 2024)
Deaths caused by coronavirus (per 100k population) (Jun 05, 2024)
Daily increase in number of cases (Jun 05, 2024)
Weekly increase in number of cases (Jun 05, 2024)
Cases doubled (in days) (Jun 05, 2024)
Hospitalized patients (Apr 18, 2022)
Negative test results (Apr 18, 2022)
Total test results (Apr 18, 2022)
COVID Vaccine doses distributed (per 100k population) (Sep 19, 2023)
COVID Vaccine doses administered (per 100k population) (Sep 19, 2023)
COVID Vaccine doses distributed (Sep 19, 2023)
COVID Vaccine doses administered (Sep 19, 2023)
Likely homosexual households (%)
Likely homosexual households (% change since 2000)
Likely homosexual households - Lesbian couples (%)
Likely homosexual households - Lesbian couples (% change since 2000)
Likely homosexual households - Gay men (%)
Likely homosexual households - Gay men (% change since 2000)
Cost of living index
Median gross rent ($)
Median contract rent ($)
Median monthly housing costs ($)
Median house or condo value ($)
Median house or condo value ($ change since 2000)
Mean house or condo value by units in structure - 1, detached ($)
Mean house or condo value by units in structure - 1, attached ($)
Mean house or condo value by units in structure - 2 ($)
Mean house or condo value by units in structure by units in structure - 3 or 4 ($)
Mean house or condo value by units in structure - 5 or more ($)
Mean house or condo value by units in structure - Boat, RV, van, etc. ($)
Mean house or condo value by units in structure - Mobile home ($)
Median house or condo value ($) - White
Median house or condo value ($) - Black or African American
Median house or condo value ($) - Asian
Median house or condo value ($) - Hispanic or Latino
Median house or condo value ($) - American Indian and Alaska Native
Median house or condo value ($) - Multirace
Median house or condo value ($) - Other Race
Median resident age
Resident age diversity
Median resident age - Males
Median resident age - Females
Median resident age - White
Median resident age - Black or African American
Median resident age - Asian
Median resident age - Hispanic or Latino
Median resident age - American Indian and Alaska Native
Median resident age - Multirace
Median resident age - Other Race
Median resident age - Males - White
Median resident age - Males - Black or African American
Median resident age - Males - Asian
Median resident age - Males - Hispanic or Latino
Median resident age - Males - American Indian and Alaska Native
Median resident age - Males - Multirace
Median resident age - Males - Other Race
Median resident age - Females - White
Median resident age - Females - Black or African American
Median resident age - Females - Asian
Median resident age - Females - Hispanic or Latino
Median resident age - Females - American Indian and Alaska Native
Median resident age - Females - Multirace
Median resident age - Females - Other Race
Commute - mean travel time to work (minutes)
Travel time to work - Less than 5 minutes (%)
Travel time to work - Less than 5 minutes (% change since 2000)
Travel time to work - 5 to 9 minutes (%)
Travel time to work - 5 to 9 minutes (% change since 2000)
Travel time to work - 10 to 19 minutes (%)
Travel time to work - 10 to 19 minutes (% change since 2000)
Travel time to work - 20 to 29 minutes (%)
Travel time to work - 20 to 29 minutes (% change since 2000)
Travel time to work - 30 to 39 minutes (%)
Travel time to work - 30 to 39 minutes (% change since 2000)
Travel time to work - 40 to 59 minutes (%)
Travel time to work - 40 to 59 minutes (% change since 2000)
Travel time to work - 60 to 89 minutes (%)
Travel time to work - 60 to 89 minutes (% change since 2000)
Travel time to work - 90 or more minutes (%)
Travel time to work - 90 or more minutes (% change since 2000)
Marital status - Never married (%)
Marital status - Now married (%)
Marital status - Separated (%)
Marital status - Widowed (%)
Marital status - Divorced (%)
Median family income ($)
Median family income (% change since 2000)
Median non-family income ($)
Median non-family income (% change since 2000)
Median per capita income ($)
Median per capita income (% change since 2000)
Median family income ($) - White
Median family income ($) - Black or African American
Median family income ($) - Asian
Median family income ($) - Hispanic or Latino
Median family income ($) - American Indian and Alaska Native
Median family income ($) - Multirace
Median family income ($) - Other Race
Median year house/condo built
Median year apartment built
Year house built - Built 2005 or later (%)
Year house built - Built 2000 to 2004 (%)
Year house built - Built 1990 to 1999 (%)
Year house built - Built 1980 to 1989 (%)
Year house built - Built 1970 to 1979 (%)
Year house built - Built 1960 to 1969 (%)
Year house built - Built 1950 to 1959 (%)
Year house built - Built 1940 to 1949 (%)
Year house built - Built 1939 or earlier (%)
Average household size
Household density (households per square mile)
Average household size - White
Average household size - Black or African American
Average household size - Asian
Average household size - Hispanic or Latino
Average household size - American Indian and Alaska Native
Average household size - Multirace
Average household size - Other Race
Occupied housing units (%)
Vacant housing units (%)
Owner occupied housing units (%)
Renter occupied housing units (%)
Vacancy status - For rent (%)
Vacancy status - For sale only (%)
Vacancy status - Rented or sold, not occupied (%)
Vacancy status - For seasonal, recreational, or occasional use (%)
Vacancy status - For migrant workers (%)
Vacancy status - Other vacant (%)
Residents with income below the poverty level (%)
Residents with income below 50% of the poverty level (%)
Children below poverty level (%)
Poor families by family type - Married-couple family (%)
Poor families by family type - Male, no wife present (%)
Poor families by family type - Female, no husband present (%)
Poverty status for native-born residents (%)
Poverty status for foreign-born residents (%)
Poverty among high school graduates not in families (%)
Poverty among people who did not graduate high school not in families (%)
Residents with income below the poverty level (%) - White
Residents with income below the poverty level (%) - Black or African American
Residents with income below the poverty level (%) - Asian
Residents with income below the poverty level (%) - Hispanic or Latino
Residents with income below the poverty level (%) - American Indian and Alaska Native
Residents with income below the poverty level (%) - Multirace
Residents with income below the poverty level (%) - Other Race
Air pollution - Air Quality Index (AQI)
Air pollution - CO
Air pollution - NO2
Air pollution - SO2
Air pollution - Ozone
Air pollution - PM10
Air pollution - PM25
Air pollution - Pb
Crime - Murders per 100,000 population
Crime - Rapes per 100,000 population
Crime - Robberies per 100,000 population
Crime - Assaults per 100,000 population
Crime - Burglaries per 100,000 population
Crime - Thefts per 100,000 population
Crime - Auto thefts per 100,000 population
Crime - Arson per 100,000 population
Crime - City-data.com crime index
Crime - Violent crime index
Crime - Property crime index
Crime - Murders per 100,000 population (5 year average)
Crime - Rapes per 100,000 population (5 year average)
Crime - Robberies per 100,000 population (5 year average)
Crime - Assaults per 100,000 population (5 year average)
Crime - Burglaries per 100,000 population (5 year average)
Crime - Thefts per 100,000 population (5 year average)
Crime - Auto thefts per 100,000 population (5 year average)
Crime - Arson per 100,000 population (5 year average)
Crime - City-data.com crime index (5 year average)
Crime - Violent crime index (5 year average)
Crime - Property crime index (5 year average)
1996 Presidential Elections Results (%) - Democratic Party (Clinton)
1996 Presidential Elections Results (%) - Republican Party (Dole)
1996 Presidential Elections Results (%) - Other
2000 Presidential Elections Results (%) - Democratic Party (Gore)
2000 Presidential Elections Results (%) - Republican Party (Bush)
2000 Presidential Elections Results (%) - Other
2004 Presidential Elections Results (%) - Democratic Party (Kerry)
2004 Presidential Elections Results (%) - Republican Party (Bush)
2004 Presidential Elections Results (%) - Other
2008 Presidential Elections Results (%) - Democratic Party (Obama)
2008 Presidential Elections Results (%) - Republican Party (McCain)
2008 Presidential Elections Results (%) - Other
2012 Presidential Elections Results (%) - Democratic Party (Obama)
2012 Presidential Elections Results (%) - Republican Party (Romney)
2012 Presidential Elections Results (%) - Other
2016 Presidential Elections Results (%) - Democratic Party (Clinton)
2016 Presidential Elections Results (%) - Republican Party (Trump)
2016 Presidential Elections Results (%) - Other
2020 Presidential Elections Results (%) - Democratic Party (Biden)
2020 Presidential Elections Results (%) - Republican Party (Trump)
2020 Presidential Elections Results (%) - Other
Ancestries Reported - Arab (%)
Ancestries Reported - Czech (%)
Ancestries Reported - Danish (%)
Ancestries Reported - Dutch (%)
Ancestries Reported - English (%)
Ancestries Reported - French (%)
Ancestries Reported - French Canadian (%)
Ancestries Reported - German (%)
Ancestries Reported - Greek (%)
Ancestries Reported - Hungarian (%)
Ancestries Reported - Irish (%)
Ancestries Reported - Italian (%)
Ancestries Reported - Lithuanian (%)
Ancestries Reported - Norwegian (%)
Ancestries Reported - Polish (%)
Ancestries Reported - Portuguese (%)
Ancestries Reported - Russian (%)
Ancestries Reported - Scotch-Irish (%)
Ancestries Reported - Scottish (%)
Ancestries Reported - Slovak (%)
Ancestries Reported - Subsaharan African (%)
Ancestries Reported - Swedish (%)
Ancestries Reported - Swiss (%)
Ancestries Reported - Ukrainian (%)
Ancestries Reported - United States (%)
Ancestries Reported - Welsh (%)
Ancestries Reported - West Indian (%)
Ancestries Reported - Other (%)
Educational Attainment - No schooling completed (%)
Educational Attainment - Less than high school (%)
Educational Attainment - High school or equivalent (%)
Educational Attainment - Less than 1 year of college (%)
Educational Attainment - 1 or more years of college (%)
Educational Attainment - Associate degree (%)
Educational Attainment - Bachelor's degree (%)
Educational Attainment - Master's degree (%)
Educational Attainment - Professional school degree (%)
Educational Attainment - Doctorate degree (%)
School Enrollment - Nursery, preschool (%)
School Enrollment - Kindergarten (%)
School Enrollment - Grade 1 to 4 (%)
School Enrollment - Grade 5 to 8 (%)
School Enrollment - Grade 9 to 12 (%)
School Enrollment - College undergrad (%)
School Enrollment - Graduate or professional (%)
School Enrollment - Not enrolled in school (%)
School enrollment - Public schools (%)
School enrollment - Private schools (%)
School enrollment - Not enrolled (%)
Median number of rooms in houses and condos
Median number of rooms in apartments
Housing units lacking complete plumbing facilities (%)
Housing units lacking complete kitchen facilities (%)
Density of houses
Urban houses (%)
Rural houses (%)
Households with people 60 years and over (%)
Households with people 65 years and over (%)
Households with people 75 years and over (%)
Households with one or more nonrelatives (%)
Households with no nonrelatives (%)
Population in households (%)
Family households (%)
Nonfamily households (%)
Population in families (%)
Family households with own children (%)
Median number of bedrooms in owner occupied houses
Mean number of bedrooms in owner occupied houses
Median number of bedrooms in renter occupied houses
Mean number of bedrooms in renter occupied houses
Median number of vehichles in owner occupied houses
Mean number of vehichles in owner occupied houses
Median number of vehichles in renter occupied houses
Mean number of vehichles in renter occupied houses
Mortgage status - with mortgage (%)
Mortgage status - with second mortgage (%)
Mortgage status - with home equity loan (%)
Mortgage status - with both second mortgage and home equity loan (%)
Mortgage status - without a mortgage (%)
Average family size
Average family size - White
Average family size - Black or African American
Average family size - Asian
Average family size - Hispanic or Latino
Average family size - American Indian and Alaska Native
Average family size - Multirace
Average family size - Other Race
Geographical mobility - Same house 1 year ago (%)
Geographical mobility - Moved within same county (%)
Geographical mobility - Moved from different county within same state (%)
Geographical mobility - Moved from different state (%)
Geographical mobility - Moved from abroad (%)
Place of birth - Born in state of residence (%)
Place of birth - Born in other state (%)
Place of birth - Native, outside of US (%)
Place of birth - Foreign born (%)
Housing units in structures - 1, detached (%)
Housing units in structures - 1, attached (%)
Housing units in structures - 2 (%)
Housing units in structures - 3 or 4 (%)
Housing units in structures - 5 to 9 (%)
Housing units in structures - 10 to 19 (%)
Housing units in structures - 20 to 49 (%)
Housing units in structures - 50 or more (%)
Housing units in structures - Mobile home (%)
Housing units in structures - Boat, RV, van, etc. (%)
House/condo owner moved in on average (years ago)
Renter moved in on average (years ago)
Year householder moved into unit - Moved in 1999 to March 2000 (%)
Year householder moved into unit - Moved in 1995 to 1998 (%)
Year householder moved into unit - Moved in 1990 to 1994 (%)
Year householder moved into unit - Moved in 1980 to 1989 (%)
Year householder moved into unit - Moved in 1970 to 1979 (%)
Year householder moved into unit - Moved in 1969 or earlier (%)
Means of transportation to work - Drove car alone (%)
Means of transportation to work - Carpooled (%)
Means of transportation to work - Public transportation (%)
Means of transportation to work - Bus or trolley bus (%)
Means of transportation to work - Streetcar or trolley car (%)
Means of transportation to work - Subway or elevated (%)
Means of transportation to work - Railroad (%)
Means of transportation to work - Ferryboat (%)
Means of transportation to work - Taxicab (%)
Means of transportation to work - Motorcycle (%)
Means of transportation to work - Bicycle (%)
Means of transportation to work - Walked (%)
Means of transportation to work - Other means (%)
Working at home (%)
Industry diversity
Most Common Industries - Agriculture, forestry, fishing and hunting, and mining (%)
Most Common Industries - Agriculture, forestry, fishing and hunting (%)
Most Common Industries - Mining, quarrying, and oil and gas extraction (%)
Most Common Industries - Construction (%)
Most Common Industries - Manufacturing (%)
Most Common Industries - Wholesale trade (%)
Most Common Industries - Retail trade (%)
Most Common Industries - Transportation and warehousing, and utilities (%)
Most Common Industries - Transportation and warehousing (%)
Most Common Industries - Utilities (%)
Most Common Industries - Information (%)
Most Common Industries - Finance and insurance, and real estate and rental and leasing (%)
Most Common Industries - Finance and insurance (%)
Most Common Industries - Real estate and rental and leasing (%)
Most Common Industries - Professional, scientific, and management, and administrative and waste management services (%)
Most Common Industries - Professional, scientific, and technical services (%)
Most Common Industries - Management of companies and enterprises (%)
Most Common Industries - Administrative and support and waste management services (%)
Most Common Industries - Educational services, and health care and social assistance (%)
Most Common Industries - Educational services (%)
Most Common Industries - Health care and social assistance (%)
Most Common Industries - Arts, entertainment, and recreation, and accommodation and food services (%)
Most Common Industries - Arts, entertainment, and recreation (%)
Most Common Industries - Accommodation and food services (%)
Most Common Industries - Other services, except public administration (%)
Most Common Industries - Public administration (%)
Occupation diversity
Most Common Occupations - Management, business, science, and arts occupations (%)
Most Common Occupations - Management, business, and financial occupations (%)
Most Common Occupations - Management occupations (%)
Most Common Occupations - Business and financial operations occupations (%)
Most Common Occupations - Computer, engineering, and science occupations (%)
Most Common Occupations - Computer and mathematical occupations (%)
Most Common Occupations - Architecture and engineering occupations (%)
Most Common Occupations - Life, physical, and social science occupations (%)
Most Common Occupations - Education, legal, community service, arts, and media occupations (%)
Most Common Occupations - Community and social service occupations (%)
Most Common Occupations - Legal occupations (%)
Most Common Occupations - Education, training, and library occupations (%)
Most Common Occupations - Arts, design, entertainment, sports, and media occupations (%)
Most Common Occupations - Healthcare practitioners and technical occupations (%)
Most Common Occupations - Health diagnosing and treating practitioners and other technical occupations (%)
Most Common Occupations - Health technologists and technicians (%)
Most Common Occupations - Service occupations (%)
Most Common Occupations - Healthcare support occupations (%)
Most Common Occupations - Protective service occupations (%)
Most Common Occupations - Fire fighting and prevention, and other protective service workers including supervisors (%)
Most Common Occupations - Law enforcement workers including supervisors (%)
Most Common Occupations - Food preparation and serving related occupations (%)
Most Common Occupations - Building and grounds cleaning and maintenance occupations (%)
Most Common Occupations - Personal care and service occupations (%)
Most Common Occupations - Sales and office occupations (%)
Most Common Occupations - Sales and related occupations (%)
Most Common Occupations - Office and administrative support occupations (%)
Most Common Occupations - Natural resources, construction, and maintenance occupations (%)
Most Common Occupations - Farming, fishing, and forestry occupations (%)
Most Common Occupations - Construction and extraction occupations (%)
Most Common Occupations - Installation, maintenance, and repair occupations (%)
Most Common Occupations - Production, transportation, and material moving occupations (%)
Most Common Occupations - Production occupations (%)
Most Common Occupations - Transportation occupations (%)
Most Common Occupations - Material moving occupations (%)
People in Group quarters - Institutionalized population (%)
People in Group quarters - Correctional institutions (%)
People in Group quarters - Federal prisons and detention centers (%)
People in Group quarters - Halfway houses (%)
People in Group quarters - Local jails and other confinement facilities (including police lockups) (%)
People in Group quarters - Military disciplinary barracks (%)
People in Group quarters - State prisons (%)
People in Group quarters - Other types of correctional institutions (%)
People in Group quarters - Nursing homes (%)
People in Group quarters - Hospitals/wards, hospices, and schools for the handicapped (%)
People in Group quarters - Hospitals/wards and hospices for chronically ill (%)
People in Group quarters - Hospices or homes for chronically ill (%)
People in Group quarters - Military hospitals or wards for chronically ill (%)
People in Group quarters - Other hospitals or wards for chronically ill (%)
People in Group quarters - Hospitals or wards for drug/alcohol abuse (%)
People in Group quarters - Mental (Psychiatric) hospitals or wards (%)
People in Group quarters - Schools, hospitals, or wards for the mentally retarded (%)
People in Group quarters - Schools, hospitals, or wards for the physically handicapped (%)
People in Group quarters - Institutions for the deaf (%)
People in Group quarters - Institutions for the blind (%)
People in Group quarters - Orthopedic wards and institutions for the physically handicapped (%)
People in Group quarters - Wards in general hospitals for patients who have no usual home elsewhere (%)
People in Group quarters - Wards in military hospitals for patients who have no usual home elsewhere (%)
People in Group quarters - Juvenile institutions (%)
People in Group quarters - Long-term care (%)
People in Group quarters - Homes for abused, dependent, and neglected children (%)
People in Group quarters - Residential treatment centers for emotionally disturbed children (%)
People in Group quarters - Training schools for juvenile delinquents (%)
People in Group quarters - Short-term care, detention or diagnostic centers for delinquent children (%)
People in Group quarters - Type of juvenile institution unknown (%)
People in Group quarters - Noninstitutionalized population (%)
People in Group quarters - College dormitories (includes college quarters off campus) (%)
People in Group quarters - Military quarters (%)
People in Group quarters - On base (%)
People in Group quarters - Barracks, unaccompanied personnel housing (UPH), (Enlisted/Officer), ;and similar group living quarters for military personnel (%)
People in Group quarters - Transient quarters for temporary residents (%)
People in Group quarters - Military ships (%)
People in Group quarters - Group homes (%)
People in Group quarters - Homes or halfway houses for drug/alcohol abuse (%)
People in Group quarters - Homes for the mentally ill (%)
People in Group quarters - Homes for the mentally retarded (%)
People in Group quarters - Homes for the physically handicapped (%)
People in Group quarters - Other group homes (%)
People in Group quarters - Religious group quarters (%)
People in Group quarters - Dormitories (%)
People in Group quarters - Agriculture workers' dormitories on farms (%)
People in Group quarters - Job Corps and vocational training facilities (%)
People in Group quarters - Other workers' dormitories (%)
People in Group quarters - Crews of maritime vessels (%)
People in Group quarters - Other nonhousehold living situations (%)
People in Group quarters - Other noninstitutional group quarters (%)
Residents speaking English at home (%)
Residents speaking English at home - Born in the United States (%)
Residents speaking English at home - Native, born elsewhere (%)
Residents speaking English at home - Foreign born (%)
Residents speaking Spanish at home (%)
Residents speaking Spanish at home - Born in the United States (%)
Residents speaking Spanish at home - Native, born elsewhere (%)
Residents speaking Spanish at home - Foreign born (%)
Residents speaking other language at home (%)
Residents speaking other language at home - Born in the United States (%)
Residents speaking other language at home - Native, born elsewhere (%)
Residents speaking other language at home - Foreign born (%)
Class of Workers - Employee of private company (%)
Class of Workers - Self-employed in own incorporated business (%)
Class of Workers - Private not-for-profit wage and salary workers (%)
Class of Workers - Local government workers (%)
Class of Workers - State government workers (%)
Class of Workers - Federal government workers (%)
Class of Workers - Self-employed workers in own not incorporated business and Unpaid family workers (%)
House heating fuel used in houses and condos - Utility gas (%)
House heating fuel used in houses and condos - Bottled, tank, or LP gas (%)
House heating fuel used in houses and condos - Electricity (%)
House heating fuel used in houses and condos - Fuel oil, kerosene, etc. (%)
House heating fuel used in houses and condos - Coal or coke (%)
House heating fuel used in houses and condos - Wood (%)
House heating fuel used in houses and condos - Solar energy (%)
House heating fuel used in houses and condos - Other fuel (%)
House heating fuel used in houses and condos - No fuel used (%)
House heating fuel used in apartments - Utility gas (%)
House heating fuel used in apartments - Bottled, tank, or LP gas (%)
House heating fuel used in apartments - Electricity (%)
House heating fuel used in apartments - Fuel oil, kerosene, etc. (%)
House heating fuel used in apartments - Coal or coke (%)
House heating fuel used in apartments - Wood (%)
House heating fuel used in apartments - Solar energy (%)
House heating fuel used in apartments - Other fuel (%)
House heating fuel used in apartments - No fuel used (%)
Armed forces status - In Armed Forces (%)
Armed forces status - Civilian (%)
Armed forces status - Civilian - Veteran (%)
Armed forces status - Civilian - Nonveteran (%)
Fatal accidents locations in years 2005-2021
Fatal accidents locations in 2005
Fatal accidents locations in 2006
Fatal accidents locations in 2007
Fatal accidents locations in 2008
Fatal accidents locations in 2009
Fatal accidents locations in 2010
Fatal accidents locations in 2011
Fatal accidents locations in 2012
Fatal accidents locations in 2013
Fatal accidents locations in 2014
Fatal accidents locations in 2015
Fatal accidents locations in 2016
Fatal accidents locations in 2017
Fatal accidents locations in 2018
Fatal accidents locations in 2019
Fatal accidents locations in 2020
Fatal accidents locations in 2021
Alcohol use - People drinking some alcohol every month (%)
Alcohol use - People not drinking at all (%)
Alcohol use - Average days/month drinking alcohol
Alcohol use - Average drinks/week
Alcohol use - Average days/year people drink much
Audiometry - Average condition of hearing (%)
Audiometry - People that can hear a whisper from across a quiet room (%)
Audiometry - People that can hear normal voice from across a quiet room (%)
Audiometry - Ears ringing, roaring, buzzing (%)
Audiometry - Had a job exposure to loud noise (%)
Audiometry - Had off-work exposure to loud noise (%)
Blood Pressure & Cholesterol - Has high blood pressure (%)
Blood Pressure & Cholesterol - Checking blood pressure at home (%)
Blood Pressure & Cholesterol - Frequently checking blood cholesterol (%)
Blood Pressure & Cholesterol - Has high cholesterol level (%)
Consumer Behavior - Money monthly spent on food at supermarket/grocery store
Consumer Behavior - Money monthly spent on food at other stores
Consumer Behavior - Money monthly spent on eating out
Consumer Behavior - Money monthly spent on carryout/delivered foods
Consumer Behavior - Income spent on food at supermarket/grocery store (%)
Consumer Behavior - Income spent on food at other stores (%)
Consumer Behavior - Income spent on eating out (%)
Consumer Behavior - Income spent on carryout/delivered foods (%)
Current Health Status - General health condition (%)
Current Health Status - Blood donors (%)
Current Health Status - Has blood ever tested for HIV virus (%)
Current Health Status - Left-handed people (%)
Dermatology - People using sunscreen (%)
Diabetes - Diabetics (%)
Diabetes - Had a blood test for high blood sugar (%)
Diabetes - People taking insulin (%)
Diet Behavior & Nutrition - Diet health (%)
Diet Behavior & Nutrition - Milk product consumption (# of products/month)
Diet Behavior & Nutrition - Meals not home prepared (#/week)
Diet Behavior & Nutrition - Meals from fast food or pizza place (#/week)
Diet Behavior & Nutrition - Ready-to-eat foods (#/month)
Diet Behavior & Nutrition - Frozen meals/pizza (#/month)
Drug Use - People that ever used marijuana or hashish (%)
Drug Use - Ever used hard drugs (%)
Drug Use - Ever used any form of cocaine (%)
Drug Use - Ever used heroin (%)
Drug Use - Ever used methamphetamine (%)
Health Insurance - People covered by health insurance (%)
Kidney Conditions-Urology - Avg. # of times urinating at night
Medical Conditions - People with asthma (%)
Medical Conditions - People with anemia (%)
Medical Conditions - People with psoriasis (%)
Medical Conditions - People with overweight (%)
Medical Conditions - Elderly people having difficulties in thinking or remembering (%)
Medical Conditions - People who ever received blood transfusion (%)
Medical Conditions - People having trouble seeing even with glass/contacts (%)
Medical Conditions - People with arthritis (%)
Medical Conditions - People with gout (%)
Medical Conditions - People with congestive heart failure (%)
Medical Conditions - People with coronary heart disease (%)
Medical Conditions - People with angina pectoris (%)
Medical Conditions - People who ever had heart attack (%)
Medical Conditions - People who ever had stroke (%)
Medical Conditions - People with emphysema (%)
Medical Conditions - People with thyroid problem (%)
Medical Conditions - People with chronic bronchitis (%)
Medical Conditions - People with any liver condition (%)
Medical Conditions - People who ever had cancer or malignancy (%)
Mental Health - People who have little interest in doing things (%)
Mental Health - People feeling down, depressed, or hopeless (%)
Mental Health - People who have trouble sleeping or sleeping too much (%)
Mental Health - People feeling tired or having little energy (%)
Mental Health - People with poor appetite or overeating (%)
Mental Health - People feeling bad about themself (%)
Mental Health - People who have trouble concentrating on things (%)
Mental Health - People moving or speaking slowly or too fast (%)
Mental Health - People having thoughts they would be better off dead (%)
Oral Health - Average years since last visit a dentist
Oral Health - People embarrassed because of mouth (%)
Oral Health - People with gum disease (%)
Oral Health - General health of teeth and gums (%)
Oral Health - Average days a week using dental floss/device
Oral Health - Average days a week using mouthwash for dental problem
Oral Health - Average number of teeth
Pesticide Use - Households using pesticides to control insects (%)
Pesticide Use - Households using pesticides to kill weeds (%)
Physical Activity - People doing vigorous-intensity work activities (%)
Physical Activity - People doing moderate-intensity work activities (%)
Physical Activity - People walking or bicycling (%)
Physical Activity - People doing vigorous-intensity recreational activities (%)
Physical Activity - People doing moderate-intensity recreational activities (%)
Physical Activity - Average hours a day doing sedentary activities
Physical Activity - Average hours a day watching TV or videos
Physical Activity - Average hours a day using computer
Physical Functioning - People having limitations keeping them from working (%)
Physical Functioning - People limited in amount of work they can do (%)
Physical Functioning - People that need special equipment to walk (%)
Physical Functioning - People experiencing confusion/memory problems (%)
Physical Functioning - People requiring special healthcare equipment (%)
Prescription Medications - Average number of prescription medicines taking
Preventive Aspirin Use - Adults 40+ taking low-dose aspirin (%)
Reproductive Health - Vaginal deliveries (%)
Reproductive Health - Cesarean deliveries (%)
Reproductive Health - Deliveries resulted in a live birth (%)
Reproductive Health - Pregnancies resulted in a delivery (%)
Reproductive Health - Women breastfeeding newborns (%)
Reproductive Health - Women that had a hysterectomy (%)
Reproductive Health - Women that had both ovaries removed (%)
Reproductive Health - Women that have ever taken birth control pills (%)
Reproductive Health - Women taking birth control pills (%)
Reproductive Health - Women that have ever used Depo-Provera or injectables (%)
Reproductive Health - Women that have ever used female hormones (%)
Sexual Behavior - People 18+ that ever had sex (vaginal, anal, or oral) (%)
Sexual Behavior - Males 18+ that ever had vaginal sex with a woman (%)
Sexual Behavior - Males 18+ that ever performed oral sex on a woman (%)
Sexual Behavior - Males 18+ that ever had anal sex with a woman (%)
Sexual Behavior - Males 18+ that ever had any sex with a man (%)
Sexual Behavior - Females 18+ that ever had vaginal sex with a man (%)
Sexual Behavior - Females 18+ that ever performed oral sex on a man (%)
Sexual Behavior - Females 18+ that ever had anal sex with a man (%)
Sexual Behavior - Females 18+ that ever had any kind of sex with a woman (%)
Sexual Behavior - Average age people first had sex
Sexual Behavior - Average number of female sex partners in lifetime (males 18+)
Sexual Behavior - Average number of female vaginal sex partners in lifetime (males 18+)
Sexual Behavior - Average age people first performed oral sex on a woman (18+)
Sexual Behavior - Average number of woman performed oral sex on in lifetime (18+)
Sexual Behavior - Average number of male sex partners in lifetime (males 18+)
Sexual Behavior - Average number of male anal sex partners in lifetime (males 18+)
Sexual Behavior - Average age people first performed oral sex on a man (18+)
Sexual Behavior - Average number of male oral sex partners in lifetime (18+)
Sexual Behavior - People using protection when performing oral sex (%)
Sexual Behavior - Average number of times people have vaginal or anal sex a year
Sexual Behavior - People having sex without condom (%)
Sexual Behavior - Average number of male sex partners in lifetime (females 18+)
Sexual Behavior - Average number of male vaginal sex partners in lifetime (females 18+)
Sexual Behavior - Average number of female sex partners in lifetime (females 18+)
Sexual Behavior - Circumcised males 18+ (%)
Sleep Disorders - Average hours sleeping at night
Sleep Disorders - People that has trouble sleeping (%)
Smoking-Cigarette Use - People smoking cigarettes (%)
Taste & Smell - People 40+ having problems with smell (%)
Taste & Smell - People 40+ having problems with taste (%)
Taste & Smell - People 40+ that ever had wisdom teeth removed (%)
Taste & Smell - People 40+ that ever had tonsils teeth removed (%)
Taste & Smell - People 40+ that ever had a loss of consciousness because of a head injury (%)
Taste & Smell - People 40+ that ever had a broken nose or other serious injury to face or skull (%)
Taste & Smell - People 40+ that ever had two or more sinus infections (%)
Weight - Average height (inches)
Weight - Average weight (pounds)
Weight - Average BMI
Weight - People that are obese (%)
Weight - People that ever were obese (%)
Weight - People trying to lose weight (%)
100%
urban population.
Estimated median house/condo value in 2022: $430,636
28409:
$430,636North Carolina:
$280,600
According to our research of North Carolina and other state lists, there were 26 registered sex offenders living in 28409 zip code as of June 05, 2024 . The ratio of all residents to sex offenders in zip code 28409 is 1,270 to 1.The ratio of registered sex offenders to all residents in this zip code is much lower than the state average.
Median resident age: This zip code:
43.9 yearsNorth Carolina median age:
39.2 years
Average household size: This zip code:
2.4 peopleNorth Carolina:
2.4 people
Averages for the 2020 tax year for zip code 28409, filed in 2021:
Average Adjusted Gross Income (AGI) in 2020: $106,623 (Individual Income Tax Returns) Here:
$106,623State:
$70,020
Salary/wage: $84,961 (reported on 76.8% of returns )Here:
$84,961State:
$58,387
(% of AGI for various income ranges: 1152.8% for AGIs below $25k , 3657.7% for AGIs $25k-50k , 6500.8% for AGIs $50k-75k , 9408.5% for AGIs $75k-100k , 19401.6% for AGIs $100k-200k , 101490.6% for AGIs over 200k ) Taxable interest for individuals: $1,697 (reported on 43.0% of returns )This zip code:
$1,697North Carolina:
$1,479
(% of AGI for various income ranges: 23.2% for AGIs below $25k , 34.1% for AGIs $25k-50k , 68.2% for AGIs $50k-75k , 114.4% for AGIs $75k-100k , 176.3% for AGIs $100k-200k , 1246.6% for AGIs over 200k ) Ordinary dividends: $8,354 (reported on 31.8% of returns )(% of AGI for various income ranges: 55.4% for AGIs below $25k , 105.1% for AGIs $25k-50k , 203.8% for AGIs $50k-75k , 341.3% for AGIs $75k-100k , 640.4% for AGIs $100k-200k , 5085.5% for AGIs over 200k ) Net capital gain/loss in AGI: +$33,938 (reported on 29.2% of returns )Here:
+$33,938State:
+$23,652
(% of AGI for various income ranges: 23.7% for AGIs below $25k , 107.0% for AGIs $25k-50k , 175.0% for AGIs $50k-75k , 356.7% for AGIs $75k-100k , 902.5% for AGIs $100k-200k , 30533.6% for AGIs over 200k ) Profit/loss from business: +$19,505 (reported on 21.3% of returns )Here:
+$19,505State:
+$11,710
(% of AGI for various income ranges: 221.1% for AGIs below $25k , 386.2% for AGIs $25k-50k , 466.8% for AGIs $50k-75k , 476.2% for AGIs $75k-100k , 913.7% for AGIs $100k-200k , 6149.4% for AGIs over 200k ) Taxable individual retirement arrangement distribution: $22,241 (reported on 12.6% of returns )28409:
$22,241North Carolina:
$20,247
(% of AGI for various income ranges: 86.1% for AGIs below $25k , 161.8% for AGIs $25k-50k , 399.0% for AGIs $50k-75k , 566.1% for AGIs $75k-100k , 1051.2% for AGIs $100k-200k , 2656.2% for AGIs over 200k ) Self-employed (Keogh) retirement plans: $23,917 (reported on 1.1% of returns )28409:
$23,917North Carolina:
$26,749
(% of AGI for various income ranges: 22.4% for AGIs $50k-75k , 30.7% for AGIs $100k-200k , 737.2% for AGIs over 200k ) Total itemized deductions: $34,134 (reported on 13.5% of returns )Here:
$34,134State:
$34,549
(% of AGI for various income ranges: 81.0% for AGIs below $25k , 182.1% for AGIs $25k-50k , 429.3% for AGIs $50k-75k , 611.1% for AGIs $75k-100k , 1206.8% for AGIs $100k-200k , 8344.9% for AGIs over 200k ) Charity contributions: $10,940 (reported on 11.2% of returns )Here:
$10,940State:
$13,360
(% of AGI for various income ranges: 5.3% for AGIs below $25k , 17.5% for AGIs $25k-50k , 56.2% for AGIs $50k-75k , 106.5% for AGIs $75k-100k , 276.4% for AGIs $100k-200k , 2881.5% for AGIs over 200k ) Taxes paid: $8,121 (reported on 13.3% of returns )(% of AGI for various income ranges: 10.6% for AGIs below $25k , 31.1% for AGIs $25k-50k , 88.5% for AGIs $50k-75k , 152.3% for AGIs $75k-100k , 347.0% for AGIs $100k-200k , 1844.0% for AGIs over 200k ) Earned income credit: $1,932 (reported on 9.3% of returns )(% of AGI for various income ranges: 66.0% for AGIs below $25k , 54.4% for AGIs $25k-50k ) Percentage of individuals using paid preparers for their 2020 taxes: 92.1%(% for various income ranges: 89.9% for AGIs below $25k , 92.1% for AGIs $25k-50k , 92.3% for AGIs $50k-75k , 93.3% for AGIs $75k-100k , 93.0% for AGIs $100k-200k , 95.1% for AGIs over 200k )
Averages for the 2012 tax year for zip code 28409, filed in 2013:
Average Adjusted Gross Income (AGI) in 2012: $81,354 (Individual Income Tax Returns) Here:
$81,354State:
$54,937
Salary/wage: $63,800 (reported on 79.4% of returns )Here:
$63,800State:
$46,336
(% of AGI for various income ranges: 68.9% for AGIs below $25k , 69.4% for AGIs $25k-50k , 64.0% for AGIs $50k-75k , 67.2% for AGIs $75k-100k , 71.3% for AGIs $100k-200k , 50.7% for AGIs over 200k ) Taxable interest for individuals: $1,560 (reported on 46.3% of returns )This zip code:
$1,560North Carolina:
$1,298
(% of AGI for various income ranges: 1.9% for AGIs below $25k , 1.0% for AGIs $25k-50k , 1.0% for AGIs $50k-75k , 0.7% for AGIs $75k-100k , 0.7% for AGIs $100k-200k , 0.9% for AGIs over 200k ) Ordinary dividends: $6,269 (reported on 31.6% of returns )(% of AGI for various income ranges: 3.8% for AGIs below $25k , 2.0% for AGIs $25k-50k , 2.4% for AGIs $50k-75k , 2.3% for AGIs $75k-100k , 1.8% for AGIs $100k-200k , 2.9% for AGIs over 200k ) Net capital gain/loss in AGI: +$13,295 (reported on 25.7% of returns )Here:
+$13,295State:
+$12,740
(% of AGI for various income ranges: 0.4% for AGIs below $25k , 0.3% for AGIs $25k-50k , 0.5% for AGIs $50k-75k , 1.1% for AGIs $75k-100k , 1.7% for AGIs $100k-200k , 9.5% for AGIs over 200k ) Profit/loss from business: +$13,497 (reported on 20.1% of returns )Here:
+$13,497State:
+$10,311
(% of AGI for various income ranges: 10.0% for AGIs below $25k , 4.7% for AGIs $25k-50k , 3.6% for AGIs $50k-75k , 3.0% for AGIs $75k-100k , 3.9% for AGIs $100k-200k , 1.8% for AGIs over 200k ) Taxable individual retirement arrangement distribution: $21,021 (reported on 14.8% of returns )28409:
$21,021North Carolina:
$15,575
(% of AGI for various income ranges: 4.4% for AGIs below $25k , 3.4% for AGIs $25k-50k , 3.9% for AGIs $50k-75k , 4.5% for AGIs $75k-100k , 3.5% for AGIs $100k-200k , 3.8% for AGIs over 200k ) Self-employment retirement plans: $22,694 (reported on 1.1% of returns )28409:
$22,694North Carolina:
$21,078
(% of AGI for various income ranges: 0.2% for AGIs $25k-50k , 0.3% for AGIs $100k-200k , 0.6% for AGIs over 200k ) Total itemized deductions: $27,541 (20% of AGI, reported on 48.6% of returns )Here:
$27,541State:
$23,438
Here:
20.4% of AGIState:
21.5% of AGI
(% of AGI for various income ranges: 16.7% for AGIs below $25k , 16.1% for AGIs $25k-50k , 17.7% for AGIs $50k-75k , 17.1% for AGIs $75k-100k , 17.9% for AGIs $100k-200k , 14.8% for AGIs over 200k ) Charity contributions: $4,127 (reported on 41.5% of returns )(% of AGI for various income ranges: 1.2% for AGIs below $25k , 1.6% for AGIs $25k-50k , 2.1% for AGIs $50k-75k , 2.2% for AGIs $75k-100k , 2.5% for AGIs $100k-200k , 2.0% for AGIs over 200k ) Taxes paid: $11,636 (reported on 48.4% of returns )28409:
$11,636State:
$8,823
(% of AGI for various income ranges: 2.9% for AGIs below $25k , 3.8% for AGIs $25k-50k , 4.9% for AGIs $50k-75k , 5.7% for AGIs $75k-100k , 7.2% for AGIs $100k-200k , 8.9% for AGIs over 200k ) Earned income credit: $1,959 (reported on 11.3% of returns )(% of AGI for various income ranges: 4.4% for AGIs below $25k , 0.8% for AGIs $25k-50k ) Percentage of individuals using paid preparers for their 2012 taxes: 52.0%(% for various income ranges: 45.0% for AGIs below $25k , 49.8% for AGIs $25k-50k , 53.8% for AGIs $50k-75k , 53.2% for AGIs $75k-100k , 56.2% for AGIs $100k-200k , 78.2% for AGIs over 200k )
Averages for the 2004 tax year for zip code 28409, filed in 2005:
Average Adjusted Gross Income (AGI) in 2004: $64,194 (Individual Income Tax Returns) Here:
$64,194State:
$45,376
Salary/wage: $51,716 (reported on 81.1% of returns )Here:
$51,716State:
$39,442
(% of AGI for various income ranges: 340.6% for AGIs below $10k , 69.2% for AGIs $10k-25k , 70.3% for AGIs $25k-50k , 72.0% for AGIs $50k-75k , 73.3% for AGIs $75k-100k , 58.0% for AGIs over 100k ) Taxable interest for individuals: $1,542 (reported on 54.8% of returns )This zip code:
$1,542North Carolina:
$1,515
(% of AGI for various income ranges: 19.7% for AGIs below $10k , 2.8% for AGIs $10k-25k , 1.8% for AGIs $25k-50k , 1.2% for AGIs $50k-75k , 1.0% for AGIs $75k-100k , 1.1% for AGIs over 100k ) Taxable dividends: $4,271 (reported on 36.6% of returns )(% of AGI for various income ranges: 35.7% for AGIs below $10k , 2.7% for AGIs $10k-25k , 2.1% for AGIs $25k-50k , 1.8% for AGIs $50k-75k , 1.7% for AGIs $75k-100k , 2.6% for AGIs over 100k ) Net capital gain/loss: +$13,322 (reported on 30.8% of returns )Here:
+$13,322State:
+$11,152
(% of AGI for various income ranges: -20.9% for AGIs below $10k , 0.3% for AGIs $10k-25k , 1.0% for AGIs $25k-50k , 1.6% for AGIs $50k-75k , 2.4% for AGIs $75k-100k , 10.6% for AGIs over 100k ) Profit/loss from business: +$16,414 (reported on 19.7% of returns )Here:
+$16,414State:
+$9,490
(% of AGI for various income ranges: -2.7% for AGIs below $10k , 7.3% for AGIs $10k-25k , 5.5% for AGIs $25k-50k , 4.8% for AGIs $50k-75k , 4.5% for AGIs $75k-100k , 5.1% for AGIs over 100k ) Profit/loss from farming: +$192 (reported on 0.2% of returns )
Here : State :
IRA payment deduction: $3,188 (reported on 3.8% of returns )28409:
$3,188North Carolina:
$2,967
(% of AGI for various income ranges: 1.5% for AGIs below $10k , 0.3% for AGIs $10k-25k , 0.3% for AGIs $25k-50k , 0.3% for AGIs $50k-75k , 0.2% for AGIs $75k-100k , 0.1% for AGIs over 100k ) Self-employed pension: $18,557 (reported on 1.8% of returns )Here:
$18,557North Carolina:
$14,754
(% of AGI for various income ranges: 0.1% for AGIs $25k-50k , 0.3% for AGIs $50k-75k , 0.3% for AGIs $75k-100k , 0.8% for AGIs over 100k ) Total itemized deductions: $21,928 (21% of AGI, reported on 51.8% of returns )Here:
$21,928State:
$19,464
Here:
21.0% of AGIState:
22.7% of AGI
(% of AGI for various income ranges: 62.5% for AGIs below $10k , 17.7% for AGIs $10k-25k , 20.1% for AGIs $25k-50k , 20.6% for AGIs $50k-75k , 20.3% for AGIs $75k-100k , 15.4% for AGIs over 100k ) Charity contributions deductions: $3,435 (3% of AGI, reported on 46.8% of returns )Here:
3.2% of AGIState:
4.5% of AGI
(% of AGI for various income ranges: 2.9% for AGIs below $10k , 1.8% for AGIs $10k-25k , 2.2% for AGIs $25k-50k , 2.5% for AGIs $50k-75k , 2.7% for AGIs $75k-100k , 2.6% for AGIs over 100k ) Total tax: $11,519 (reported on 78.5% of returns )28409:
$11,519State:
$7,257
(% of AGI for various income ranges: 10.5% for AGIs below $10k , 4.4% for AGIs $10k-25k , 6.9% for AGIs $25k-50k , 8.7% for AGIs $50k-75k , 10.1% for AGIs $75k-100k , 19.0% for AGIs over 100k ) Earned income credit: $1,659 (reported on 8.8% of returns )Percentage of individuals using paid preparers for their 2004 taxes: 56.4%(% for various income ranges: 48.0% for AGIs below $10k , 56.9% for AGIs $10k-25k , 57.8% for AGIs $25k-50k , 58.1% for AGIs $50k-75k , 54.6% for AGIs $75k-100k , 64.0% for AGIs over 100k )
Estimated median household income in 2022: This zip code:
$103,788North Carolina:
$67,481
Nearest zip codes: 28412 ,
28403 ,
28480 ,
28405 ,
28428 ,
28401 .
Wilmington Zip Code Map
Percentage of family households: This zip code:
49.5%North Carolina:
46.1%
Percentage of households with unmarried partners: This zip code:
4.2%North Carolina:
47.9%
Likely homosexual households (counted as self-reported same-sex unmarried-partner households)
Lesbian couples: 0.2% of all households Gay men: 0.1% of all households
Household received Food Stamps/SNAP in the past 12 months: 400Household did not receive Food Stamps/SNAP in the past 12 months: 13,823
Women who had a birth in the past 12 months: 237 (244 now married , 0 unmarried) Women who did not have a birth in the past 12 months: 7,586 (4,390 now married , 3,219 unmarried)
Housing units in zip code 28409 with a mortgage: 7,947 (1,000
second mortgage , 37
home equity loan , 861
both second mortgage and home equity loan )
Houses without a mortgage: 107
Median monthly owner costs for units with a mortgage: $1,961
Median monthly owner costs for units without a mortgage: $626
Residents with income below the poverty level in 2022:
This zip code:
3.8%Whole state:
12.8%
Residents with income below 50% of the poverty level in 2022:
This zip code:
1.4%Whole state:
6.8%
Median number of rooms in houses and condos: Median number of rooms in apartments: Notable locations in this zip code not listed on our city pages
Click to draw/clear zip code borders Notable locations in zip code 28409: (A) , New Hanover County Public Library - Myrtle Grove Branch (B) . Display/hide their locations on the map
Shopping Center: (1) . Display/hide its location on the map
Churches in zip code 28409 include: (A) , First Wesleyan Church of Wilmington (B) , Korean Presbyterian Church (C) , Masonboro Church (D) , Zion Chapel (E) , Shiloh Church (F) , Sanctuary Church of Wilmington (G) , Oleander United Methodist Church (H) , Harbor United Methodist Church (I) . Display/hide their locations on the map
Cemeteries: (1) , Oleander Memorial Gardens (2) . Display/hide their locations on the map
Creeks: (A) , Whiskey Creek (B) , Hewletts Creek (C) . Display/hide their locations on the map
Park in zip code 28409: (1) . Display/hide its location on the map
Year house built (houses)
156 2020 or later2,412 2010 to 20192,302 2000 to 20093,022 1990 to 19992,854 1980 to 19892,099 1970 to 19791,209 1960 to 1969263 1950 to 1959147 1940 to 194998 1939 or earlier
Zip code 28409 household income distribution in 2022 480 Less than $10,000240 $10,000 to $14,999410 $15,000 to $19,999383 $20,000 to $24,999326 $25,000 to $29,999206 $30,000 to $34,999359 $35,000 to $39,999387 $40,000 to $44,999454 $45,000 to $49,999937 $50,000 to $59,9991,304 $60,000 to $74,9991,587 $75,000 to $99,9991,842 $100,000 to $124,9991,207 $125,000 to $149,9991,883 $150,000 to $199,9992,476 $200,000 or moreEstimate of home value of owner-occupied houses/condos in 2022 in zip code 28409 66 $10,000 to $14,99915 $15,000 to $19,9998 $20,000 to $24,9997 $25,000 to $29,99919 $30,000 to $34,99945 $35,000 to $39,99928 $60,000 to $69,99944 $80,000 to $89,99913 $90,000 to $99,99990 $100,000 to $124,99975 $125,000 to $149,999199 $150,000 to $174,999397 $175,000 to $199,999866 $200,000 to $249,9991,909 $250,000 to $299,9993,509 $300,000 to $399,9992,675 $400,000 to $499,9992,018 $500,000 to $749,999833 $750,000 to $999,999555 $1,000,000 to $1,499,999137 $1,500,000 to $1,999,99973 $2,000,000 or moreRent paid by renters in 2022 in zip code 28409 18 Less than $100261 $300 to $34938 $450 to $49912 $500 to $54943 $600 to $64951 $650 to $69943 $700 to $74944 $750 to $79932 $800 to $899204 $900 to $999410 $1,000 to $1,249311 $1,250 to $1,499669 $1,500 to $1,999121 $2,000 to $2,49956 $2,500 to $2,99916 $3,000 to $3,49925 $3,500 or more273 No cash rent
Median gross rent in 2022: $1,430.
Median price asked for vacant for-sale houses and condos in 2022: $251,310.
Estimated median house (or condo) value in 2022 for: White Non-Hispanic householders: $448,919Black or African American householders: $377,693American Indian or Alaska Native householders: $231,964Asian householders: $487,944Some other race householders: $134,812Two or more races householders: $328,025Hispanic or Latino householders: $426,542Estimated median house or condo value in 2022: $430,636
28409:
$430,636North Carolina:
$280,600
Lower value quartile - upper value quartile: $316,383 - $561,822
Mean price in 2022: Detached houses: $505,317Here:
$505,317State:
$375,326
Townhouses or other attached units: $398,165Here:
$398,165State:
$317,935
In 2-unit structures: $372,358Here:
$372,358State:
$250,488
In 3-to-4-unit structures: $84,014Here:
$84,014State:
$254,939
In 5-or-more-unit structures: $185,546Here:
$185,546State:
$329,290
Mobile homes: $73,949Here:
$73,949State:
$124,933
Housing units in structures:
One, detached: 13,347One, attached: 615Two: 813 or 4: 1885 to 9: 12820 to 49: 950 or more: 298Mobile homes: 292Unemployment : 2.7%
Means of transportation to work in zip code 28409 75.0% 12,941 Drove a car alone5.1% 885 Carpooled0.0% 7 Taxi0.3% 44 Walked0.2% 27 Other means20.4% 3,527 Worked at homeTravel time to work (commute) in zip code 28409 523 Less than 5 minutes1,228 5 to 9 minutes2,054 10 to 14 minutes3,497 15 to 19 minutes2,940 20 to 24 minutes758 25 to 29 minutes1,602 30 to 34 minutes94 35 to 39 minutes126 40 to 44 minutes377 45 to 59 minutes522 60 to 89 minutes189 90 or more minutes
Percentage of zip code residents living and working in this county: 93.8%
Household type by relationship:
Households: 35,148
Male householders: 7,410 (1,393 living alone ), Female householders: 6,946 (2,015 living alone )8,993 spouses (8,916 opposite-sex spouses ), 775 unmarried partners , (698 opposite-sex unmarried partners ), 9,834 children (9,232 natural , 212 adopted , 390 stepchildren ), 339 grandchildren , 102 brothers or sisters , 170 parents , 17 foster children , 143 other relatives , 545 non-relatives In group quarters: 43 (-1 institutionalized population )
Size of family households: 4,755 2-persons , 2,384 3-persons , 1,936 4-persons , 878 5-persons , 142 6-persons , 19 7-or-more-persons
Size of nonfamily households: 3,407 1-person , 809 2-persons , 28 3-persons
6,541 married couples with children. single-parent households (236 men , 680 women ).
95.6% of residents of 28409 zip code speak English at home. of residents speak Spanish at home (64% very well, 30% well, 5% not well ).of residents speak other Indo-European language at home (75% very well, 14% well, 11% not well ).of residents speak Asian or Pacific Island language at home (74% very well, 4% well, 6% not well, 16% not at all ).of residents speak other language at home (67% very well, 33% well ).
Foreign born population: 1,262 (3.6%)
(61.3%
of them are naturalized citizens )
This zip code:
3.6%Whole state:
8.6%
16% Brazil 12% Sweden 7% Serbia 6% Costa Rica 6% United Kingdom, excluding England and Scotland 4% Malaysia 4% France 23% English 9% American 9% Irish 9% German 7% European 4% Polish 4% Italian
Year of entry for the foreign-born population
431 2010 or later 272 2000 to 2009 256 1990 to 1999 587 Before 1990
There are
51 Medical Specialists in Zip Code 28409 .
Facilities with environmental interests located in this zip code:
BRADLEY CREEK ELEMENTARY (6211 GREENVILLE LOOP in WILMINGTON, NC)
(National Center for Education Statistics) - STATE ID-304 Organizations: NEW HANOVER COUNTY SCHOOLS (SCHOOL DISTRICT)
DEUTSCH FACILITY (2021 GARDNER DR in WILMINGTON, NC)
(Resource Conservation and Recovery Act (tracking hazardous waste)) Organizations: DEUTSCH A L (CONTACT/OWNER)
Housing units lacking complete plumbing facilities: 0.5%
Housing units lacking complete kitchen facilities: 1.7%
88.9% Electricity 5.7% Utility gas 3.7% Bottled, tank, or LP gas 0.7% No fuel used 0.5% Fuel oil, kerosene, etc.
Population in 1990: 17,418. Population change in the 1990s: +8,958 (+51.4%).
Place of birth for U.S.-born residents:
This state: 15,870Northeast: 6,265Midwest: 3,756South: 5,838West: 1,981
53% of the 28409 zip code residents lived in the same house 5 years ago.
Out of people who lived in different houses, 48% lived in this county.
Out of people who lived in different counties, 50% lived in North Carolina.
90% of the 28409 zip code residents lived in the same house 1 year ago.
Out of people who lived in different houses, 49% moved from this county.
Out of people who lived in different houses, 18% moved from different county within same state.
Out of people who lived in different houses, 29% moved from different state.
Out of people who lived in different houses, 3% moved from abroad.
Private vs. public school enrollment:
Students in private schools in grades 1 to 8 (elementary and middle school): 805
Here:
25.1%North Carolina:
13.8%
Students in private schools in grades 9 to 12 (high school): 205
Here:
9.3%North Carolina:
11.9%
Students in private undergraduate colleges: 29
Here:
2.4%North Carolina:
19.3%
Occupation by median earnings in the past 12 months ($)
110,554 Health diagnosing and treating practitioners and other technical occupations 103,383 Architecture and engineering occupations 96,627 Management occupations 91,700 Legal occupations 73,653 Life, physical, and social science occupations 69,470 Computer and mathematical occupations
Companies with federal contracts located in this zip code (WILMINGTON, NC):
C JOHN BUCCINI (118 BRAXLO LANE; small business) in 2 contracts from 2001 to 2006
$29,903 with Navy for Miscellaneous Electrical and Electronic Components. Signed on 2006-01-24. Completion date: 2006-04-16.
with NASA for Optical Instruments, Test Equipment, Components and Accessories. Signed on 2001-05-15. Completion date: 2001-06-15.
DAVID M DUMOND (225 CHEYENNE TRAIL; small business) in 2 contracts from 2000 to 2001
$40,462 with Navy for Other Architect and Engineering Services. Signed on 2000-08-22. Completion date: 2001-09-15.
with Navy for Land Surveys, Cadastral Services (non-construction). Signed on 2001-08-29. Completion date: 2002-03-25.
PAUL R. FISHER (817 BERWYN DR.; small business)
$46,003 with Army for Geophysical Studies. Signed on 2000-09-20. Completion date: 2001-02-01.
MARTIN'S MECHANICAL SERVICES L (7201 ORCHARD TRACE) in 3 contracts from 2004 to 2005
$10,553 with Army for Miscellaneous Ship and Marine Equipment. Signed on 2004-08-12. Completion date: 2004-07-23.
with U.S. Army Corps of Engineers - civil program financing only for Miscellaneous Ship and Marine Equipment. Signed on 2005-04-14. Completion date: 2005-04-30.
with Army for Miscellaneous Ship and Marine Equipment. Signed on 2005-04-14. Completion date: 2005-04-30.
WILMINGTON HYDRAULICS & PROP S (325 FOREST PARK ROAD; small business) in 2 contracts in 2002
$4,000 with Army for Modification of Equipment -- Special Industry Machinery. Signed on 2002-05-02. Completion date: 2002-05-20.
with Army for Maintenance, Repair and Rebuilding of Equipment -- Materials Handling Equipment. Signed on 2002-03-13. Completion date: 2002-01-15.
JAMES L APPLE RABBI (4200 STRATTON VILLAGE LN; small business)
$4,500 with Navy for Chaplain Services. Signed on 2004-11-07. Completion date: 2005-09-30.
RED WING AEROBATICS INC (140 INLET POINT DR; small business)
$2,000 with Air Force for Other Professional Services. Taking place in SC. Signed on 2006-03-29. Completion date: 2006-04-08.
Top industries in this zip code by the number of employees in 2005:
Health Care and Social Assistance: Child Day Care Services (50-99 employees: 1 establishment, 20-49 employees: 2 establishments)Construction: New Single-Family Housing Construction (except Operative Builders) (10-19: 2, 5-9: 7, 1-4: 27)Construction: Painting and Wall Covering Contractors (20-49: 2, 10-19: 2, 5-9: 1, 1-4: 8)Health Care and Social Assistance: Residential Mental Retardation Facilities (20-49: 2, 10-19: 1, 1-4: 1)Other Services (except Public Administration): Religious Organizations (20-49: 2, 1-4: 5)Construction: Electrical Contractors (10-19: 3, 5-9: 2, 1-4: 8)Educational Services: Elementary and Secondary Schools (50-99: 1)Construction: Plumbing, Heating, and Air-Conditioning Contractors (20-49: 1, 5-9: 2, 1-4: 10)Health Care and Social Assistance: Homes for the Elderly (20-49: 2)
People in group quarters in 2010:
101 people in nursing facilities/skilled-nursing facilities
15 people in group homes intended for adults
People in group quarters in 2000:
4 people in other noninstitutional group quarters
Fatal accident statistics in 2014:
Fatal accident count: 2Vehicles involved in fatal accidents: 4Fatal accidents caused by drunken drivers: 0Fatalities: 2Persons involved in fatal accidents: 8Pedestrians involved in fatal accidents: 1
Fatal accident statistics in 2013:
Fatal accident count: 1Vehicles involved in fatal accidents: 1Fatal accidents caused by drunken drivers: 1Fatalities: 1Persons involved in fatal accidents: 1Pedestrians involved in fatal accidents: 0
Home Mortgage Disclosure Act Aggregated Statistics For Year 2009(Based on 2 full and 18 partial tracts) A) FHA, FSA/RHS & VA B) Conventional C) Refinancings D) Home Improvement Loans E) Loans on Dwellings For 5+ Families F) Non-occupant Loans on G) Loans On Manufactured Number Average Value Number Average Value Number Average Value Number Average Value Number Average Value Number Average Value Number Average Value
LOANS ORIGINATED 161 $194,990 343 $279,395 2,309 $236,745 87 $167,938 1 $1,001,550 259 $357,516 19 $134,611 APPLICATIONS APPROVED, NOT ACCEPTED 5 $154,708 27 $297,373 177 $235,928 15 $150,423 1 $134,690 26 $263,670 4 $43,055 APPLICATIONS DENIED 16 $205,759 47 $311,691 586 $262,267 41 $67,360 0 $0 65 $371,497 17 $80,941 APPLICATIONS WITHDRAWN 18 $196,754 37 $404,335 368 $254,245 20 $129,914 0 $0 34 $322,429 5 $97,574 FILES CLOSED FOR INCOMPLETENESS 5 $239,302 16 $518,077 136 $257,032 6 $149,787 0 $0 13 $587,461 0 $0
Aggregated Statistics For Year 2008(Based on 2 full and 18 partial tracts) A) FHA, FSA/RHS & VA B) Conventional C) Refinancings D) Home Improvement Loans E) Loans on Dwellings For 5+ Families F) Non-occupant Loans on G) Loans On Manufactured Number Average Value Number Average Value Number Average Value Number Average Value Number Average Value Number Average Value Number Average Value
LOANS ORIGINATED 98 $204,691 644 $285,045 1,502 $249,917 96 $120,618 1 $16,742,180 298 $312,640 24 $118,574 APPLICATIONS APPROVED, NOT ACCEPTED 1 $222,570 55 $268,144 168 $240,979 22 $59,134 0 $0 23 $349,618 4 $90,122 APPLICATIONS DENIED 27 $209,568 97 $289,866 494 $255,037 86 $91,979 0 $0 71 $316,690 13 $91,247 APPLICATIONS WITHDRAWN 15 $202,485 83 $293,903 269 $252,095 17 $247,573 0 $0 47 $263,125 5 $110,154 FILES CLOSED FOR INCOMPLETENESS 2 $143,540 29 $448,114 73 $408,807 6 $45,865 0 $0 7 $1,080,600 0 $0
Aggregated Statistics For Year 2007(Based on 2 full and 18 partial tracts) A) FHA, FSA/RHS & VA B) Conventional C) Refinancings D) Home Improvement Loans E) Loans on Dwellings For 5+ Families F) Non-occupant Loans on G) Loans On Manufactured Number Average Value Number Average Value Number Average Value Number Average Value Number Average Value Number Average Value Number Average Value
LOANS ORIGINATED 38 $223,183 1,097 $262,420 1,667 $246,779 200 $136,010 2 $113,940 492 $332,703 35 $91,747 APPLICATIONS APPROVED, NOT ACCEPTED 3 $322,080 123 $260,685 209 $241,779 46 $74,435 0 $0 48 $333,040 8 $94,645 APPLICATIONS DENIED 8 $166,742 154 $204,911 563 $253,483 103 $91,788 0 $0 66 $361,353 24 $63,023 APPLICATIONS WITHDRAWN 10 $204,709 82 $228,665 277 $266,016 26 $111,635 0 $0 34 $314,559 2 $130,235 FILES CLOSED FOR INCOMPLETENESS 2 $221,760 27 $296,367 122 $262,889 3 $336,353 0 $0 15 $235,747 2 $89,105
Aggregated Statistics For Year 2006(Based on 2 full and 18 partial tracts) A) FHA, FSA/RHS & VA B) Conventional C) Refinancings D) Home Improvement Loans F) Non-occupant Loans on G) Loans On Manufactured Number Average Value Number Average Value Number Average Value Number Average Value Number Average Value Number Average Value
LOANS ORIGINATED 32 $202,627 1,637 $235,510 1,776 $247,617 219 $117,165 598 $313,846 38 $120,546 APPLICATIONS APPROVED, NOT ACCEPTED 1 $224,990 163 $207,844 204 $209,770 37 $77,360 49 $330,973 11 $55,387 APPLICATIONS DENIED 7 $181,627 262 $206,197 493 $202,363 97 $74,598 94 $285,289 28 $88,212 APPLICATIONS WITHDRAWN 6 $205,367 140 $263,150 303 $210,954 34 $97,742 59 $289,118 2 $81,850 FILES CLOSED FOR INCOMPLETENESS 1 $173,380 39 $211,833 103 $199,873 2 $120,425 13 $227,318 0 $0
Aggregated Statistics For Year 2005(Based on 2 full and 18 partial tracts) A) FHA, FSA/RHS & VA B) Conventional C) Refinancings D) Home Improvement Loans E) Loans on Dwellings For 5+ Families F) Non-occupant Loans on G) Loans On Manufactured Number Average Value Number Average Value Number Average Value Number Average Value Number Average Value Number Average Value Number Average Value
LOANS ORIGINATED 63 $154,892 2,136 $209,185 1,834 $220,291 181 $113,331 2 $356,465 790 $248,626 41 $82,676 APPLICATIONS APPROVED, NOT ACCEPTED 2 $122,575 173 $205,729 200 $179,388 28 $73,476 0 $0 47 $269,701 11 $63,384 APPLICATIONS DENIED 4 $130,902 256 $213,940 517 $177,825 86 $79,487 0 $0 97 $234,680 31 $80,270 APPLICATIONS WITHDRAWN 4 $161,975 202 $210,465 327 $190,635 26 $95,967 0 $0 72 $248,535 6 $106,445 FILES CLOSED FOR INCOMPLETENESS 0 $0 43 $269,064 165 $216,640 7 $190,830 0 $0 9 $394,884 2 $88,705
Aggregated Statistics For Year 2004(Based on 2 full and 18 partial tracts) A) FHA, FSA/RHS & VA B) Conventional C) Refinancings D) Home Improvement Loans E) Loans on Dwellings For 5+ Families F) Non-occupant Loans on G) Loans On Manufactured Number Average Value Number Average Value Number Average Value Number Average Value Number Average Value Number Average Value Number Average Value
LOANS ORIGINATED 56 $149,322 1,651 $203,473 1,497 $192,806 102 $104,606 1 $1,146,250 534 $231,068 26 $66,968 APPLICATIONS APPROVED, NOT ACCEPTED 2 $96,695 151 $176,449 154 $167,906 22 $52,056 0 $0 50 $246,423 21 $39,378 APPLICATIONS DENIED 12 $135,081 194 $167,228 477 $181,271 64 $64,078 0 $0 77 $232,404 37 $64,971 APPLICATIONS WITHDRAWN 5 $103,696 148 $198,519 366 $192,972 18 $79,383 0 $0 52 $229,991 16 $88,302 FILES CLOSED FOR INCOMPLETENESS 0 $0 52 $216,787 95 $166,609 2 $20,160 0 $0 10 $118,419 2 $22,580
Aggregated Statistics For Year 2003(Based on 2 full and 18 partial tracts) A) FHA, FSA/RHS & VA B) Conventional C) Refinancings D) Home Improvement Loans E) Loans on Dwellings For 5+ Families F) Non-occupant Loans on Number Average Value Number Average Value Number Average Value Number Average Value Number Average Value Number Average Value
LOANS ORIGINATED 72 $130,543 1,464 $184,034 3,892 $178,578 46 $44,854 1 $549,760 679 $223,723 APPLICATIONS APPROVED, NOT ACCEPTED 4 $127,068 119 $199,515 330 $160,626 17 $47,764 0 $0 53 $236,716 APPLICATIONS DENIED 9 $120,599 117 $142,575 705 $166,522 59 $39,575 0 $0 75 $195,393 APPLICATIONS WITHDRAWN 4 $102,180 132 $203,245 447 $175,379 7 $35,460 0 $0 63 $241,409 FILES CLOSED FOR INCOMPLETENESS 2 $148,780 47 $174,444 104 $243,746 0 $0 0 $0 14 $188,826
Aggregated Statistics For Year 2002(Based on 16 partial tracts) A) FHA, FSA/RHS & VA B) Conventional C) Refinancings D) Home Improvement Loans E) Loans on Dwellings For 5+ Families F) Non-occupant Loans on Number Average Value Number Average Value Number Average Value Number Average Value Number Average Value Number Average Value
LOANS ORIGINATED 49 $119,538 545 $203,029 1,351 $218,485 19 $58,435 1 $7,118,970 307 $266,820 APPLICATIONS APPROVED, NOT ACCEPTED 2 $137,490 42 $137,450 129 $182,148 6 $95,148 0 $0 19 $222,645 APPLICATIONS DENIED 9 $98,198 95 $138,782 238 $224,352 10 $20,324 0 $0 30 $235,835 APPLICATIONS WITHDRAWN 5 $84,074 50 $150,679 180 $200,358 3 $238,633 0 $0 19 $234,500 FILES CLOSED FOR INCOMPLETENESS 0 $0 13 $131,498 64 $228,002 0 $0 0 $0 10 $325,359
Aggregated Statistics For Year 2001(Based on 16 partial tracts) A) FHA, FSA/RHS & VA B) Conventional C) Refinancings D) Home Improvement Loans F) Non-occupant Loans on Number Average Value Number Average Value Number Average Value Number Average Value Number Average Value
LOANS ORIGINATED 64 $128,628 511 $191,481 1,021 $205,706 44 $29,773 246 $280,336 APPLICATIONS APPROVED, NOT ACCEPTED 2 $96,365 68 $110,439 90 $185,128 6 $54,170 20 $210,586 APPLICATIONS DENIED 6 $94,205 127 $85,812 198 $149,544 18 $27,265 31 $211,597 APPLICATIONS WITHDRAWN 5 $149,252 55 $177,534 151 $183,497 4 $62,165 22 $280,256 FILES CLOSED FOR INCOMPLETENESS 0 $0 9 $184,470 35 $171,673 1 $24,190 5 $141,520
Aggregated Statistics For Year 2000(Based on 16 partial tracts) A) FHA, FSA/RHS & VA B) Conventional C) Refinancings D) Home Improvement Loans F) Non-occupant Loans on Number Average Value Number Average Value Number Average Value Number Average Value Number Average Value
LOANS ORIGINATED 51 $119,443 521 $180,471 278 $195,232 26 $46,450 138 $254,917 APPLICATIONS APPROVED, NOT ACCEPTED 12 $59,332 60 $120,187 82 $112,293 2 $10,635 12 $226,597 APPLICATIONS DENIED 30 $56,377 147 $67,076 157 $110,171 20 $36,286 12 $108,798 APPLICATIONS WITHDRAWN 8 $89,589 37 $160,985 47 $129,263 2 $28,225 8 $182,491 FILES CLOSED FOR INCOMPLETENESS 1 $79,720 11 $360,017 24 $153,250 0 $0 6 $372,555
Aggregated Statistics For Year 1999(Based on 9 partial tracts) A) FHA, FSA/RHS & VA B) Conventional C) Refinancings D) Home Improvement Loans E) Loans on Dwellings For 5+ Families F) Non-occupant Loans on Number Average Value Number Average Value Number Average Value Number Average Value Number Average Value Number Average Value
LOANS ORIGINATED 71 $113,057 616 $155,465 614 $156,096 35 $45,570 1 $226,590 149 $179,652 APPLICATIONS APPROVED, NOT ACCEPTED 3 $109,467 72 $104,252 133 $110,739 11 $24,095 0 $0 17 $107,745 APPLICATIONS DENIED 5 $102,690 176 $74,809 247 $103,005 23 $19,326 0 $0 18 $109,553 APPLICATIONS WITHDRAWN 3 $97,640 49 $135,257 136 $109,736 10 $51,214 0 $0 11 $162,005 FILES CLOSED FOR INCOMPLETENESS 0 $0 13 $167,961 39 $136,162 0 $0 0 $0 4 $163,205
Private Mortgage Insurance Companies Aggregated Statistics For Year 2009(Based on 2 full and 18 partial tracts) A) Conventional B) Refinancings C) Non-occupant Loans on Number Average Value Number Average Value Number Average Value
LOANS ORIGINATED 57 $251,457 38 $237,768 1 $203,210 APPLICATIONS APPROVED, NOT ACCEPTED 15 $264,634 19 $224,794 2 $201,125 APPLICATIONS DENIED 11 $253,310 10 $218,481 0 $0 APPLICATIONS WITHDRAWN 8 $235,181 6 $250,502 1 $183,050 FILES CLOSED FOR INCOMPLETENESS 2 $119,345 2 $418,520 1 $109,670
Aggregated Statistics For Year 2008(Based on 2 full and 18 partial tracts) A) Conventional B) Refinancings C) Non-occupant Loans on D) Loans On Manufactured Number Average Value Number Average Value Number Average Value Number Average Value
LOANS ORIGINATED 176 $223,741 71 $242,794 33 $167,302 3 $133,690 APPLICATIONS APPROVED, NOT ACCEPTED 33 $242,436 27 $263,059 4 $171,160 0 $0 APPLICATIONS DENIED 13 $186,588 9 $252,196 3 $175,770 0 $0 APPLICATIONS WITHDRAWN 9 $203,596 2 $313,285 0 $0 0 $0 FILES CLOSED FOR INCOMPLETENESS 4 $236,398 2 $339,090 1 $81,450 0 $0
Aggregated Statistics For Year 2007(Based on 2 full and 18 partial tracts) A) Conventional B) Refinancings C) Non-occupant Loans on D) Loans On Manufactured Number Average Value Number Average Value Number Average Value Number Average Value
LOANS ORIGINATED 195 $224,137 87 $235,927 31 $195,177 2 $159,265 APPLICATIONS APPROVED, NOT ACCEPTED 25 $257,830 31 $284,640 8 $403,155 0 $0 APPLICATIONS DENIED 4 $104,675 0 $0 2 $79,925 0 $0 APPLICATIONS WITHDRAWN 10 $287,317 8 $248,115 3 $161,607 0 $0 FILES CLOSED FOR INCOMPLETENESS 0 $0 2 $182,540 0 $0 0 $0
Aggregated Statistics For Year 2006(Based on 2 full and 18 partial tracts) A) Conventional B) Refinancings C) Non-occupant Loans on D) Loans On Manufactured Number Average Value Number Average Value Number Average Value Number Average Value
LOANS ORIGINATED 139 $227,909 84 $224,228 26 $202,169 2 $110,075 APPLICATIONS APPROVED, NOT ACCEPTED 24 $192,232 20 $186,317 7 $156,496 1 $80,640 APPLICATIONS DENIED 3 $309,180 4 $330,240 2 $221,045 0 $0 APPLICATIONS WITHDRAWN 9 $281,596 9 $310,283 5 $186,694 0 $0 FILES CLOSED FOR INCOMPLETENESS 1 $134,670 0 $0 0 $0 0 $0
Aggregated Statistics For Year 2005(Based on 2 full and 18 partial tracts) A) Conventional B) Refinancings C) Non-occupant Loans on D) Loans On Manufactured Number Average Value Number Average Value Number Average Value Number Average Value
LOANS ORIGINATED 202 $186,848 79 $177,316 47 $166,642 6 $111,482 APPLICATIONS APPROVED, NOT ACCEPTED 30 $246,642 19 $186,953 4 $178,012 0 $0 APPLICATIONS DENIED 1 $68,540 1 $137,090 0 $0 0 $0 APPLICATIONS WITHDRAWN 18 $187,191 4 $180,968 8 $151,840 0 $0 FILES CLOSED FOR INCOMPLETENESS 0 $0 1 $68,540 1 $68,540 0 $0
Aggregated Statistics For Year 2004(Based on 2 full and 18 partial tracts) A) Conventional B) Refinancings C) Non-occupant Loans on D) Loans On Manufactured Number Average Value Number Average Value Number Average Value Number Average Value
LOANS ORIGINATED 242 $164,071 115 $148,898 34 $131,349 2 $152,410 APPLICATIONS APPROVED, NOT ACCEPTED 59 $179,036 36 $136,168 8 $100,541 4 $69,955 APPLICATIONS DENIED 4 $480,282 6 $271,260 3 $554,647 0 $0 APPLICATIONS WITHDRAWN 19 $118,421 12 $126,202 3 $134,703 0 $0 FILES CLOSED FOR INCOMPLETENESS 3 $257,717 4 $208,192 0 $0 0 $0
Aggregated Statistics For Year 2003(Based on 2 full and 18 partial tracts) A) Conventional B) Refinancings C) Non-occupant Loans on Number Average Value Number Average Value Number Average Value
LOANS ORIGINATED 285 $164,256 378 $147,377 42 $149,434 APPLICATIONS APPROVED, NOT ACCEPTED 71 $156,972 122 $169,797 22 $127,003 APPLICATIONS DENIED 2 $143,915 14 $189,962 5 $283,856 APPLICATIONS WITHDRAWN 9 $204,819 33 $135,949 8 $100,826 FILES CLOSED FOR INCOMPLETENESS 0 $0 0 $0 0 $0
Aggregated Statistics For Year 2002(Based on 16 partial tracts) A) Conventional B) Refinancings C) Non-occupant Loans on Number Average Value Number Average Value Number Average Value
LOANS ORIGINATED 149 $149,299 158 $143,858 20 $147,525 APPLICATIONS APPROVED, NOT ACCEPTED 20 $129,212 35 $144,224 4 $106,500 APPLICATIONS DENIED 2 $67,335 0 $0 0 $0 APPLICATIONS WITHDRAWN 8 $157,116 14 $142,136 5 $147,264 FILES CLOSED FOR INCOMPLETENESS 0 $0 0 $0 0 $0
Aggregated Statistics For Year 2001(Based on 16 partial tracts) A) Conventional B) Refinancings C) Non-occupant Loans on Number Average Value Number Average Value Number Average Value
LOANS ORIGINATED 149 $146,672 122 $141,695 27 $144,435 APPLICATIONS APPROVED, NOT ACCEPTED 21 $156,431 15 $146,026 3 $189,503 APPLICATIONS DENIED 0 $0 4 $115,170 1 $119,570 APPLICATIONS WITHDRAWN 4 $216,172 2 $194,745 0 $0 FILES CLOSED FOR INCOMPLETENESS 1 $117,730 2 $166,520 0 $0
Aggregated Statistics For Year 2000(Based on 16 partial tracts) A) Conventional B) Refinancings C) Non-occupant Loans on Number Average Value Number Average Value Number Average Value
LOANS ORIGINATED 133 $144,648 28 $127,224 14 $130,703 APPLICATIONS APPROVED, NOT ACCEPTED 15 $172,837 5 $175,966 4 $85,770 APPLICATIONS DENIED 2 $212,570 2 $131,895 0 $0 APPLICATIONS WITHDRAWN 4 $107,695 4 $195,465 0 $0 FILES CLOSED FOR INCOMPLETENESS 2 $105,450 2 $91,305 2 $49,375
Aggregated Statistics For Year 1999(Based on 9 partial tracts) A) Conventional B) Refinancings C) Non-occupant Loans on Number Average Value Number Average Value Number Average Value
LOANS ORIGINATED 164 $148,905 66 $135,420 11 $143,710 APPLICATIONS APPROVED, NOT ACCEPTED 10 $130,317 14 $152,081 2 $143,360 APPLICATIONS DENIED 5 $192,618 5 $137,186 0 $0 APPLICATIONS WITHDRAWN 2 $186,295 2 $119,615 1 $74,770 FILES CLOSED FOR INCOMPLETENESS 2 $125,095 0 $0 1 $126,920
2002 - 2018 National Fire Incident Reporting System (NFIRS) incidents See full 2006 National Fire Incident Reporting System statistics for zip code 28409, North Carolina
Most common first names in zip code 28409 among deceased individuals Name Count Lived (average)
James 70 74.4 years William 69 76.2 years John 66 76.9 years Robert 61 73.4 years Mary 60 80.2 years Charles 36 74.4 years Thomas 35 73.4 years George 29 80.2 years Joseph 28 74.2 years Margaret 28 81.8 years
Most common last names in zip code 28409 among deceased individuals Last name Count Lived (average)
Smith 31 76.1 years Johnson 26 79.4 years Brown 24 74.7 years Williams 19 76.9 years Davis 18 76.4 years Wilson 13 79.0 years Jones 12 78.6 years Long 12 75.0 years Carter 11 81.0 years Farrow 11 78.8 years
Businesses in zip code 28409
FedEx: 1McDonald's: 1UPS: 2
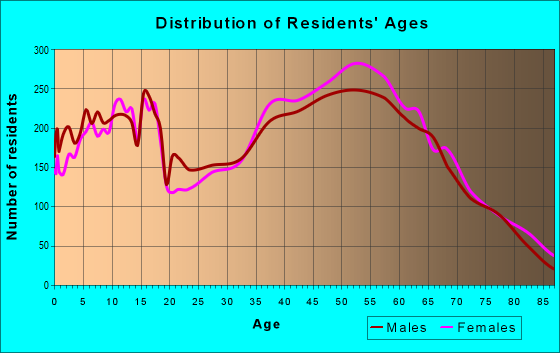
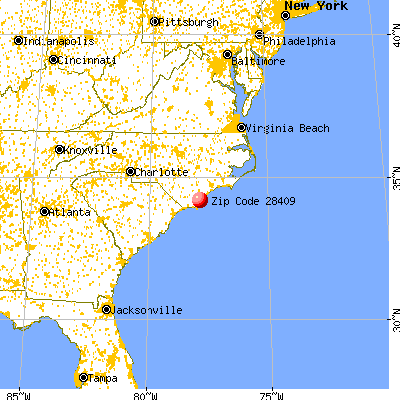


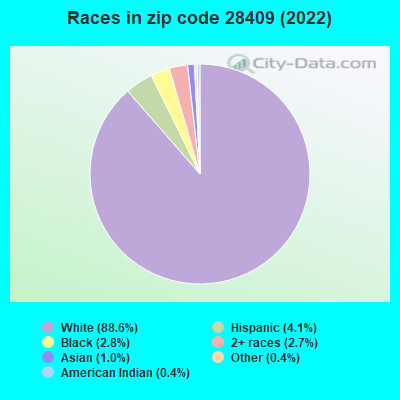


+$192
-$3,231
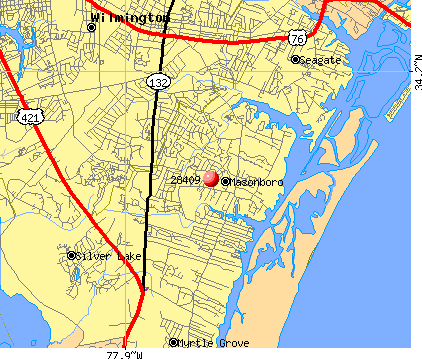 Nearest zip codes: 28412, 28403, 28480, 28405, 28428, 28401.
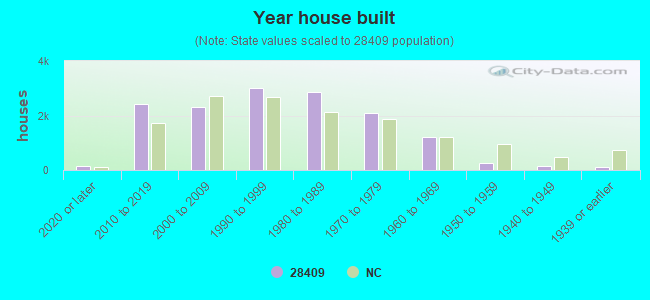
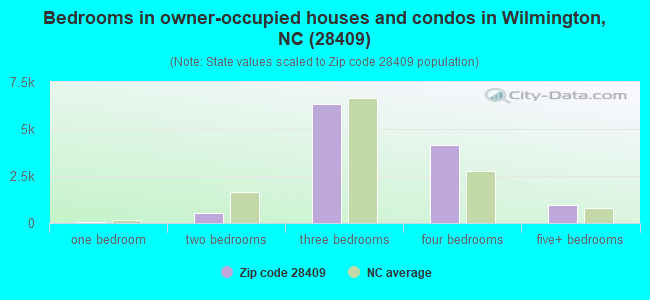
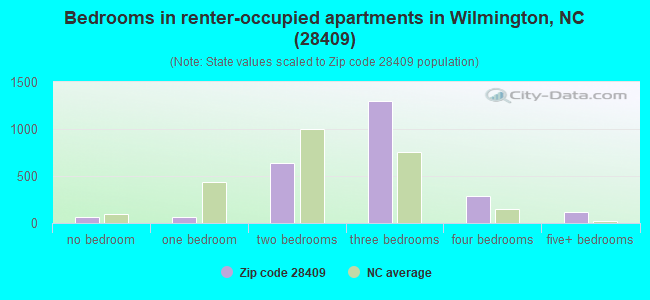
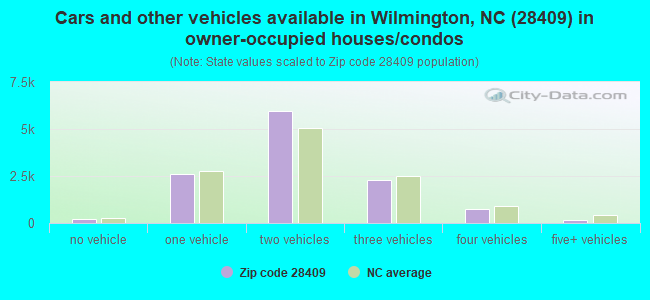
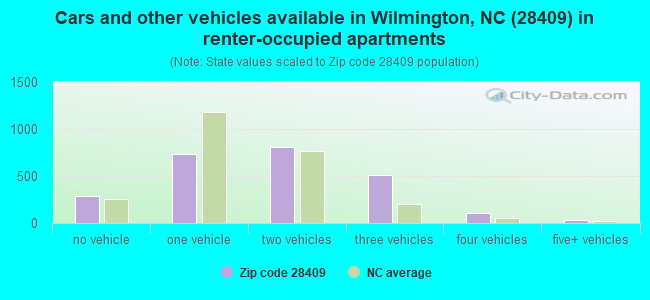


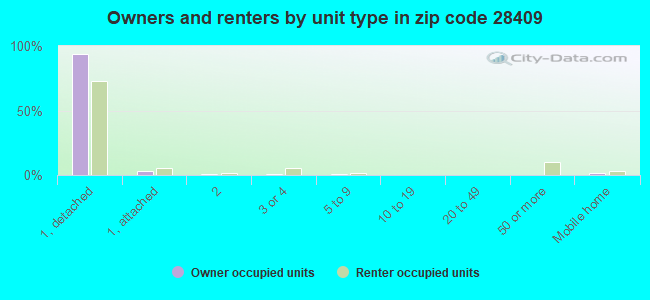
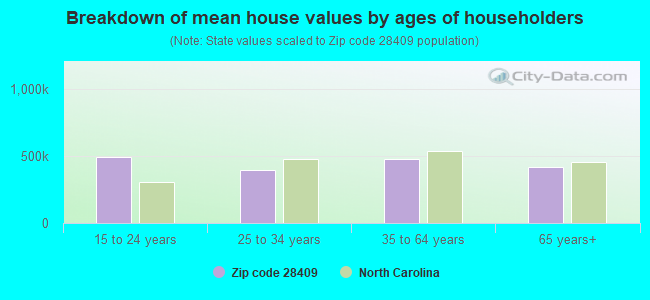


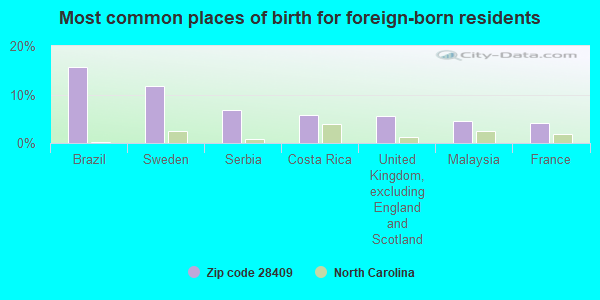
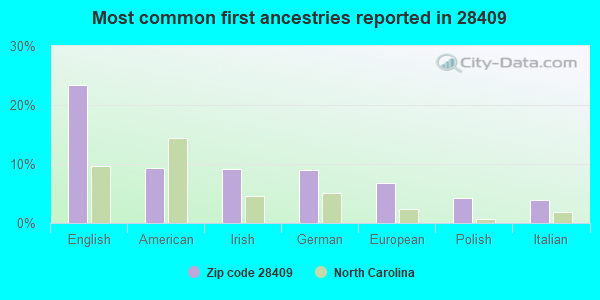
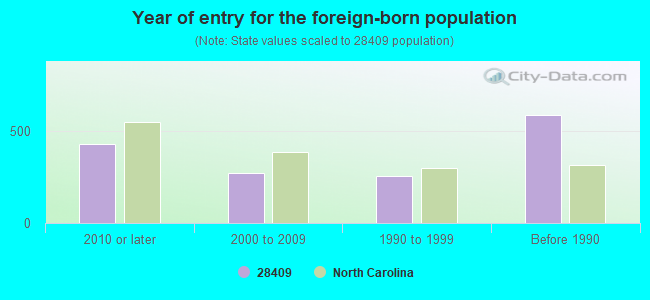

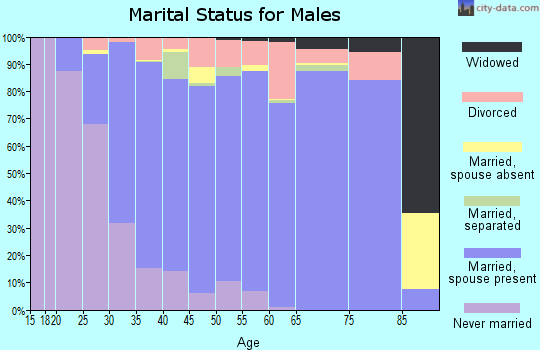
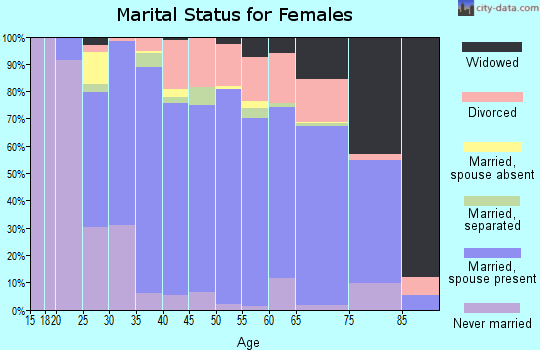
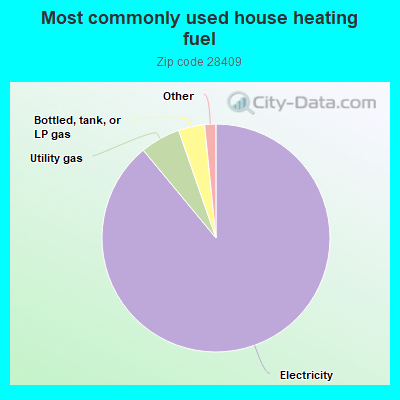
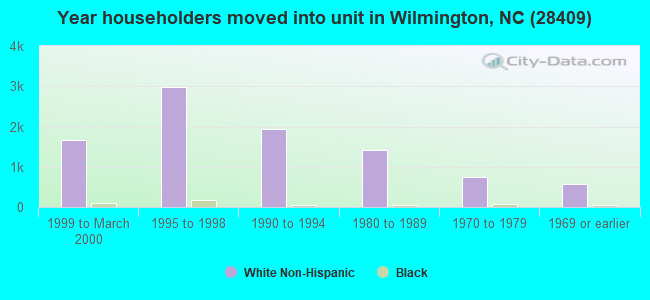
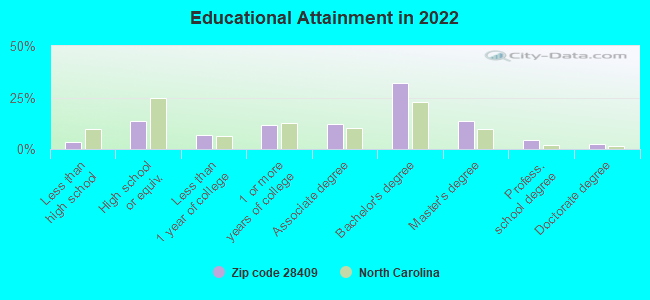
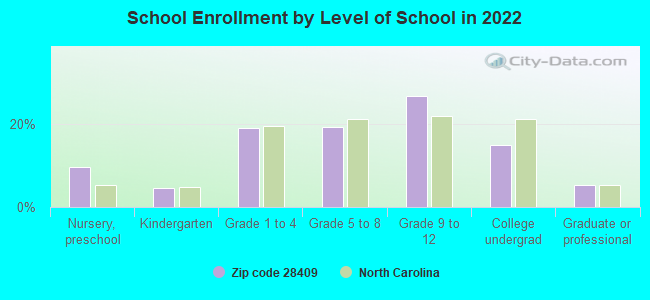
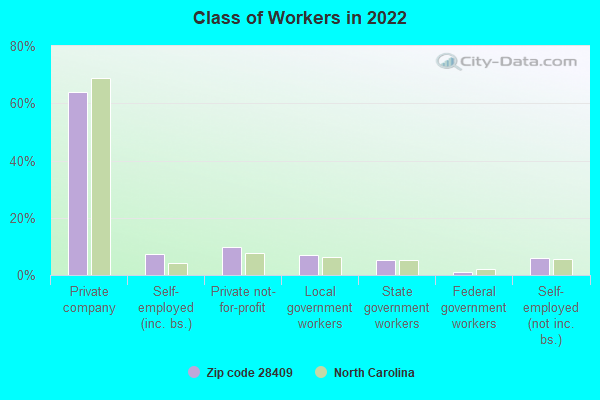
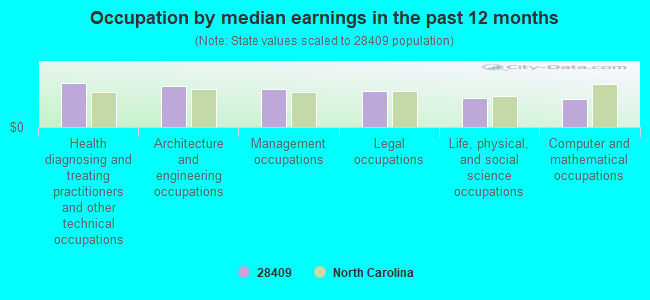
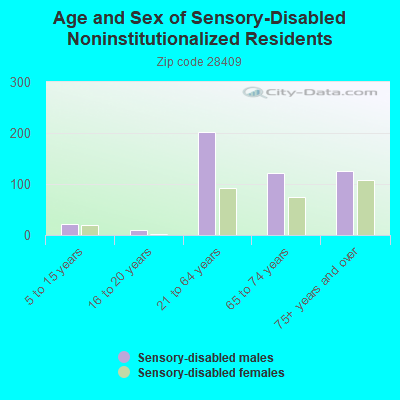
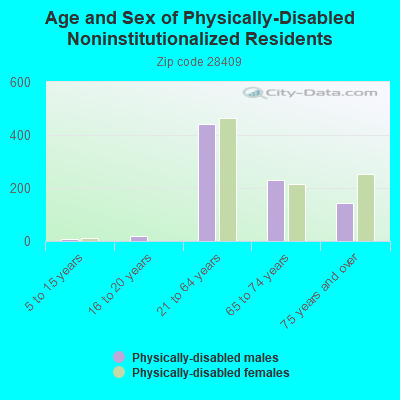
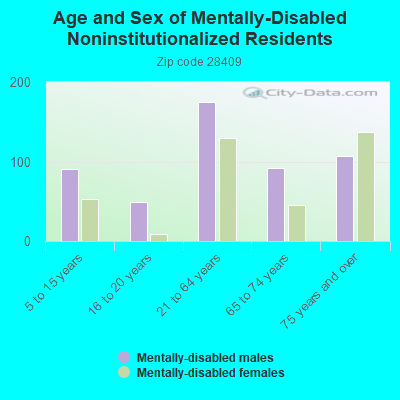
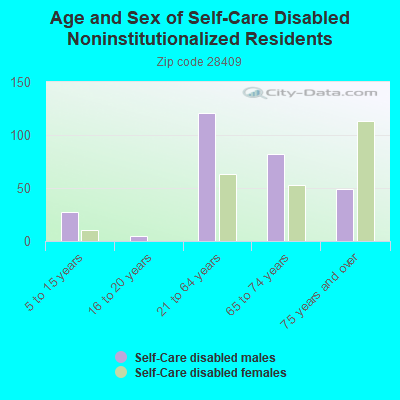
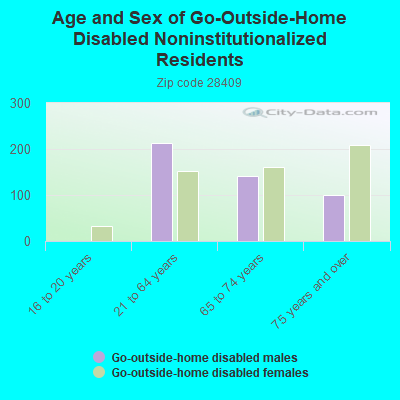
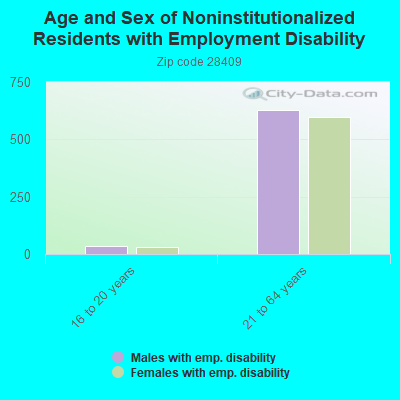
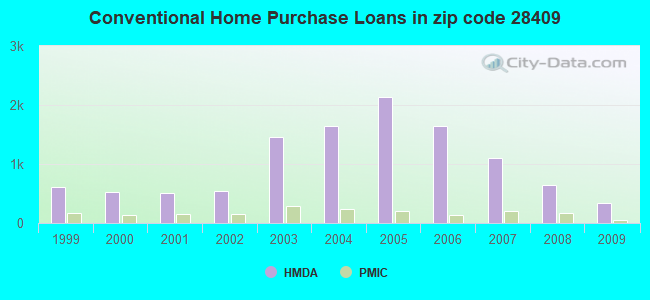
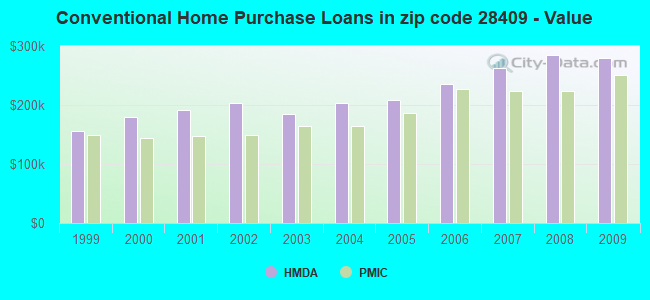
 According to the data from the years 2002 - 2018 the average number of fires per year is 60. The highest number of reported fire incidents - 96 took place in 2011, and the least - 38 in 2005. The data has a growing trend.
 When looking into fire subcategories, the most reports belonged to: Outside Fires (50.3%), and Structure Fires (37.6%).