Estimated zip code population in 2022: 1,696 Zip code population in 2010: 1,818 Zip code population in 2000: 1,414
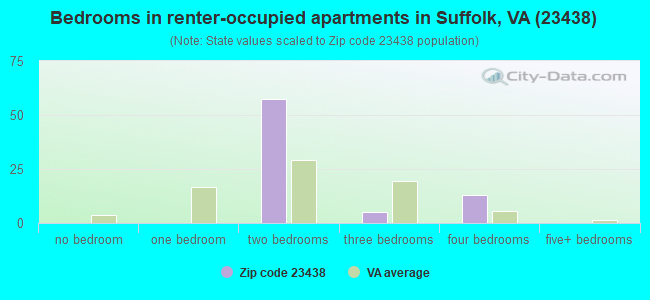
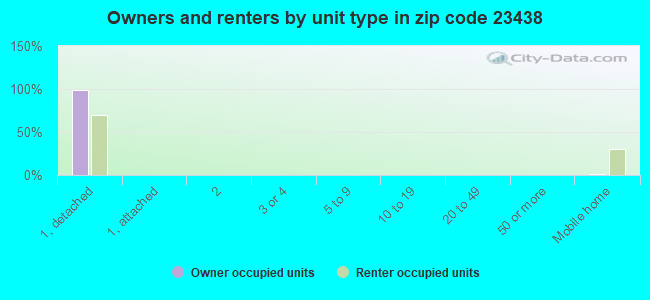
Houses and condos: 729 Renter-occupied apartments: 76
% of renters here:
11%
State:
33%
March 2022 cost of living index in zip code 23438: 86.3 (less than average, U.S. average is 100)
Land area: 41.1 sq. mi. Water area: 0.0 sq. mi.
Population density: 41 people per square mile
(very low).
OSM Map
General Map
Google Map
MSN Map
OSM Map
General Map
Google Map
MSN Map
OSM Map
General Map
Google Map
MSN Map
OSM Map
General Map
Google Map
MSN Map
Please wait while loading the map...
Real estate property taxes paid for housing units in 2022:
This zip code:
0.9% ($2,318)
Virginia:
0.7% ($2,617)
Median real estate property taxes paid for housing units with mortgages in 2022: $2,176 (0.8%) Median real estate property taxes paid for housing units with no mortgage in 2022: $3,175 (1.2%)
Business Search- 14 Million verified businesses
Males: 937
(55.3%)
Females: 758
(44.7%)
For population 25 years and over in 23438:
High school or higher: 94.1%
Bachelor's degree or higher: 21.1%
Graduate or professional degree: 4.8%
Unemployed: 2.9%
Mean travel time to work (commute): 41.4 minutes
For population 15 years and over in 23438:
Never married: 22.3%
Now married: 66.1%
Separated: 0.0%
Widowed: 5.3%
Divorced: 6.3%
Zip code 23438 compared to state average:
Hispanic race population percentage significantly below state average.
Median age above state average.
Foreign-born population percentage significantly below state average.
Renting percentage significantly below state average.
Number of college students below state average.
Percentage of population with a bachelor's degree or higher below state average.
Averages for the 2020 tax year for zip code 23438, filed in 2021:
Average Adjusted Gross Income (AGI) in 2020: $61,689 (Individual Income Tax Returns)
Here:
$61,689
State:
$86,446
Salary/wage: $57,421 (reported on 80.9% of returns)
Here:
$57,421
State:
$71,185
(% of AGI for various income ranges: 1107.6% for AGIs below $25k, 3598.4% for AGIs $25k-50k, 6402.7% for AGIs $50k-75k, 9010.0% for AGIs $75k-100k, 19277.5% for AGIs $100k-200k)
Taxable interest for individuals: $696 (reported on 27.0% of returns)
This zip code:
$696
Virginia:
$1,805
(% of AGI for various income ranges: 20.6% for AGIs below $25k, 13.7% for AGIs $25k-50k, 20.0% for AGIs $50k-75k, 46.7% for AGIs $75k-100k, 70.0% for AGIs $100k-200k)
Ordinary dividends: $3,000 (reported on 13.5% of returns)
Here:
$3,000
State:
$8,327
(% of AGI for various income ranges: 26.8% for AGIs $25k-50k, 31.8% for AGIs $50k-75k, 342.5% for AGIs $100k-200k)
Net capital gain/loss in AGI: +$8,718 (reported on 12.4% of returns)
Here:
+$8,718
State:
+$24,644
(% of AGI for various income ranges: 23.7% for AGIs $25k-50k, 253.6% for AGIs $50k-75k, 793.8% for AGIs $100k-200k)
Profit/loss from business: +$7,262 (reported on 14.6% of returns)
Here:
+$7,262
State:
+$12,836
(% of AGI for various income ranges: 164.1% for AGIs below $25k, 119.5% for AGIs $25k-50k, 134.5% for AGIs $50k-75k, 362.5% for AGIs $100k-200k)
Taxable individual retirement arrangement distribution: $18,433 (reported on 6.7% of returns)
23438:
$18,433
Virginia:
$21,535
(% of AGI for various income ranges: 134.7% for AGIs below $25k, 145.3% for AGIs $25k-50k, 751.2% for AGIs $100k-200k)
Total itemized deductions: $32,167 (reported on 10.1% of returns)
Here:
$32,167
State:
$33,287
(% of AGI for various income ranges: 308.2% for AGIs below $25k, 710.9% for AGIs $50k-75k, 1986.2% for AGIs $100k-200k)
Charity contributions: $8,250 (reported on 9.0% of returns)
Here:
$8,250
State:
$10,381
(% of AGI for various income ranges: 137.9% for AGIs $25k-50k, 497.5% for AGIs $100k-200k)
Taxes paid: $7,956 (reported on 10.1% of returns)
23438:
$7,956
State:
$8,284
(% of AGI for various income ranges: 51.2% for AGIs below $25k, 199.1% for AGIs $50k-75k, 512.5% for AGIs $100k-200k)
Earned income credit: $2,123 (reported on 14.6% of returns)
Here:
$2,123
State:
$2,214
(% of AGI for various income ranges: 82.9% for AGIs below $25k, 71.1% for AGIs $25k-50k)
Percentage of individuals using paid preparers for their 2020 taxes: 89.9%
Here:
90%
State:
92%
(% for various income ranges: 87.5% for AGIs below $25k, 91.7% for AGIs $25k-50k, 93.3% for AGIs $50k-75k, 87.5% for AGIs $75k-100k, 100.0% for AGIs $100k-200k, 0.0% for AGIs over 200k)
Averages for the 2012 tax year for zip code 23438, filed in 2013:
Average Adjusted Gross Income (AGI) in 2012: $54,391 (Individual Income Tax Returns)
Here:
$54,391
State:
$71,192
Salary/wage: $47,691 (reported on 86.2% of returns)
Here:
$47,691
State:
$59,229
(% of AGI for various income ranges: 71.9% for AGIs below $25k, 79.5% for AGIs $25k-50k, 83.6% for AGIs $50k-75k, 82.4% for AGIs $75k-100k, 66.1% for AGIs $100k-200k)
Taxable interest for individuals: $1,004 (reported on 33.8% of returns)
This zip code:
$1,004
Virginia:
$1,600
(% of AGI for various income ranges: 1.9% for AGIs below $25k, 0.2% for AGIs $25k-50k, 0.3% for AGIs $50k-75k, 1.0% for AGIs $75k-100k, 0.4% for AGIs $100k-200k)
Ordinary dividends: $1,133 (reported on 15.0% of returns)
Here:
$1,133
State:
$6,959
(% of AGI for various income ranges: 0.7% for AGIs below $25k, 0.2% for AGIs $50k-75k, 0.4% for AGIs $75k-100k, 0.4% for AGIs $100k-200k)
Net capital gain/loss in AGI: +$7,500 (reported on 11.2% of returns)
Here:
+$7,500
State:
+$16,672
(% of AGI for various income ranges: 4.6% for AGIs $100k-200k)
Profit/loss from business: +$5,500 (reported on 11.2% of returns)
Here:
+$5,500
State:
+$14,116
(% of AGI for various income ranges: 8.9% for AGIs below $25k, 1.8% for AGIs $75k-100k)
Taxable individual retirement arrangement distribution: $13,071 (reported on 8.8% of returns)
23438:
$13,071
Virginia:
$16,667
Total itemized deductions: $21,109 (25% of AGI, reported on 41.2% of returns)
Here:
$21,109
State:
$26,596
Here:
24.8% of AGI
State:
20.1% of AGI
(% of AGI for various income ranges: 13.0% for AGIs below $25k, 13.9% for AGIs $25k-50k, 17.0% for AGIs $50k-75k, 15.6% for AGIs $75k-100k, 17.3% for AGIs $100k-200k)
Charity contributions: $3,438 (reported on 30.0% of returns)
Here:
$3,438
State:
$4,443
(% of AGI for various income ranges: 1.9% for AGIs $25k-50k, 2.2% for AGIs $50k-75k, 2.2% for AGIs $75k-100k, 2.0% for AGIs $100k-200k)
Taxes paid: $6,970 (reported on 41.2% of returns)
23438:
$6,970
State:
$9,951
(% of AGI for various income ranges: 2.2% for AGIs below $25k, 3.1% for AGIs $25k-50k, 5.2% for AGIs $50k-75k, 5.9% for AGIs $75k-100k, 6.6% for AGIs $100k-200k)
Earned income credit: $2,392 (reported on 15.0% of returns)
Here:
$2,392
State:
$2,211
(% of AGI for various income ranges: 5.4% for AGIs below $25k, 1.3% for AGIs $25k-50k)
Percentage of individuals using paid preparers for their 2012 taxes: 50.0%
Here:
50%
State:
46%
(% for various income ranges: 48.1% for AGIs below $25k, 44.4% for AGIs $25k-50k, 57.1% for AGIs $50k-75k, 54.5% for AGIs $75k-100k, 50.0% for AGIs $100k-200k)
Averages for the 2004 tax year for zip code 23438, filed in 2005:
Average Adjusted Gross Income (AGI) in 2004: $44,065 (Individual Income Tax Returns)
Here:
$44,065
State:
$56,704
Salary/wage: $40,031 (reported on 88.0% of returns)
Here:
$40,031
State:
$48,441
(% of AGI for various income ranges: 85.1% for AGIs below $10k, 82.0% for AGIs $10k-25k, 82.5% for AGIs $25k-50k, 86.4% for AGIs $50k-75k, 88.8% for AGIs $75k-100k, 63.0% for AGIs over 100k)
Taxable interest for individuals: $939 (reported on 39.2% of returns)
This zip code:
$939
Virginia:
$1,688
(% of AGI for various income ranges: 2.3% for AGIs below $10k, 2.3% for AGIs $10k-25k, 0.8% for AGIs $25k-50k, 0.5% for AGIs $50k-75k, 0.2% for AGIs $75k-100k, 1.1% for AGIs over 100k)
Taxable dividends: $1,279 (reported on 18.5% of returns)
Here:
$1,279
State:
$4,028
(% of AGI for various income ranges: 0.6% for AGIs below $10k, 0.5% for AGIs $10k-25k, 0.4% for AGIs $25k-50k, 0.3% for AGIs $50k-75k, 0.1% for AGIs $75k-100k, 1.3% for AGIs over 100k)
Net capital gain/loss: +$12,165 (reported on 12.8% of returns)
Here:
+$12,165
State:
+$14,375
(% of AGI for various income ranges: 1.0% for AGIs below $10k, 0.7% for AGIs $25k-50k, 1.5% for AGIs $50k-75k, 2.6% for AGIs $75k-100k, 10.4% for AGIs over 100k)
Profit/loss from business: +$3,396 (reported on 12.7% of returns)
Here:
+$3,396
State:
+$13,342
(% of AGI for various income ranges: 4.4% for AGIs $10k-25k, 0.5% for AGIs $25k-50k, 0.3% for AGIs $50k-75k, 1.0% for AGIs $75k-100k, 1.0% for AGIs over 100k)
IRA payment deduction: $2,471 (reported on 2.2% of returns)
23438:
$2,471
Virginia:
$2,943
Total itemized deductions: $16,280 (22% of AGI, reported on 36.8% of returns)
Here:
$16,280
State:
$21,492
Here:
22.3% of AGI
State:
21.0% of AGI
(% of AGI for various income ranges: 11.0% for AGIs $10k-25k, 11.5% for AGIs $25k-50k, 15.4% for AGIs $50k-75k, 16.0% for AGIs $75k-100k, 13.7% for AGIs over 100k)
Charity contributions deductions: $2,845 (4% of AGI, reported on 32.3% of returns)
Here:
$2,845
State:
$3,794
Here:
3.8% of AGI
State:
3.5% of AGI
(% of AGI for various income ranges: 0.7% for AGIs $10k-25k, 2.0% for AGIs $25k-50k, 2.1% for AGIs $50k-75k, 2.3% for AGIs $75k-100k, 2.7% for AGIs over 100k)
Total tax: $5,561 (reported on 74.3% of returns)
23438:
$5,561
State:
$9,537
(% of AGI for various income ranges: 1.3% for AGIs below $10k, 3.7% for AGIs $10k-25k, 6.0% for AGIs $25k-50k, 8.0% for AGIs $50k-75k, 10.6% for AGIs $75k-100k, 15.5% for AGIs over 100k)
Earned income credit: $1,687 (reported on 15.2% of returns)
Here:
$1,687
State:
$1,734
Percentage of individuals using paid preparers for their 2004 taxes: 55.7%
Here:
56%
State:
52%
(% for various income ranges: 50.0% for AGIs below $10k, 55.8% for AGIs $10k-25k, 51.7% for AGIs $25k-50k, 60.4% for AGIs $50k-75k, 56.2% for AGIs $75k-100k, 70.2% for AGIs over 100k)
Likely homosexual households (counted as self-reported same-sex unmarried-partner households)
Lesbian couples: 0.0% of all households
Gay men: 0.9% of all households
Household received Food Stamps/SNAP in the past 12 months: 39 Household did not receive Food Stamps/SNAP in the past 12 months: 662
Women who had a birth in the past 12 months: 13 (14 now married, 0 unmarried) Women who did not have a birth in the past 12 months: 258 (218 now married, 35 unmarried)
Housing units in zip code 23438 with a mortgage: 469 (60 second mortgage, 34 both second mortgage and home equity loan) Houses without a mortgage: 20
Median monthly owner costs for units with a mortgage: $1,719 Median monthly owner costs for units without a mortgage: $640
Residents with income below the poverty level in 2022:
This zip code:
14.1%
Whole state:
10.6%
Residents with income below 50% of the poverty level in 2022:
This zip code:
12.0%
Whole state:
5.2%
Median number of rooms in houses and condos:
Here:
6.8
State:
7.0
Median number of rooms in apartments:
Here:
5.9
State:
4.3
Notable locations in this zip code not listed on our city pages
Notable locations in zip code 23438: Suffolk Department of Fire and Rescue Station 8 Whaleyville Volunteer Fire Department (A), Whaleyville Community Center (B). Display/hide their locations on the map
In group quarters: 19 (-1 institutionalized population)
Size of family households: 195 2-persons, 112 3-persons, 147 4-persons, 7 5-persons
Size of nonfamily households: 211 1-person, 15 2-persons, 12 5-persons
272 married couples with children.
18 single-parent households (8 men, 10 women).
96.6% of residents of 23438 zip code speak English at home.
1.5% of residents speak Spanish at home (100% very well).
0.8% of residents speak other Indo-European language at home (46% very well, 54% not at all).
0.8% of residents speak Asian or Pacific Island language at home (54% very well, 46% well).
Foreign born population: 21 (1.3%) (100.0% of them are naturalized citizens)
This zip code:
1.3%
Whole state:
12.7%
25%France
25%Pakistan
25%Mexico
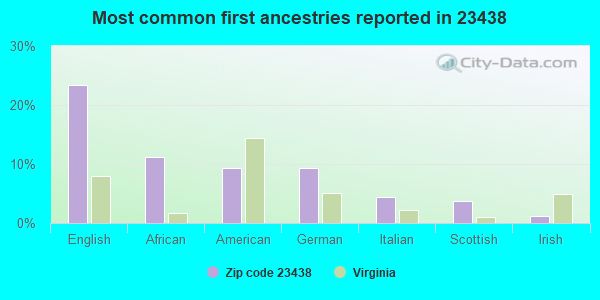
23%English
11%African
9%American
9%German
4%Italian
4%Scottish
1%Irish
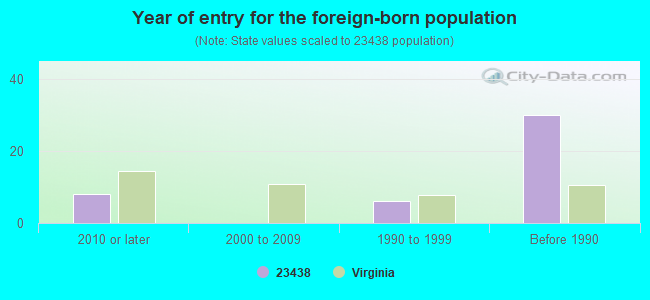
Year of entry for the foreign-born population
82010 or later
02000 to 2009
61990 to 1999
30Before 1990
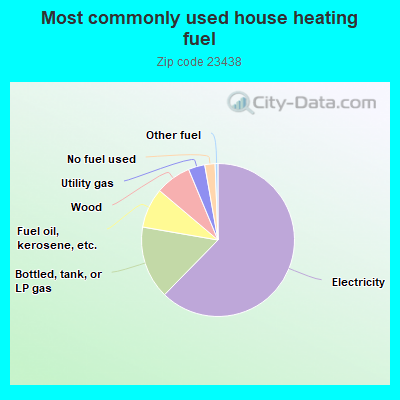
62.7%Electricity
15.5%Bottled, tank, or LP gas
8.5%Fuel oil, kerosene, etc.
7.6%Wood
3.5%Utility gas
2.2%No fuel used
0.6%Other fuel
Population in 1990: 2,073.
Place of birth for U.S.-born residents:
This state: 953
Northeast: 216
Midwest: 99
South: 283
West: 94
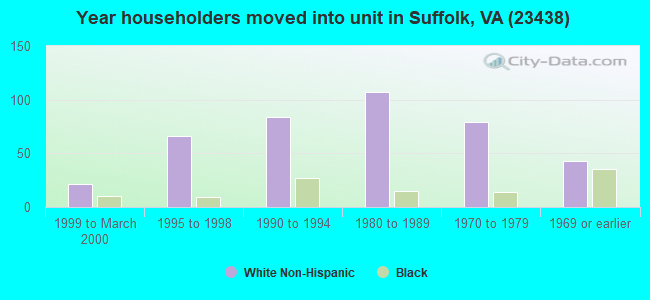
85% of the 23438 zip code residents lived in the same house 5 years ago. Out of people who lived in different houses, 71% lived in this county. Out of people who lived in different counties, 50% lived in Virginia.
95% of the 23438 zip code residents lived in the same house 1 year ago. Out of people who lived in different houses, 32% moved from different county within same state. Out of people who lived in different houses, 80% moved from different state.
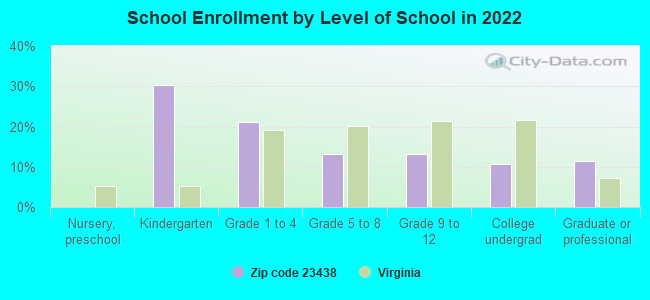
Private vs. public school enrollment:
Students in private schools in grades 1 to 8 (elementary and middle school): 64
Here:
70.6%
Virginia:
13.2%
Students in private schools in grades 9 to 12 (high school):
Here:
0.0%
Virginia:
10.2%
Students in private undergraduate colleges: 5
Here:
18.7%
Virginia:
18.7%
Occupation by median earnings in the past 12 months ($)
107,135Architecture and engineering occupations
81,586Management occupations
78,622Business and financial operations occupations
74,543Transportation occupations
69,954Material moving occupations
65,338Installation, maintenance, and repair occupations
Top industries in this zip code by the number of employees in 2005:
Health Care and Social Assistance: Residential Mental Retardation Facilities (10-19 employees: 1 establishment)
Construction: Other Heavy and Civil Engineering Construction (10-19: 1)
Other Services (except Public Administration): Religious Organizations (1-4: 3)
People in group quarters in 2010:
15 people in group homes intended for adults
Fatal accident statistics in 2012:
Fatal accident count: 2
Vehicles involved in fatal accidents: 2
Fatal accidents caused by drunken drivers: 2
Fatalities: 2
Persons involved in fatal accidents: 3
Pedestrians involved in fatal accidents: 0
Fatal accident statistics in 2010:
Fatal accident count: 1
Vehicles involved in fatal accidents: 1
Fatal accidents caused by drunken drivers: 0
Fatalities: 1
Persons involved in fatal accidents: 1
Pedestrians involved in fatal accidents: 0
Home Mortgage Disclosure Act Aggregated Statistics For Year 2009 (Based on 4 partial tracts)
A) FHA, FSA/RHS & VA Home Purchase Loans
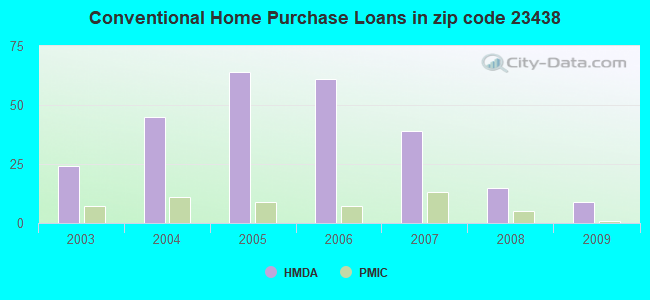
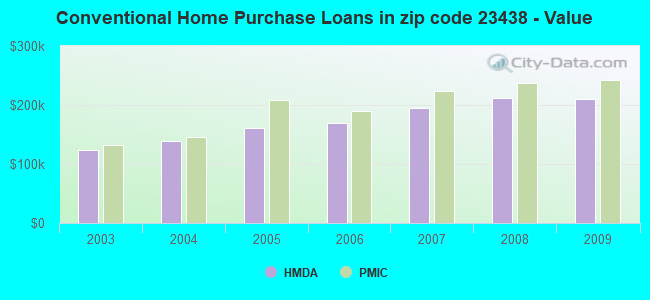
B) Conventional Home Purchase Loans
C) Refinancings
D) Home Improvement Loans
F) Non-occupant Loans on < 5 Family Dwellings (A B C & D)
G) Loans On Manufactured Home Dwelling (A B C & D)
Number
Average Value
Number
Average Value
Number
Average Value
Number
Average Value
Number
Average Value
Number
Average Value
LOANS ORIGINATED
22
$197,168
9
$209,434
99
$199,557
10
$78,069
5
$118,158
3
$183,243
APPLICATIONS APPROVED, NOT ACCEPTED
1
$90,720
0
$0
8
$152,729
3
$49,093
1
$51,370
0
$0
APPLICATIONS DENIED
2
$160,790
3
$156,063
42
$189,152
9
$71,061
2
$105,640
1
$106,250
APPLICATIONS WITHDRAWN
0
$0
0
$0
26
$208,895
1
$151,730
1
$78,670
1
$128,080
FILES CLOSED FOR INCOMPLETENESS
0
$0
0
$0
7
$200,053
0
$0
0
$0
0
$0
Aggregated Statistics For Year 2008 (Based on 4 partial tracts)
A) FHA, FSA/RHS & VA Home Purchase Loans
B) Conventional Home Purchase Loans
C) Refinancings
D) Home Improvement Loans
F) Non-occupant Loans on < 5 Family Dwellings (A B C & D)
G) Loans On Manufactured Home Dwelling (A B C & D)
Number
Average Value
Number
Average Value
Number
Average Value
Number
Average Value
Number
Average Value
Number
Average Value
LOANS ORIGINATED
14
$211,716
15
$211,517
81
$177,826
14
$63,571
5
$134,704
2
$188,580
APPLICATIONS APPROVED, NOT ACCEPTED
0
$0
1
$168,740
13
$135,924
6
$46,007
1
$97,310
1
$173,690
APPLICATIONS DENIED
3
$157,310
2
$143,825
74
$197,223
18
$117,676
2
$62,200
1
$327,580
APPLICATIONS WITHDRAWN
4
$159,828
2
$209,640
31
$206,894
3
$102,257
3
$127,920
0
$0
FILES CLOSED FOR INCOMPLETENESS
0
$0
0
$0
8
$217,830
1
$107,830
0
$0
0
$0
Aggregated Statistics For Year 2007 (Based on 4 partial tracts)
A) FHA, FSA/RHS & VA Home Purchase Loans
B) Conventional Home Purchase Loans
C) Refinancings
D) Home Improvement Loans
F) Non-occupant Loans on < 5 Family Dwellings (A B C & D)
G) Loans On Manufactured Home Dwelling (A B C & D)
Number
Average Value
Number
Average Value
Number
Average Value
Number
Average Value
Number
Average Value
Number
Average Value
LOANS ORIGINATED
11
$209,938
39
$194,961
126
$166,125
30
$88,478
14
$113,127
9
$122,069
APPLICATIONS APPROVED, NOT ACCEPTED
0
$0
5
$165,806
23
$172,652
4
$73,642
2
$122,695
0
$0
APPLICATIONS DENIED
1
$68,480
14
$180,366
94
$164,134
21
$97,620
6
$139,603
3
$113,793
APPLICATIONS WITHDRAWN
2
$260,895
7
$192,467
51
$171,120
4
$171,642
3
$148,773
2
$157,305
FILES CLOSED FOR INCOMPLETENESS
0
$0
2
$368,235
19
$161,545
1
$65,910
1
$65,410
0
$0
Aggregated Statistics For Year 2006 (Based on 4 partial tracts)
A) FHA, FSA/RHS & VA Home Purchase Loans
B) Conventional Home Purchase Loans
C) Refinancings
D) Home Improvement Loans
F) Non-occupant Loans on < 5 Family Dwellings (A B C & D)
G) Loans On Manufactured Home Dwelling (A B C & D)
Number
Average Value
Number
Average Value
Number
Average Value
Number
Average Value
Number
Average Value
Number
Average Value
LOANS ORIGINATED
9
$196,474
61
$169,758
141
$154,568
28
$88,043
13
$114,058
7
$100,677
APPLICATIONS APPROVED, NOT ACCEPTED
1
$175,740
7
$148,234
27
$149,475
4
$31,632
1
$64,110
1
$39,340
APPLICATIONS DENIED
1
$215,910
18
$122,702
118
$144,278
22
$67,108
5
$88,748
10
$86,564
APPLICATIONS WITHDRAWN
2
$144,370
6
$166,750
64
$147,460
5
$110,164
1
$33,980
2
$99,810
FILES CLOSED FOR INCOMPLETENESS
0
$0
2
$150,595
17
$171,893
0
$0
0
$0
0
$0
Aggregated Statistics For Year 2005 (Based on 4 partial tracts)
A) FHA, FSA/RHS & VA Home Purchase Loans
B) Conventional Home Purchase Loans
C) Refinancings
D) Home Improvement Loans
F) Non-occupant Loans on < 5 Family Dwellings (A B C & D)
G) Loans On Manufactured Home Dwelling (A B C & D)
Number
Average Value
Number
Average Value
Number
Average Value
Number
Average Value
Number
Average Value
Number
Average Value
LOANS ORIGINATED
11
$179,380
64
$160,646
135
$137,480
26
$66,933
14
$110,521
5
$108,026
APPLICATIONS APPROVED, NOT ACCEPTED
2
$153,865
8
$197,086
20
$115,354
4
$58,245
2
$105,455
1
$139,900
APPLICATIONS DENIED
1
$75,280
15
$141,207
87
$125,959
26
$70,124
5
$99,222
8
$120,376
APPLICATIONS WITHDRAWN
0
$0
7
$143,253
55
$129,525
8
$102,292
3
$103,740
2
$79,150
FILES CLOSED FOR INCOMPLETENESS
0
$0
3
$148,650
10
$137,380
1
$88,980
0
$0
0
$0
Aggregated Statistics For Year 2004 (Based on 4 partial tracts)
A) FHA, FSA/RHS & VA Home Purchase Loans
B) Conventional Home Purchase Loans
C) Refinancings
D) Home Improvement Loans
F) Non-occupant Loans on < 5 Family Dwellings (A B C & D)
G) Loans On Manufactured Home Dwelling (A B C & D)
Number
Average Value
Number
Average Value
Number
Average Value
Number
Average Value
Number
Average Value
Number
Average Value
LOANS ORIGINATED
14
$150,518
45
$139,171
122
$119,479
16
$56,417
12
$72,801
8
$93,209
APPLICATIONS APPROVED, NOT ACCEPTED
1
$144,760
7
$126,639
19
$104,029
4
$36,952
2
$87,485
2
$128,705
APPLICATIONS DENIED
1
$169,880
13
$123,021
90
$99,921
19
$47,667
8
$86,529
3
$71,967
APPLICATIONS WITHDRAWN
1
$117,220
6
$139,750
56
$104,416
7
$82,476
0
$0
2
$117,205
FILES CLOSED FOR INCOMPLETENESS
0
$0
2
$98,465
10
$128,788
1
$38,160
1
$94,720
0
$0
Aggregated Statistics For Year 2003 (Based on 4 partial tracts)
A) FHA, FSA/RHS & VA Home Purchase Loans
B) Conventional Home Purchase Loans
C) Refinancings
D) Home Improvement Loans
F) Non-occupant Loans on < 5 Family Dwellings (A B C & D)
Detailed PMIC statistics for the following Tracts:0756.00
, 0758.00
2002 - 2018 National Fire Incident Reporting System (NFIRS) incidents
According to the data from the years 2002 - 2018 the average number of fire incidents per year is 18. The highest number of fires - 50 took place in 2011, and the least - 0 in 2016. The data has a dropping trend.
When looking into fire subcategories, the most incidents belonged to: Outside Fires (45.2%), and Structure Fires (38.8%).
Fire incident types reported to NFIRS in Zip Code 23438

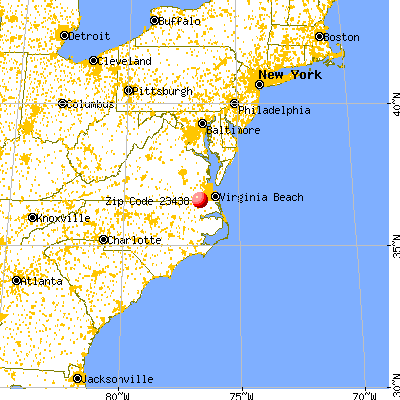


 Nearest zip codes: 27937, 23437, 27926, 23434, 27938, 27979.


 According to the data from the years 2002 - 2018 the average number of fire incidents per year is 18. The highest number of fires - 50 took place in 2011, and the least - 0 in 2016. The data has a dropping trend.
 When looking into fire subcategories, the most incidents belonged to: Outside Fires (45.2%), and Structure Fires (38.8%).