Estimated zip code population in 2022: 4,990 Zip code population in 2010: 4,515 Zip code population in 2000: 2,920
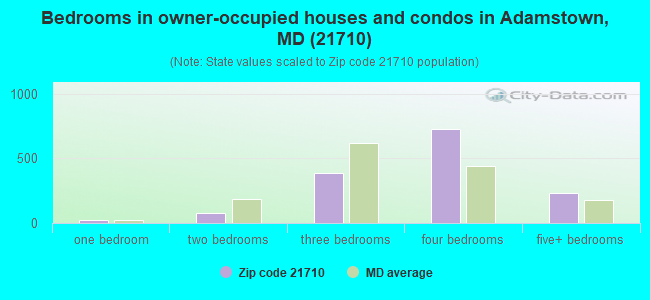
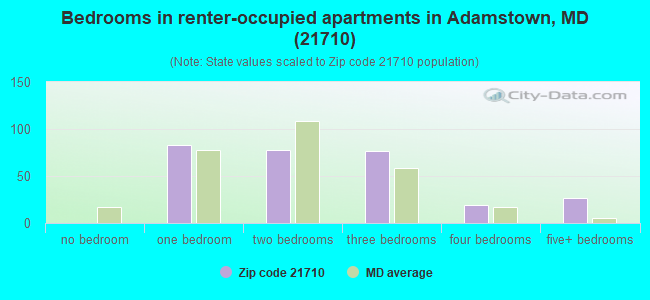
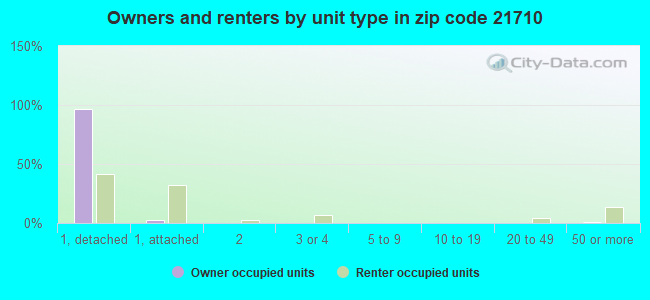
Houses and condos: 1,772 Renter-occupied apartments: 286
% of renters here:
16%
State:
32%
March 2022 cost of living index in zip code 21710: 140.9 (very high, U.S. average is 100)
Land area: 25.6 sq. mi. Water area: 0.4 sq. mi.
Population density: 195 people per square mile
(very low).
OSM Map
General Map
Google Map
MSN Map
OSM Map
General Map
Google Map
MSN Map
OSM Map
General Map
Google Map
MSN Map
OSM Map
General Map
Google Map
MSN Map
Please wait while loading the map...
Real estate property taxes paid for housing units in 2022:
This zip code:
0.8% ($4,563)
Maryland:
0.9% ($3,777)
Median real estate property taxes paid for housing units with mortgages in 2022: $4,674 (0.8%) Median real estate property taxes paid for housing units with no mortgage in 2022: $4,391 (0.9%)
Estimated median house/condo value in 2022: $580,044
21710:
$580,044
Maryland:
$398,100
According to our research of Maryland and other state lists, there were 2 registered sex offenders living in 21710 zip code as of June 05, 2024. The ratio of all residents to sex offenders in zip code 21710 is 2,426 to 1. The ratio of registered sex offenders to all residents in this zip code is much lower than the state average.
Median resident age:
This zip code:
49.0 years
Maryland median age:
39.7 years
Average household size:
This zip code:
2.7 people
Maryland:
2.5 people
Averages for the 2020 tax year for zip code 21710, filed in 2021:
Average Adjusted Gross Income (AGI) in 2020: $116,070 (Individual Income Tax Returns)
Here:
$116,070
State:
$86,905
Salary/wage: $98,216 (reported on 77.2% of returns)
Here:
$98,216
State:
$73,953
(% of AGI for various income ranges: 1105.9% for AGIs below $25k, 3472.3% for AGIs $25k-50k, 5330.0% for AGIs $50k-75k, 8500.8% for AGIs $75k-100k, 18917.0% for AGIs $100k-200k, 77216.7% for AGIs over 200k)
Taxable interest for individuals: $1,436 (reported on 53.6% of returns)
This zip code:
$1,436
Maryland:
$1,528
(% of AGI for various income ranges: 11.4% for AGIs below $25k, 50.0% for AGIs $25k-50k, 56.9% for AGIs $50k-75k, 188.5% for AGIs $75k-100k, 151.1% for AGIs $100k-200k, 761.1% for AGIs over 200k)
Ordinary dividends: $8,559 (reported on 36.2% of returns)
Here:
$8,559
State:
$8,028
(% of AGI for various income ranges: 37.6% for AGIs below $25k, 155.9% for AGIs $25k-50k, 255.0% for AGIs $50k-75k, 429.2% for AGIs $75k-100k, 670.8% for AGIs $100k-200k, 3370.0% for AGIs over 200k)
Net capital gain/loss in AGI: +$20,913 (reported on 31.7% of returns)
Here:
+$20,913
State:
+$25,238
(% of AGI for various income ranges: 19.0% for AGIs below $25k, 47.3% for AGIs $25k-50k, 186.9% for AGIs $50k-75k, 438.5% for AGIs $75k-100k, 821.6% for AGIs $100k-200k, 11977.8% for AGIs over 200k)
Profit/loss from business: +$20,026 (reported on 17.4% of returns)
Here:
+$20,026
State:
+$11,398
(% of AGI for various income ranges: 104.8% for AGIs below $25k, 297.7% for AGIs $25k-50k, 258.8% for AGIs $50k-75k, 303.1% for AGIs $75k-100k, 390.5% for AGIs $100k-200k, 5108.9% for AGIs over 200k)
Taxable individual retirement arrangement distribution: $21,445 (reported on 12.9% of returns)
21710:
$21,445
Maryland:
$20,944
(% of AGI for various income ranges: 35.5% for AGIs below $25k, 190.0% for AGIs $25k-50k, 352.5% for AGIs $50k-75k, 494.6% for AGIs $75k-100k, 657.0% for AGIs $100k-200k, 2288.9% for AGIs over 200k)
Self-employed (Keogh) retirement plans: $25,850 (reported on 0.9% of returns)
21710:
$25,850
Maryland:
$29,558
(% of AGI for various income ranges: 139.7% for AGIs $100k-200k)
Total itemized deductions: $33,539 (reported on 31.7% of returns)
Here:
$33,539
State:
$30,672
(% of AGI for various income ranges: 575.5% for AGIs $25k-50k, 1259.4% for AGIs $50k-75k, 1895.4% for AGIs $75k-100k, 2850.5% for AGIs $100k-200k, 8356.7% for AGIs over 200k)
Charity contributions: $6,378 (reported on 26.3% of returns)
Here:
$6,378
State:
$9,065
(% of AGI for various income ranges: 36.4% for AGIs $25k-50k, 121.9% for AGIs $50k-75k, 218.5% for AGIs $75k-100k, 402.2% for AGIs $100k-200k, 1906.7% for AGIs over 200k)
Taxes paid: $8,620 (reported on 31.2% of returns)
21710:
$8,620
State:
$8,475
(% of AGI for various income ranges: 94.1% for AGIs $25k-50k, 259.4% for AGIs $50k-75k, 464.6% for AGIs $75k-100k, 761.1% for AGIs $100k-200k, 2213.3% for AGIs over 200k)
Earned income credit: $1,470 (reported on 4.5% of returns)
Here:
$1,470
State:
$2,151
(% of AGI for various income ranges: 17.9% for AGIs below $25k, 43.2% for AGIs $25k-50k)
Percentage of individuals using paid preparers for their 2020 taxes: 91.1%
Here:
91%
State:
90%
(% for various income ranges: 89.1% for AGIs below $25k, 90.6% for AGIs $25k-50k, 91.3% for AGIs $50k-75k, 90.9% for AGIs $75k-100k, 92.5% for AGIs $100k-200k, 91.2% for AGIs over 200k)
Averages for the 2012 tax year for zip code 21710, filed in 2013:
Average Adjusted Gross Income (AGI) in 2012: $93,027 (Individual Income Tax Returns)
Here:
$93,027
State:
$72,703
Salary/wage: $83,856 (reported on 80.8% of returns)
Here:
$83,856
State:
$62,228
(% of AGI for various income ranges: 74.7% for AGIs below $25k, 66.2% for AGIs $25k-50k, 63.8% for AGIs $50k-75k, 67.5% for AGIs $75k-100k, 78.5% for AGIs $100k-200k, 69.4% for AGIs over 200k)
Taxable interest for individuals: $1,278 (reported on 57.3% of returns)
This zip code:
$1,278
Maryland:
$1,413
(% of AGI for various income ranges: 1.2% for AGIs below $25k, 0.9% for AGIs $25k-50k, 1.9% for AGIs $50k-75k, 1.4% for AGIs $75k-100k, 0.6% for AGIs $100k-200k, 0.5% for AGIs over 200k)
Ordinary dividends: $6,732 (reported on 35.2% of returns)
Here:
$6,732
State:
$6,933
(% of AGI for various income ranges: 3.6% for AGIs below $25k, 3.4% for AGIs $25k-50k, 3.9% for AGIs $50k-75k, 3.5% for AGIs $75k-100k, 2.1% for AGIs $100k-200k, 2.3% for AGIs over 200k)
Net capital gain/loss in AGI: +$6,568 (reported on 26.3% of returns)
Here:
+$6,568
State:
+$14,830
(% of AGI for various income ranges: 0.3% for AGIs $50k-75k, 1.2% for AGIs $100k-200k, 4.7% for AGIs over 200k)
Profit/loss from business: +$18,422 (reported on 17.4% of returns)
Here:
+$18,422
State:
+$12,606
(% of AGI for various income ranges: 10.9% for AGIs below $25k, 3.4% for AGIs $25k-50k, 2.9% for AGIs $50k-75k, 2.3% for AGIs $75k-100k, 2.0% for AGIs $100k-200k, 5.5% for AGIs over 200k)
Taxable individual retirement arrangement distribution: $15,328 (reported on 15.0% of returns)
21710:
$15,328
Maryland:
$17,065
(% of AGI for various income ranges: 4.1% for AGIs below $25k, 3.7% for AGIs $25k-50k, 4.5% for AGIs $50k-75k, 2.3% for AGIs $75k-100k, 2.5% for AGIs $100k-200k, 1.6% for AGIs over 200k)
Self-employment retirement plans: $16,133 (reported on 1.4% of returns)
21710:
$16,133
Maryland:
$24,439
Total itemized deductions: $31,271 (24% of AGI, reported on 62.9% of returns)
Here:
$31,271
State:
$27,886
Here:
23.9% of AGI
State:
22.8% of AGI
(% of AGI for various income ranges: 19.4% for AGIs below $25k, 21.4% for AGIs $25k-50k, 23.5% for AGIs $50k-75k, 23.4% for AGIs $75k-100k, 22.4% for AGIs $100k-200k, 18.0% for AGIs over 200k)
Charity contributions: $3,842 (reported on 54.5% of returns)
Here:
$3,842
State:
$4,452
(% of AGI for various income ranges: 1.2% for AGIs below $25k, 1.6% for AGIs $25k-50k, 2.3% for AGIs $50k-75k, 2.7% for AGIs $75k-100k, 2.3% for AGIs $100k-200k, 2.3% for AGIs over 200k)
Taxes paid: $12,433 (reported on 62.4% of returns)
21710:
$12,433
State:
$11,690
(% of AGI for various income ranges: 2.7% for AGIs below $25k, 4.4% for AGIs $25k-50k, 7.2% for AGIs $50k-75k, 8.4% for AGIs $75k-100k, 9.1% for AGIs $100k-200k, 8.8% for AGIs over 200k)
Earned income credit: $1,917 (reported on 5.6% of returns)
Here:
$1,917
State:
$2,199
(% of AGI for various income ranges: 3.2% for AGIs below $25k, 0.5% for AGIs $25k-50k)
Percentage of individuals using paid preparers for their 2012 taxes: 48.8%
Here:
49%
State:
52%
(% for various income ranges: 43.4% for AGIs below $25k, 46.7% for AGIs $25k-50k, 62.5% for AGIs $50k-75k, 54.2% for AGIs $75k-100k, 46.0% for AGIs $100k-200k, 52.6% for AGIs over 200k)
Averages for the 2004 tax year for zip code 21710, filed in 2005:
Average Adjusted Gross Income (AGI) in 2004: $81,264 (Individual Income Tax Returns)
Here:
$81,264
State:
$60,339
Salary/wage: $68,706 (reported on 76.5% of returns)
Here:
$68,706
State:
$52,211
(% of AGI for various income ranges: 183.4% for AGIs below $10k, 63.7% for AGIs $10k-25k, 66.9% for AGIs $25k-50k, 59.1% for AGIs $50k-75k, 75.9% for AGIs $75k-100k, 62.2% for AGIs over 100k)
Taxable interest for individuals: $2,145 (reported on 68.4% of returns)
This zip code:
$2,145
Maryland:
$1,701
(% of AGI for various income ranges: 6.4% for AGIs below $10k, 5.6% for AGIs $10k-25k, 2.7% for AGIs $25k-50k, 3.1% for AGIs $50k-75k, 1.9% for AGIs $75k-100k, 1.2% for AGIs over 100k)
Taxable dividends: $5,712 (reported on 42.5% of returns)
Here:
$5,712
State:
$4,235
(% of AGI for various income ranges: 8.9% for AGIs below $10k, 5.4% for AGIs $10k-25k, 2.4% for AGIs $25k-50k, 4.2% for AGIs $50k-75k, 2.9% for AGIs $75k-100k, 2.7% for AGIs over 100k)
Net capital gain/loss: +$15,807 (reported on 34.1% of returns)
Here:
+$15,807
State:
+$15,888
(% of AGI for various income ranges: 36.1% for AGIs below $10k, 1.8% for AGIs $10k-25k, 0.4% for AGIs $25k-50k, 1.6% for AGIs $50k-75k, 2.3% for AGIs $75k-100k, 9.3% for AGIs over 100k)
Profit/loss from business: +$18,770 (reported on 14.7% of returns)
Here:
+$18,770
State:
+$12,221
(% of AGI for various income ranges: -0.5% for AGIs below $10k, 4.5% for AGIs $10k-25k, 4.6% for AGIs $25k-50k, 2.8% for AGIs $50k-75k, 2.2% for AGIs $75k-100k, 3.6% for AGIs over 100k)
IRA payment deduction: $2,889 (reported on 3.2% of returns)
21710:
$2,889
Maryland:
$2,968
(% of AGI for various income ranges: 0.3% for AGIs $50k-75k, 0.2% for AGIs $75k-100k, 0.1% for AGIs over 100k)
Self-employed pension: $19,381 (reported on 1.2% of returns)
Here:
$19,381
Maryland:
$17,155
Total itemized deductions: $25,787 (23% of AGI, reported on 63.2% of returns)
Here:
$25,787
State:
$22,960
Here:
22.8% of AGI
State:
23.3% of AGI
(% of AGI for various income ranges: 25.6% for AGIs below $10k, 24.7% for AGIs $10k-25k, 20.2% for AGIs $25k-50k, 22.4% for AGIs $50k-75k, 23.6% for AGIs $75k-100k, 18.5% for AGIs over 100k)
Charity contributions deductions: $4,212 (4% of AGI, reported on 57.2% of returns)
Here:
$4,212
State:
$4,031
Here:
3.6% of AGI
State:
3.9% of AGI
(% of AGI for various income ranges: 2.6% for AGIs $10k-25k, 1.8% for AGIs $25k-50k, 3.1% for AGIs $50k-75k, 3.1% for AGIs $75k-100k, 3.1% for AGIs over 100k)
Total tax: $11,583 (reported on 87.7% of returns)
21710:
$11,583
State:
$10,167
(% of AGI for various income ranges: 8.6% for AGIs below $10k, 4.8% for AGIs $10k-25k, 7.4% for AGIs $25k-50k, 8.5% for AGIs $50k-75k, 9.4% for AGIs $75k-100k, 14.9% for AGIs over 100k)
Earned income credit: $1,491 (reported on 3.3% of returns)
Here:
$1,491
State:
$1,700
Percentage of individuals using paid preparers for their 2004 taxes: 52.6%
Here:
53%
State:
55%
(% for various income ranges: 36.2% for AGIs below $10k, 46.5% for AGIs $10k-25k, 59.0% for AGIs $25k-50k, 62.6% for AGIs $50k-75k, 54.9% for AGIs $75k-100k, 53.2% for AGIs over 100k)
Household received Food Stamps/SNAP in the past 12 months: 51 Household did not receive Food Stamps/SNAP in the past 12 months: 1,665
Women who did not have a birth in the past 12 months: 867 (366 now married, 500 unmarried)
Housing units in zip code 21710 with a mortgage: 1,090 (148 second mortgage, 153 both second mortgage and home equity loan) Houses without a mortgage: 36
Median monthly owner costs for units with a mortgage: $2,508 Median monthly owner costs for units without a mortgage: $655
Residents with income below the poverty level in 2022:
This zip code:
2.5%
Whole state:
9.6%
Residents with income below 50% of the poverty level in 2022:
This zip code:
0.3%
Whole state:
4.7%
Median number of rooms in houses and condos:
Here:
10.0
State:
7.3
Median number of rooms in apartments:
Here:
5.0
State:
4.2
Notable locations in this zip code not listed on our city pages
Notable locations in zip code 21710: Potomac Farms (A), Germantown Police Department District 5 (B), Carroll Manor Fire Company 14 (C). Display/hide their locations on the map
Churches in zip code 21710 include: Buckeystown United Methodist Church (A), Flint Hill Methodist Church (B), Koontz Church (C), Trinity Evangelical and Reformed Church (D). Display/hide their locations on the map
Streams, rivers, and creeks: Bear Branch (A), Bennett Creek (B), Kiln Run (C), Hatchery Run (D), Doubs Branch (E), Locust Run (F). Display/hide their locations on the map
In group quarters: 263 (-1 institutionalized population)
Size of family households: 468 2-persons, 176 3-persons, 405 4-persons, 194 5-persons, 12 6-persons
Size of nonfamily households: 315 1-person, 154 2-persons
714 married couples with children.
115 single-parent households (100 men, 15 women).
92.0% of residents of 21710 zip code speak English at home.
4.0% of residents speak Spanish at home (73% very well, 13% well, 13% not well).
0.8% of residents speak other Indo-European language at home (100% very well).
1.6% of residents speak Asian or Pacific Island language at home (100% very well).
1.2% of residents speak other language at home (72% very well, 28% well).
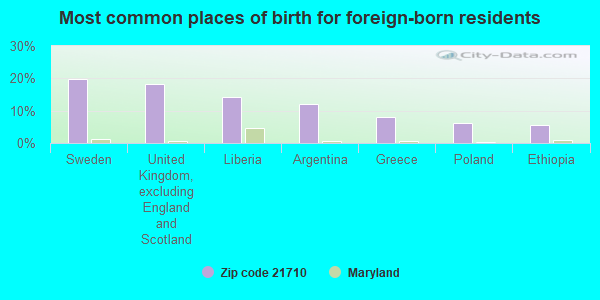
Foreign born population: 302 (6.1%) (95.4% of them are naturalized citizens)
This zip code:
6.1%
Whole state:
16.7%
20%Sweden
18%United Kingdom, excluding England and Scotland
14%Liberia
12%Argentina
8%Greece
6%Poland
6%Ethiopia
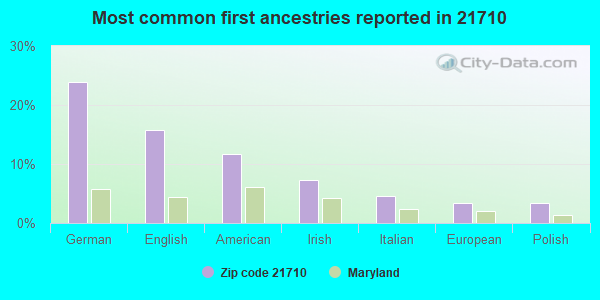
24%German
16%English
12%American
7%Irish
5%Italian
3%European
3%Polish
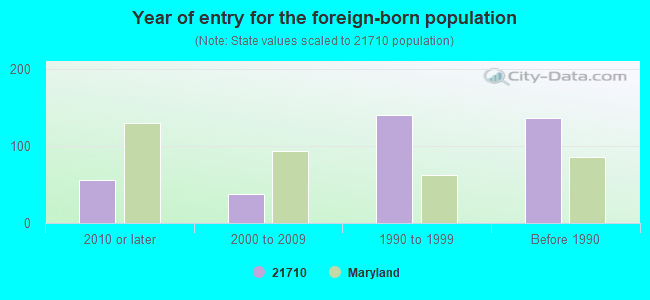
Year of entry for the foreign-born population
562010 or later
382000 to 2009
1401990 to 1999
136Before 1990
Facilities with environmental interests located in this zip code:
BISHOP CLAGGETT CENTER POOL (3035 BUCKEYSTOWN PIKE in ADAMSTOWN, MD)
STATE MASTER (Maryland Permits tracking) - National Pollutant Discharge Elimination System Permit National Pollutant Discharge Elimination System NON-MAJOR (Tracking pollutant discharge elimination systems) - permit Business SIC classification: RELIGIOUS ORGANIZATIONS Alternative names: EPISCOPAL DIOCESE OF MD
CARROLL MANOR SCHOOL (ADAMSTOWN ROAD in ADAMSTOWN, MD)
AIR MINOR (AIRS/AFS) STATE MASTER (Maryland Air Emissions Database) - AIR MINOR Business SIC classification: ELEMENTARY AND SECONDARY SCHOOLS
CARROLL MANOR ELEMENTARY (5624 ADAMSTOWN RD in ADAMSTOWN, MD)
(National Center for Education Statistics) - STATE ID-100108 Organizations: FREDERICK COUNTY BOARD OF EDUCATION (SCHOOL DISTRICT)
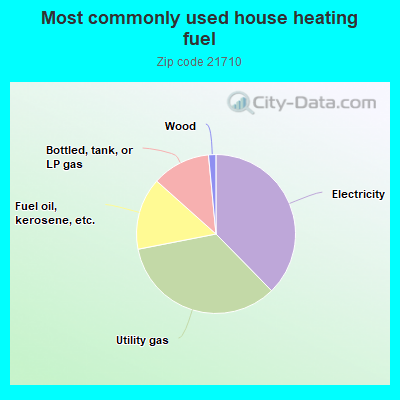
37.7%Electricity
34.3%Utility gas
14.7%Fuel oil, kerosene, etc.
11.9%Bottled, tank, or LP gas
1.5%Wood
Population in 1990: 2,085. Population change in the 1990s: +835 (+40.0%).
Place of birth for U.S.-born residents:
This state: 2,362
Northeast: 558
Midwest: 381
South: 981
West: 287
54% of the 21710 zip code residents lived in the same house 5 years ago. Out of people who lived in different houses, 36% lived in this county. Out of people who lived in different counties, 50% lived in Maryland.
95% of the 21710 zip code residents lived in the same house 1 year ago. Out of people who lived in different houses, 52% moved from this county. Out of people who lived in different houses, 11% moved from different county within same state. Out of people who lived in different houses, 38% moved from different state. Out of people who lived in different houses, 2% moved from abroad.
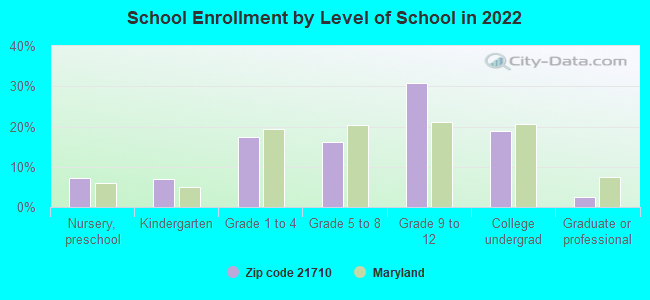
Private vs. public school enrollment:
Students in private schools in grades 1 to 8 (elementary and middle school):
Here:
0.0%
Maryland:
15.2%
Students in private schools in grades 9 to 12 (high school): 54
Here:
14.9%
Maryland:
14.4%
Students in private undergraduate colleges: 10
Here:
4.6%
Maryland:
20.2%
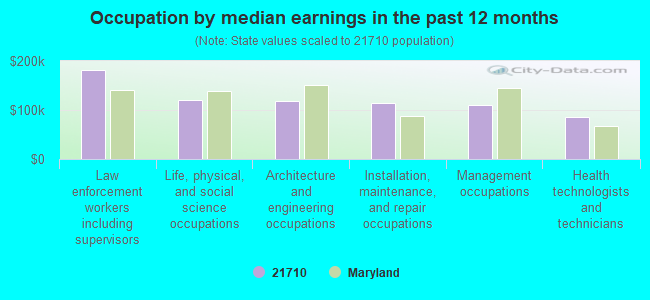
Occupation by median earnings in the past 12 months ($)
181,426Law enforcement workers including supervisors
121,150Life, physical, and social science occupations
118,294Architecture and engineering occupations
114,519Installation, maintenance, and repair occupations
109,481Management occupations
86,358Health technologists and technicians
Companies with federal contracts located in this zip code:
CUSTOM CARTS AND STORAGE COMPA (2703 MONOCACY BOTTOMS ROAD in ADAMSTOWN, MD; small business)
$2,098 with Army for Office Furniture. Signed on 2004-03-31. Completion date: 2004-04-30.
Top industries in this zip code by the number of employees in 2005:
Health Care and Social Assistance: Continuing Care Retirement Communities (100-249 employees: 1 establishment)
Accommodation and Food Services: Limited-Service Restaurants (20-49: 1)
Administrative and Support and Waste Management and Remediation Services: Landscaping Services (5-9: 2, 1-4: 2)
Arts, Entertainment, and Recreation: Racetracks (10-19: 1)
Administrative and Support and Waste Management and Remediation Services: Janitorial Services (10-19: 1)
Construction: Painting and Wall Covering Contractors (5-9: 2)
Other Services (except Public Administration): Religious Organizations (5-9: 1, 1-4: 3)
Construction: New Single-Family Housing Construction (except Operative Builders) (5-9: 1, 1-4: 1)
Professional, Scientific, and Technical Services: All Other Professional, Scientific, and Technical Services (5-9: 1)
People in group quarters in 2010:
39 people in nursing facilities/skilled-nursing facilities
18 people in workers' group living quarters and job corps centers
People in group quarters in 2000:
9 people in nursing homes
6 people in religious group quarters
Fatal accident statistics in 2014:
Fatal accident count: 1
Vehicles involved in fatal accidents: 2
Fatal accidents caused by drunken drivers: 0
Fatalities: 1
Persons involved in fatal accidents: 2
Pedestrians involved in fatal accidents: 0
Home Mortgage Disclosure Act Aggregated Statistics For Year 2009 (Based on 4 partial tracts)
A) FHA, FSA/RHS & VA Home Purchase Loans
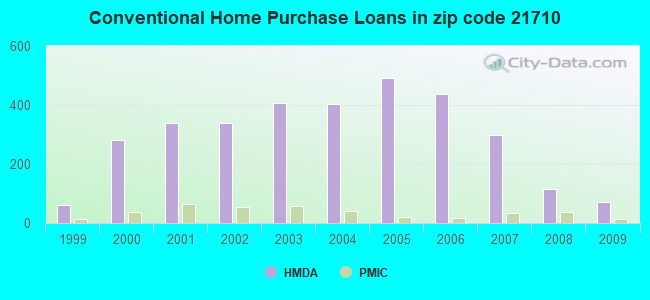
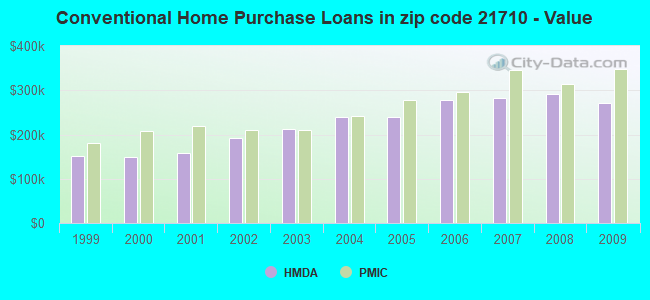
B) Conventional Home Purchase Loans
C) Refinancings
D) Home Improvement Loans
F) Non-occupant Loans on < 5 Family Dwellings (A B C & D)
G) Loans On Manufactured Home Dwelling (A B C & D)
Number
Average Value
Number
Average Value
Number
Average Value
Number
Average Value
Number
Average Value
Number
Average Value
LOANS ORIGINATED
97
$296,818
70
$270,876
448
$285,222
19
$188,855
16
$208,381
0
$0
APPLICATIONS APPROVED, NOT ACCEPTED
3
$304,493
3
$481,223
32
$319,765
0
$0
3
$200,303
1
$91,380
APPLICATIONS DENIED
15
$337,643
6
$172,095
117
$319,989
11
$108,531
5
$137,538
0
$0
APPLICATIONS WITHDRAWN
13
$304,110
11
$264,199
97
$327,103
2
$175,580
3
$163,783
0
$0
FILES CLOSED FOR INCOMPLETENESS
2
$246,775
3
$351,827
27
$311,510
0
$0
0
$0
0
$0
Aggregated Statistics For Year 2008 (Based on 4 partial tracts)
A) FHA, FSA/RHS & VA Home Purchase Loans
B) Conventional Home Purchase Loans
C) Refinancings
D) Home Improvement Loans
F) Non-occupant Loans on < 5 Family Dwellings (A B C & D)
G) Loans On Manufactured Home Dwelling (A B C & D)
Number
Average Value
Number
Average Value
Number
Average Value
Number
Average Value
Number
Average Value
Number
Average Value
LOANS ORIGINATED
60
$322,284
115
$291,909
231
$266,937
14
$105,186
14
$212,934
1
$55,640
APPLICATIONS APPROVED, NOT ACCEPTED
5
$331,592
9
$320,473
40
$281,676
2
$48,090
2
$173,950
0
$0
APPLICATIONS DENIED
3
$319,497
9
$448,068
129
$300,699
25
$100,591
2
$310,955
0
$0
APPLICATIONS WITHDRAWN
7
$259,721
16
$318,348
71
$290,457
5
$122,546
3
$255,197
0
$0
FILES CLOSED FOR INCOMPLETENESS
2
$308,310
3
$528,240
17
$336,185
1
$51,240
4
$361,222
0
$0
Aggregated Statistics For Year 2007 (Based on 4 partial tracts)
A) FHA, FSA/RHS & VA Home Purchase Loans
B) Conventional Home Purchase Loans
C) Refinancings
D) Home Improvement Loans
F) Non-occupant Loans on < 5 Family Dwellings (A B C & D)
G) Loans On Manufactured Home Dwelling (A B C & D)
Number
Average Value
Number
Average Value
Number
Average Value
Number
Average Value
Number
Average Value
Number
Average Value
LOANS ORIGINATED
10
$273,115
297
$282,196
306
$277,383
48
$111,371
21
$243,177
1
$145,190
APPLICATIONS APPROVED, NOT ACCEPTED
0
$0
28
$216,734
55
$235,770
12
$51,582
3
$275,870
0
$0
APPLICATIONS DENIED
2
$274,775
44
$323,043
195
$282,691
27
$107,083
8
$199,288
0
$0
APPLICATIONS WITHDRAWN
1
$381,580
52
$255,644
86
$242,520
6
$211,985
5
$271,618
0
$0
FILES CLOSED FOR INCOMPLETENESS
0
$0
5
$565,330
22
$311,694
3
$72,760
1
$347,620
0
$0
Aggregated Statistics For Year 2006 (Based on 4 partial tracts)
A) FHA, FSA/RHS & VA Home Purchase Loans
B) Conventional Home Purchase Loans
C) Refinancings
D) Home Improvement Loans
F) Non-occupant Loans on < 5 Family Dwellings (A B C & D)
G) Loans On Manufactured Home Dwelling (A B C & D)
Number
Average Value
Number
Average Value
Number
Average Value
Number
Average Value
Number
Average Value
Number
Average Value
LOANS ORIGINATED
12
$275,062
436
$277,962
457
$244,038
62
$126,083
35
$215,441
0
$0
APPLICATIONS APPROVED, NOT ACCEPTED
0
$0
34
$315,130
61
$241,758
9
$80,324
10
$190,083
1
$75,330
APPLICATIONS DENIED
2
$229,410
59
$261,214
190
$246,673
30
$102,089
4
$242,515
1
$68,480
APPLICATIONS WITHDRAWN
0
$0
50
$260,030
134
$280,324
11
$173,283
7
$252,203
0
$0
FILES CLOSED FOR INCOMPLETENESS
0
$0
10
$258,490
40
$306,451
3
$136,420
1
$183,050
0
$0
Aggregated Statistics For Year 2005 (Based on 4 partial tracts)
A) FHA, FSA/RHS & VA Home Purchase Loans
B) Conventional Home Purchase Loans
C) Refinancings
D) Home Improvement Loans
E) Loans on Dwellings For 5+ Families
F) Non-occupant Loans on < 5 Family Dwellings (A B C & D)
G) Loans On Manufactured Home Dwelling (A B C & D)
Number
Average Value
Number
Average Value
Number
Average Value
Number
Average Value
Number
Average Value
Number
Average Value
Number
Average Value
LOANS ORIGINATED
19
$246,618
490
$240,556
573
$251,031
56
$136,762
2
$22,427,200
51
$188,962
1
$19,690
APPLICATIONS APPROVED, NOT ACCEPTED
0
$0
33
$234,153
66
$254,465
11
$56,598
0
$0
4
$203,715
1
$214,000
APPLICATIONS DENIED
1
$246,530
48
$233,912
145
$253,339
25
$109,768
0
$0
9
$250,597
2
$66,340
APPLICATIONS WITHDRAWN
1
$262,200
60
$261,011
161
$263,139
16
$158,605
0
$0
11
$224,726
0
$0
FILES CLOSED FOR INCOMPLETENESS
0
$0
5
$300,554
35
$258,622
5
$95,302
0
$0
0
$0
1
$42,800
Aggregated Statistics For Year 2004 (Based on 4 partial tracts)
A) FHA, FSA/RHS & VA Home Purchase Loans
B) Conventional Home Purchase Loans
C) Refinancings
D) Home Improvement Loans
F) Non-occupant Loans on < 5 Family Dwellings (A B C & D)
G) Loans On Manufactured Home Dwelling (A B C & D)
Number
Average Value
Number
Average Value
Number
Average Value
Number
Average Value
Number
Average Value
Number
Average Value
LOANS ORIGINATED
23
$192,491
403
$238,757
575
$215,314
46
$104,058
52
$185,993
1
$106,970
APPLICATIONS APPROVED, NOT ACCEPTED
2
$185,005
29
$240,877
64
$215,943
11
$130,203
1
$139,630
0
$0
APPLICATIONS DENIED
1
$208,860
44
$207,382
157
$184,588
34
$89,413
10
$193,384
0
$0
APPLICATIONS WITHDRAWN
3
$191,663
37
$204,412
169
$208,761
14
$87,557
10
$148,061
0
$0
FILES CLOSED FOR INCOMPLETENESS
1
$169,490
7
$299,510
29
$210,464
4
$86,820
1
$68,400
0
$0
Aggregated Statistics For Year 2003 (Based on 4 partial tracts)
A) FHA, FSA/RHS & VA Home Purchase Loans
B) Conventional Home Purchase Loans
C) Refinancings
D) Home Improvement Loans
F) Non-occupant Loans on < 5 Family Dwellings (A B C & D)
Number
Average Value
Number
Average Value
Number
Average Value
Number
Average Value
Number
Average Value
LOANS ORIGINATED
55
$167,171
407
$213,190
1,102
$191,283
36
$49,077
45
$145,770
APPLICATIONS APPROVED, NOT ACCEPTED
3
$187,913
28
$237,625
130
$177,375
14
$24,634
7
$164,437
APPLICATIONS DENIED
1
$125,830
24
$163,050
170
$170,050
23
$34,732
4
$124,515
APPLICATIONS WITHDRAWN
7
$174,173
46
$229,863
211
$191,549
3
$99,350
7
$212,710
FILES CLOSED FOR INCOMPLETENESS
0
$0
8
$206,038
30
$195,182
2
$31,750
0
$0
Aggregated Statistics For Year 2002 (Based on 4 partial tracts)
A) FHA, FSA/RHS & VA Home Purchase Loans
B) Conventional Home Purchase Loans
C) Refinancings
D) Home Improvement Loans
F) Non-occupant Loans on < 5 Family Dwellings (A B C & D)
Number
Average Value
Number
Average Value
Number
Average Value
Number
Average Value
Number
Average Value
LOANS ORIGINATED
128
$167,561
340
$190,985
739
$186,988
31
$37,024
27
$130,663
APPLICATIONS APPROVED, NOT ACCEPTED
2
$137,815
21
$149,439
56
$156,224
12
$34,681
2
$141,470
APPLICATIONS DENIED
5
$161,100
14
$170,375
118
$140,719
21
$24,785
2
$131,740
APPLICATIONS WITHDRAWN
5
$172,186
26
$208,511
99
$173,015
5
$31,672
3
$102,953
FILES CLOSED FOR INCOMPLETENESS
0
$0
2
$168,040
24
$186,441
1
$25,680
1
$71,900
Aggregated Statistics For Year 2001 (Based on 4 partial tracts)
A) FHA, FSA/RHS & VA Home Purchase Loans
B) Conventional Home Purchase Loans
C) Refinancings
D) Home Improvement Loans
F) Non-occupant Loans on < 5 Family Dwellings (A B C & D)
Number
Average Value
Number
Average Value
Number
Average Value
Number
Average Value
Number
Average Value
LOANS ORIGINATED
117
$159,461
339
$158,786
455
$160,461
21
$41,900
13
$127,719
APPLICATIONS APPROVED, NOT ACCEPTED
2
$145,835
18
$161,197
38
$130,491
7
$42,614
1
$115,560
APPLICATIONS DENIED
10
$156,047
22
$156,035
99
$108,113
17
$21,979
3
$103,007
APPLICATIONS WITHDRAWN
9
$148,504
24
$163,492
79
$133,783
4
$28,175
2
$254,750
FILES CLOSED FOR INCOMPLETENESS
0
$0
2
$58,910
20
$122,780
0
$0
1
$8,560
Aggregated Statistics For Year 2000 (Based on 4 partial tracts)
A) FHA, FSA/RHS & VA Home Purchase Loans
B) Conventional Home Purchase Loans
C) Refinancings
D) Home Improvement Loans
F) Non-occupant Loans on < 5 Family Dwellings (A B C & D)
Number
Average Value
Number
Average Value
Number
Average Value
Number
Average Value
Number
Average Value
LOANS ORIGINATED
90
$131,381
282
$149,983
60
$128,654
23
$22,784
10
$117,325
APPLICATIONS APPROVED, NOT ACCEPTED
1
$83,450
13
$164,648
22
$77,700
5
$34,636
0
$0
APPLICATIONS DENIED
9
$105,719
23
$111,767
40
$88,608
11
$35,785
1
$139,690
APPLICATIONS WITHDRAWN
7
$166,357
27
$147,741
18
$75,871
5
$20,540
0
$0
FILES CLOSED FOR INCOMPLETENESS
1
$51,360
3
$219,777
8
$137,220
2
$23,540
0
$0
Aggregated Statistics For Year 1999 (Based on 2 partial tracts)
A) FHA, FSA/RHS & VA Home Purchase Loans
B) Conventional Home Purchase Loans
C) Refinancings
D) Home Improvement Loans
F) Non-occupant Loans on < 5 Family Dwellings (A B C & D)
Detailed PMIC statistics for the following Tracts:7522.00
, 7523.00
2002 - 2018 National Fire Incident Reporting System (NFIRS) incidents
Based on the data from the years 2002 - 2018 the average number of fire incidents per year is 20. The highest number of reported fires - 42 took place in 2017, and the least - 5 in 2002. The data has a growing trend.
When looking into fire subcategories, the most incidents belonged to: Structure Fires (50.6%), and Outside Fires (29.7%).
Fire incident types reported to NFIRS in Zip Code 21710

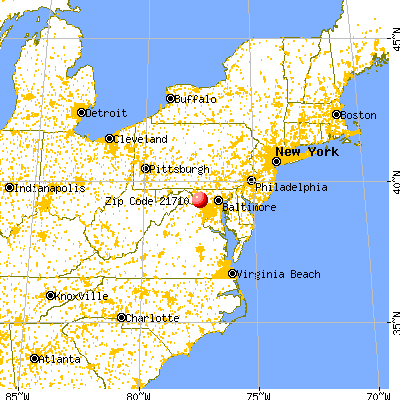


 Nearest zip codes: 21717, 21790, 21703, 21777, 21704, 20838.


 Based on the data from the years 2002 - 2018 the average number of fire incidents per year is 20. The highest number of reported fires - 42 took place in 2017, and the least - 5 in 2002. The data has a growing trend.
 When looking into fire subcategories, the most incidents belonged to: Structure Fires (50.6%), and Outside Fires (29.7%).