Estimated zip code population in 2022: 18,313 Zip code population in 2010: 16,972 Zip code population in 2000: 15,097
Houses and condos: 11,535 Renter-occupied apartments: 9,416
% of renters here:
89%
State:
32%
March 2022 cost of living index in zip code 21201: 108.7 (more than average, U.S. average is 100)
Land area: 1.3 sq. mi. Water area: 0.0 sq. mi.
Population density: 14,194 people per square mile
(very high).
OSM Map
General Map
Google Map
MSN Map
OSM Map
General Map
Google Map
MSN Map
OSM Map
General Map
Google Map
MSN Map
OSM Map
General Map
Google Map
MSN Map
Please wait while loading the map...
Real estate property taxes paid for housing units in 2022:
This zip code:
1.5% ($3,872)
Maryland:
0.9% ($3,777)
Median real estate property taxes paid for housing units with mortgages in 2022: $4,115 (1.4%) Median real estate property taxes paid for housing units with no mortgage in 2022: $2,730 (1.7%)
Averages for the 2020 tax year for zip code 21201, filed in 2021:
Average Adjusted Gross Income (AGI) in 2020: $49,682 (Individual Income Tax Returns)
Here:
$49,682
State:
$86,905
Salary/wage: $45,616 (reported on 89.4% of returns)
Here:
$45,616
State:
$73,953
(% of AGI for various income ranges: 1190.0% for AGIs below $25k, 4054.4% for AGIs $25k-50k, 7509.6% for AGIs $50k-75k, 11644.9% for AGIs $75k-100k, 19655.8% for AGIs $100k-200k, 72996.0% for AGIs over 200k)
Taxable interest for individuals: $774 (reported on 17.5% of returns)
This zip code:
$774
Maryland:
$1,528
(% of AGI for various income ranges: 4.0% for AGIs below $25k, 10.6% for AGIs $25k-50k, 13.4% for AGIs $50k-75k, 22.9% for AGIs $75k-100k, 49.4% for AGIs $100k-200k, 776.0% for AGIs over 200k)
Ordinary dividends: $3,895 (reported on 12.5% of returns)
Here:
$3,895
State:
$8,028
(% of AGI for various income ranges: 6.5% for AGIs below $25k, 14.4% for AGIs $25k-50k, 24.5% for AGIs $50k-75k, 96.6% for AGIs $75k-100k, 261.5% for AGIs $100k-200k, 3804.0% for AGIs over 200k)
Net capital gain/loss in AGI: +$12,007 (reported on 11.6% of returns)
Here:
+$12,007
State:
+$25,238
(% of AGI for various income ranges: 9.3% for AGIs below $25k, 24.6% for AGIs $25k-50k, 44.1% for AGIs $50k-75k, 118.9% for AGIs $75k-100k, 579.7% for AGIs $100k-200k, 14578.0% for AGIs over 200k)
Profit/loss from business: +$6,892 (reported on 15.5% of returns)
Here:
+$6,892
State:
+$11,398
(% of AGI for various income ranges: 82.8% for AGIs below $25k, 87.9% for AGIs $25k-50k, 93.2% for AGIs $50k-75k, 181.1% for AGIs $75k-100k, 364.5% for AGIs $100k-200k, 4058.0% for AGIs over 200k)
Taxable individual retirement arrangement distribution: $29,731 (reported on 2.1% of returns)
21201:
$29,731
Maryland:
$20,944
(% of AGI for various income ranges: 12.6% for AGIs below $25k, 9.5% for AGIs $25k-50k, 40.4% for AGIs $50k-75k, 101.1% for AGIs $75k-100k, 421.8% for AGIs $100k-200k, 4340.0% for AGIs over 200k)
Total itemized deductions: $26,542 (reported on 6.5% of returns)
Here:
$26,542
State:
$30,672
(% of AGI for various income ranges: 26.3% for AGIs below $25k, 78.7% for AGIs $25k-50k, 211.5% for AGIs $50k-75k, 620.3% for AGIs $75k-100k, 1149.7% for AGIs $100k-200k, 6602.0% for AGIs over 200k)
Charity contributions: $10,697 (reported on 5.1% of returns)
Here:
$10,697
State:
$9,065
(% of AGI for various income ranges: 25.9% for AGIs $25k-50k, 59.7% for AGIs $50k-75k, 165.7% for AGIs $75k-100k, 267.0% for AGIs $100k-200k, 3372.0% for AGIs over 200k)
Taxes paid: $7,535 (reported on 6.4% of returns)
21201:
$7,535
State:
$8,475
(% of AGI for various income ranges: 4.4% for AGIs below $25k, 16.7% for AGIs $25k-50k, 72.2% for AGIs $50k-75k, 199.4% for AGIs $75k-100k, 390.3% for AGIs $100k-200k, 1246.0% for AGIs over 200k)
Earned income credit: $2,007 (reported on 21.5% of returns)
Here:
$2,007
State:
$2,151
(% of AGI for various income ranges: 104.1% for AGIs below $25k, 52.3% for AGIs $25k-50k)
Percentage of individuals using paid preparers for their 2020 taxes: 93.0%
Here:
93%
State:
90%
(% for various income ranges: 92.0% for AGIs below $25k, 93.9% for AGIs $25k-50k, 92.8% for AGIs $50k-75k, 94.2% for AGIs $75k-100k, 93.1% for AGIs $100k-200k, 93.3% for AGIs over 200k)
Averages for the 2012 tax year for zip code 21201, filed in 2013:
Average Adjusted Gross Income (AGI) in 2012: $49,271 (Individual Income Tax Returns)
Here:
$49,271
State:
$72,703
Salary/wage: $42,290 (reported on 90.0% of returns)
Here:
$42,290
State:
$62,228
(% of AGI for various income ranges: 85.7% for AGIs below $25k, 94.0% for AGIs $25k-50k, 93.5% for AGIs $50k-75k, 91.4% for AGIs $75k-100k, 84.0% for AGIs $100k-200k, 36.6% for AGIs over 200k)
Taxable interest for individuals: $2,404 (reported on 22.5% of returns)
This zip code:
$2,404
Maryland:
$1,413
(% of AGI for various income ranges: 0.3% for AGIs below $25k, 0.2% for AGIs $25k-50k, 0.2% for AGIs $50k-75k, 0.3% for AGIs $75k-100k, 0.5% for AGIs $100k-200k, 3.6% for AGIs over 200k)
Ordinary dividends: $6,799 (reported on 13.1% of returns)
Here:
$6,799
State:
$6,933
(% of AGI for various income ranges: 1.0% for AGIs below $25k, 0.6% for AGIs $25k-50k, 0.8% for AGIs $50k-75k, 1.0% for AGIs $75k-100k, 2.0% for AGIs $100k-200k, 4.2% for AGIs over 200k)
Net capital gain/loss in AGI: +$12,169 (reported on 10.1% of returns)
Here:
+$12,169
State:
+$14,830
(% of AGI for various income ranges: 0.1% for AGIs below $25k, 0.2% for AGIs $25k-50k, 0.5% for AGIs $50k-75k, 0.6% for AGIs $75k-100k, 1.7% for AGIs $100k-200k, 8.4% for AGIs over 200k)
Profit/loss from business: +$10,571 (reported on 13.2% of returns)
Here:
+$10,571
State:
+$12,606
(% of AGI for various income ranges: 9.3% for AGIs below $25k, 0.9% for AGIs $25k-50k, 1.1% for AGIs $50k-75k, 2.1% for AGIs $75k-100k, 2.4% for AGIs $100k-200k, 3.4% for AGIs over 200k)
Taxable individual retirement arrangement distribution: $18,730 (reported on 3.1% of returns)
21201:
$18,730
Maryland:
$17,065
(% of AGI for various income ranges: 1.1% for AGIs below $25k, 0.7% for AGIs $25k-50k, 0.8% for AGIs $50k-75k, 1.1% for AGIs $75k-100k, 4.3% for AGIs $100k-200k)
Self-employment retirement plans: $24,700 (reported on 0.4% of returns)
21201:
$24,700
Maryland:
$24,439
Total itemized deductions: $24,229 (21% of AGI, reported on 22.5% of returns)
Here:
$24,229
State:
$27,886
Here:
20.5% of AGI
State:
22.8% of AGI
(% of AGI for various income ranges: 4.4% for AGIs below $25k, 6.6% for AGIs $25k-50k, 10.3% for AGIs $50k-75k, 12.5% for AGIs $75k-100k, 13.8% for AGIs $100k-200k, 16.1% for AGIs over 200k)
Charity contributions: $4,915 (reported on 15.6% of returns)
Here:
$4,915
State:
$4,452
(% of AGI for various income ranges: 0.4% for AGIs below $25k, 1.0% for AGIs $25k-50k, 1.5% for AGIs $50k-75k, 1.5% for AGIs $75k-100k, 1.5% for AGIs $100k-200k, 2.6% for AGIs over 200k)
Taxes paid: $11,346 (reported on 22.4% of returns)
21201:
$11,346
State:
$11,690
(% of AGI for various income ranges: 0.9% for AGIs below $25k, 1.6% for AGIs $25k-50k, 3.4% for AGIs $50k-75k, 5.9% for AGIs $75k-100k, 7.2% for AGIs $100k-200k, 9.8% for AGIs over 200k)
Earned income credit: $2,226 (reported on 24.7% of returns)
Here:
$2,226
State:
$2,199
(% of AGI for various income ranges: 8.6% for AGIs below $25k, 0.8% for AGIs $25k-50k)
Percentage of individuals using paid preparers for their 2012 taxes: 39.8%
Here:
40%
State:
52%
(% for various income ranges: 41.7% for AGIs below $25k, 34.9% for AGIs $25k-50k, 34.6% for AGIs $50k-75k, 40.4% for AGIs $75k-100k, 51.2% for AGIs $100k-200k, 75.0% for AGIs over 200k)
Averages for the 2004 tax year for zip code 21201, filed in 2005:
Average Adjusted Gross Income (AGI) in 2004: $40,705 (Individual Income Tax Returns)
Here:
$40,705
State:
$60,339
Salary/wage: $32,387 (reported on 88.2% of returns)
Here:
$32,387
State:
$52,211
(% of AGI for various income ranges: 148.9% for AGIs below $10k, 89.7% for AGIs $10k-25k, 92.8% for AGIs $25k-50k, 89.8% for AGIs $50k-75k, 84.9% for AGIs $75k-100k, 36.7% for AGIs over 100k)
Taxable interest for individuals: $2,818 (reported on 27.2% of returns)
This zip code:
$2,818
Maryland:
$1,701
(% of AGI for various income ranges: 3.3% for AGIs below $10k, 0.8% for AGIs $10k-25k, 0.7% for AGIs $25k-50k, 1.1% for AGIs $50k-75k, 0.5% for AGIs $75k-100k, 3.3% for AGIs over 100k)
Taxable dividends: $13,061 (reported on 15.7% of returns)
Here:
$13,061
State:
$4,235
(% of AGI for various income ranges: 4.9% for AGIs below $10k, 1.5% for AGIs $10k-25k, 1.1% for AGIs $25k-50k, 1.4% for AGIs $50k-75k, 1.9% for AGIs $75k-100k, 10.2% for AGIs over 100k)
Net capital gain/loss: +$30,540 (reported on 12.7% of returns)
Here:
+$30,540
State:
+$15,888
(% of AGI for various income ranges: -1.7% for AGIs below $10k, 0.1% for AGIs $10k-25k, 0.4% for AGIs $25k-50k, 1.1% for AGIs $50k-75k, 2.2% for AGIs $75k-100k, 22.7% for AGIs over 100k)
Profit/loss from business: +$8,308 (reported on 8.7% of returns)
Here:
+$8,308
State:
+$12,221
(% of AGI for various income ranges: 4.2% for AGIs below $10k, 2.0% for AGIs $10k-25k, 0.7% for AGIs $25k-50k, 1.6% for AGIs $50k-75k, 0.6% for AGIs $75k-100k, 2.4% for AGIs over 100k)
IRA payment deduction: $2,284 (reported on 1.5% of returns)
21201:
$2,284
Maryland:
$2,968
(% of AGI for various income ranges: 0.1% for AGIs $10k-25k, 0.1% for AGIs $25k-50k, 0.1% for AGIs $50k-75k, 0.3% for AGIs $75k-100k)
Self-employed pension: $17,250 (reported on 0.4% of returns)
Here:
$17,250
Maryland:
$17,155
Total itemized deductions: $23,378 (22% of AGI, reported on 23.8% of returns)
Here:
$23,378
State:
$22,960
Here:
22.4% of AGI
State:
23.3% of AGI
(% of AGI for various income ranges: 8.3% for AGIs below $10k, 5.9% for AGIs $10k-25k, 12.2% for AGIs $25k-50k, 15.9% for AGIs $50k-75k, 17.1% for AGIs $75k-100k, 15.9% for AGIs over 100k)
Charity contributions deductions: $8,222 (7% of AGI, reported on 18.5% of returns)
Here:
$8,222
State:
$4,031
Here:
6.9% of AGI
State:
3.9% of AGI
(% of AGI for various income ranges: 0.4% for AGIs below $10k, 0.6% for AGIs $10k-25k, 2.1% for AGIs $25k-50k, 2.7% for AGIs $50k-75k, 2.5% for AGIs $75k-100k, 6.4% for AGIs over 100k)
Total tax: $8,386 (reported on 64.6% of returns)
21201:
$8,386
State:
$10,167
(% of AGI for various income ranges: 2.2% for AGIs below $10k, 3.5% for AGIs $10k-25k, 8.1% for AGIs $25k-50k, 12.4% for AGIs $50k-75k, 14.1% for AGIs $75k-100k, 20.3% for AGIs over 100k)
Earned income credit: $1,822 (reported on 26.1% of returns)
Here:
$1,822
State:
$1,700
Percentage of individuals using paid preparers for their 2004 taxes: 50.0%
Here:
50%
State:
55%
(% for various income ranges: 49.9% for AGIs below $10k, 53.8% for AGIs $10k-25k, 43.5% for AGIs $25k-50k, 46.0% for AGIs $50k-75k, 51.2% for AGIs $75k-100k, 66.8% for AGIs over 100k)
Likely homosexual households (counted as self-reported same-sex unmarried-partner households)
Lesbian couples: 0.1% of all households
Gay men: 0.2% of all households
Household received Food Stamps/SNAP in the past 12 months: 3,081 Household did not receive Food Stamps/SNAP in the past 12 months: 7,812
Women who had a birth in the past 12 months: 253 (77 now married, 173 unmarried) Women who did not have a birth in the past 12 months: 5,274 (959 now married, 4,312 unmarried)
Housing units in zip code 21201 with a mortgage: 959 (136 second mortgage, 3 home equity loan, 61 both second mortgage and home equity loan) Median monthly owner costs for units with a mortgage: $1,877 Median monthly owner costs for units without a mortgage: $556
Residents with income below the poverty level in 2022:
This zip code:
33.4%
Whole state:
9.6%
Residents with income below 50% of the poverty level in 2022:
This zip code:
14.5%
Whole state:
4.7%
Median number of rooms in houses and condos:
Here:
6.1
State:
7.3
Median number of rooms in apartments:
Here:
3.2
State:
4.2
Notable locations in this zip code not listed on our city pages
Notable locations in zip code 21201: Lexington Market (A), Kelly Memorial Building (B), Mount Royal Station (C), Mechanic Theater (D), Lyric Opera House (E), Fifth Regiment Armory (F), Arlington Federal Building (G), Penn Station (H), Meyerhoff Symphony Hall (I), Festival Hall (J), First Mariner Arena (K), Charles Theatre (L), Enoch Pratt Free Library (M), Ravenwood Nursing and Rehabilitation Center (N), National Museum of Dentistry (O), Contemporary Museum (P), Eubie Blake National Jazz Center (Q), American Dime Museum (R), Maryland Transit Administration Police Force (S), University of Baltimore Athletic Center (T). Display/hide their locations on the map
Churches in zip code 21201 include: Carters Temple Church of God in Christ (A), Cathedral of the Annunciation Greek Orthodox Church (B), Christian Baptist Church (C), Concord Baptist Church (D), Emmanuel Episcopal Church (E), Eutaw Place Baptist Church (F), First Presbyterian Church (G), Mount Calvary Episcopal Church (H), New Union Baptist Church Number 2 (I). Display/hide their locations on the map
Parks in zip code 21201 include: University Square Park (1), Seton Hill Historic District (2), Cathedral Hill Historic District (3). Display/hide their locations on the map
Tourist attractions (not listed on the city page) : Maryland Historical Society (Museums; 201 West Monument Street), Davis Planetarium (Museums; Light Street & Key Highway), Davis Planetarium - Star Line (Museums; Light Street & Key Highway), Baltimore Streetcar Museum (1905 Falls Road), Baltimore Heritage Inc (Historical Places & Services; 11 West Chase Street), Maryland Science Center (Cultural Attractions- Events- & Facilities; Light Street & Key Highway), INFER (Cultural Attractions- Events- & Facilities; 400 Cathedral Street), Washington Monument & Museum (Cultural Attractions- Events- & Facilities; Mount Vernon Place), The Walter's Art Gallery (Cultural Attractions- Events- & Facilities; 600 North Charles Street).
645 married couples with children.
1,654 single-parent households (103 men, 1,551 women).
84.5% of residents of 21201 zip code speak English at home.
3.5% of residents speak Spanish at home (93% very well, 7% well).
3.8% of residents speak other Indo-European language at home (95% very well, 2% well, 3% not well).
5.1% of residents speak Asian or Pacific Island language at home (77% very well, 13% well, 10% not well).
2.3% of residents speak other language at home (91% very well, 9% well).
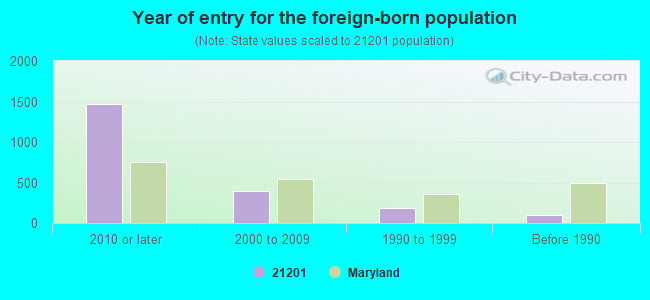
Foreign born population: 1,881 (10.3%) (34.4% of them are naturalized citizens)
Major facilities with environmental interests located in this zip code:
BALTIMORE THERMAL PEAKING PLANT (641 SARATOGA STREET WEST in BALTIMORE, MD)
AIR MAJOR (AIRS/AFS) STATE MASTER (Maryland Permits tracking) - NPDES NON-MAJOR STATE MASTER (Maryland Air Emissions Database) - AIR MAJOR National Pollutant Discharge Elimination System NON-MAJOR (Tracking pollutant discharge elimination systems) - permit Conditionally Exempt Small Quantity Generators, less than 100 kg/month of hazardous waste (Resource Conservation and Recovery Act (tracking hazardous waste)) - notification Business SIC classification: STEAM AND AIR-CONDITIONING SUPPLY Organizations: BALTIMORE THERMAL ENERGY CORP (CONTACT/OWNER)
Alternative names: BTEC SARATOGA STREET PLANT, TRIGEN BALTIMORE ENERGY CORP., TRIGEN-ENERGY BALTIMORE - SARATOGA ST., TRIGEN ENERGY-SARATOGA STREET, TRIGEN - SARATOGA STREET
EUTAW MARSHBURN ELEMENTARY ES 11 (1624 EUTAW PLACE in BALTIMORE, MD)
AIR MINOR (AIRS/AFS) STATE MASTER (Maryland Air Emissions Database) - AIR MINOR (National Center for Education Statistics) - STATE ID-300011 Conditionally Exempt Small Quantity Generators, less than 100 kg/month of hazardous waste (Resource Conservation and Recovery Act (tracking hazardous waste)) - notification Business SIC classification: ELEMENTARY AND SECONDARY SCHOOLS Organizations: BALTIMORE CITY PUBLIC SCHOOLS (CONTACT/OWNER)
ARCHDIOCESE OF BALTIMORE (320 CATHEDRAL ST in BALTIMORE, MD)
ENFORCEMENT/COMPLIANCE ACTIVITY (Integrated Compliance Information System) - ICIS-03-1987-0182, FORMAL ENFORCEMENT ACTION, ICIS-03-1986-0248, (Integrated Compliance Information System) - ICIS-03-1987-0182, FORMAL ENFORCEMENT ACTION, ICIS-03-1986-0248, ENFORCEMENT/COMPLIANCE ACTIVITY (Integrated Compliance Information System) COMPLIANCE ACTIVITY (Tracking inspections of insecticide, fungicide, and rodenticide, and toxic substances)
PATUXENT MATERIALS (1801 MONROE ST SOUTH in BALTIMORE, MD)
AIR MINOR (AIRS/AFS) STATE MASTER (Maryland Permits tracking) - NPDES STORMWATER PERMIT STATE MASTER (Maryland Air Emissions Database) - AIR MAJOR Business SIC classification: CRUSHED AND BROKEN STONE Alternative names: PATUXENT MATERIALS, INC. - BALTIMORE, PATUXENT RECYCLERS-BALTIMORE
BP - 427 WEST MULBERRY STREET (427 MULBERRY STREET, WEST in BALTIMORE, MD)
AIR MINOR (AIRS/AFS) STATE MASTER (Maryland Air Emissions Database) - AIR MINOR Small Quantity Generators, between 100 kg and 1000 kg of hazardous waste/month (Resource Conservation and Recovery Act (tracking hazardous waste)) - notification Business SIC classification: GASOLINE SERVICE STATIONS Organizations: OPERNAME (CONTACT/OPERATOR)
, AMOCO OIL COMPANY (CONTACT/OWNER)
Alternative names: AMOCO 427 WEST MULBERRY STREET, AMOCO #34-TANKS, AMOCO STATION, CITGO
MARYLAND GENERAL HOSPITAL (827 LINDEN AVENUE in BALTIMORE, MD)
AIR MINOR (AIRS/AFS) STATE MASTER (Maryland Air Emissions Database) - AIR MINOR COMPLIANCE ACTIVITY (Tracking inspections of insecticide, fungicide, and rodenticide, and toxic substances) Small Quantity Generators, between 100 kg and 1000 kg of hazardous waste/month (Resource Conservation and Recovery Act (tracking hazardous waste)) - notification Business SIC classification: ELECTRIC SERVICES; GENERAL MEDICAL AND SURGICAL HOSPITALS Organizations: OPERNAME (CONTACT/OPERATOR)
Alternative names: BALTIMORE GAS AND ELECTRIC-MD GEN'L HOSP
PARK SIGN COMPANY (878 PARK AVENUE in BALTIMORE, MD)
AIR MINOR (AIRS/AFS) STATE MASTER (Maryland Air Emissions Database) - AIR MINOR Large Quantity Generators, more that 1000 kg of hazardous waste/month (Resource Conservation and Recovery Act (tracking hazardous waste)) - notification Business SIC classification: SIGNS AND ADVERTISING SPECIALTIES Organizations: OPERNAME (CONTACT/OPERATOR)
, PARK SIGN CO INC (CONTACT/OWNER)
ALADDIN CLEANERS - 1212 CHARLES ST. (1212 CHARLES STREET, NORTH in BALTIMORE, MD)
AIR MINOR (AIRS/AFS) STATE MASTER (Maryland tracking) - HAZARDOUS WASTE PROGRAM (Resource Conservation and Recovery Act (tracking hazardous waste)) Business SIC classification: DRYCLEANING PLANTS, EXCEPT RUG CLEANING Organizations: OPERNAME (CONTACT/OPERATOR)
, FISHMAN, GLADYS & QUEEN ANNE BELVEDERE (CONTACT/OWNER)
MERIT OIL 1801 N CHARLES STREET (1801 CHARLES STREET, NORTH in BALTIMORE, MD)
AIR MINOR (AIRS/AFS) STATE MASTER (Maryland Air Emissions Database) - AIR MINOR Small Quantity Generators, between 100 kg and 1000 kg of hazardous waste/month (Resource Conservation and Recovery Act (tracking hazardous waste)) - notification Business SIC classification: GASOLINE SERVICE STATIONS Organizations: OPERNAME (CONTACT/OPERATOR)
, MERIT OIL CORP (CONTACT/OWNER)
Alternative names: HESS, MERIT OIL CORP-BALTIMORE
PARK AVENUE CLEANERS (219 PARK AVENUE in BALTIMORE, MD)
AIR MINOR (AIRS/AFS) STATE MASTER (Maryland Air Emissions Database) - AIR MINOR Conditionally Exempt Small Quantity Generators, less than 100 kg/month of hazardous waste (Resource Conservation and Recovery Act (tracking hazardous waste)) - notification Business SIC classification: DRYCLEANING PLANTS, EXCEPT RUG CLEANING Organizations: OPERNAME (CONTACT/OPERATOR)
, UM, SOONG YOUNG (CONTACT/OWNER)
PAUL COMPANY INC (510 PENNSYLVANIA AVE in BALTIMORE, MD)
STATE MASTER (Maryland Permits tracking) - NPDES STORMWATER PERMIT (Resource Conservation and Recovery Act (tracking hazardous waste)) Business SIC classification: MISCELLANEOUS PUBLISHING Business NAICS classification: COMMERCIAL LITHOGRAPHIC PRINTING. Organizations: OPERNAME (CONTACT/OPERATOR)
CARL MESSENGER SERVICE INCORPORATED (829 BALTIMORE STREET, WEST in BALTIMORE, MD)
AIR MINOR (AIRS/AFS) STATE MASTER (Maryland Air Emissions Database) - AIR MINOR Small Quantity Generators, between 100 kg and 1000 kg of hazardous waste/month (Resource Conservation and Recovery Act (tracking hazardous waste)) - notification Business SIC classification: BUSINESS SERVICES Organizations: PARR CARL (CONTACT/OWNER)
Alternative names: CARLS MESSENGER SERVICE
BANK JOSEPH A & COMPANY (113 NORTH AVENUE, WEST in BALTIMORE, MD)
AIR MINOR (AIRS/AFS) STATE MASTER (Maryland Air Emissions Database) - AIR MINOR Small Quantity Generators, between 100 kg and 1000 kg of hazardous waste/month (Resource Conservation and Recovery Act (tracking hazardous waste)) - notification Business SIC classification: MEN'S AND BOYS' SUITS, COATS, AND OVERCOATS Organizations: JOS A BANK MFG CO (CONTACT/OWNER)
Alternative names: JOS A BANK MFG CO
Housing units lacking complete plumbing facilities: 1.6% Housing units lacking complete kitchen facilities: 2.1%
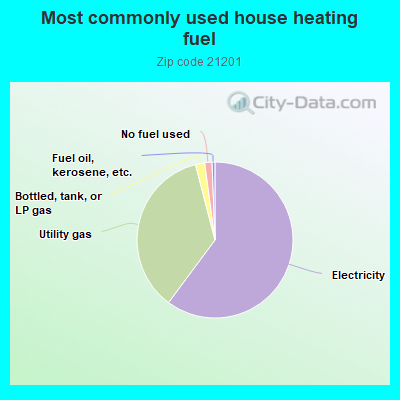
60.0%Electricity
35.7%Utility gas
1.9%Bottled, tank, or LP gas
1.5%No fuel used
0.6%Fuel oil, kerosene, etc.
Population in 1990: 16,256.
Place of birth for U.S.-born residents:
This state: 10,590
Northeast: 2,217
Midwest: 728
South: 2,140
West: 609
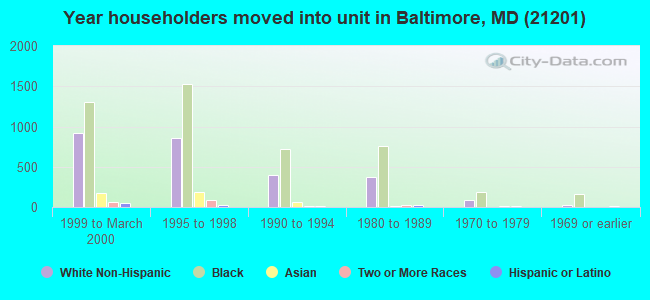
41% of the 21201 zip code residents lived in the same house 5 years ago. Out of people who lived in different houses, 57% lived in this county. Out of people who lived in different counties, 50% lived in Maryland.
80% of the 21201 zip code residents lived in the same house 1 year ago. Out of people who lived in different houses, 49% moved from this county. Out of people who lived in different houses, 18% moved from different county within same state. Out of people who lived in different houses, 23% moved from different state. Out of people who lived in different houses, 5% moved from abroad.
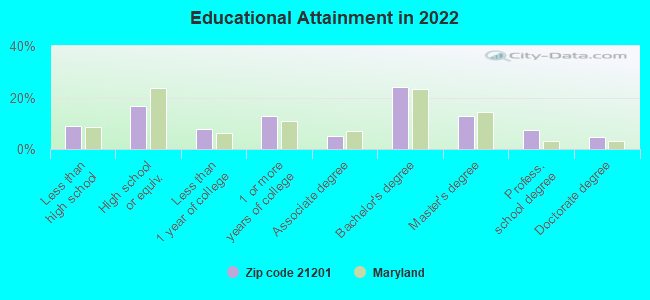
Private vs. public school enrollment:
Students in private schools in grades 1 to 8 (elementary and middle school): 117
Here:
8.9%
Maryland:
15.2%
Students in private schools in grades 9 to 12 (high school): 96
Here:
15.4%
Maryland:
14.4%
Students in private undergraduate colleges: 300
Here:
30.2%
Maryland:
20.2%
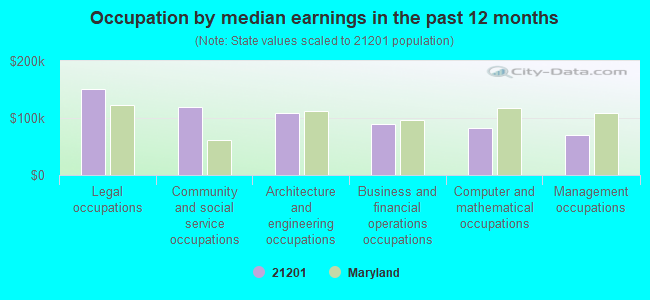
Occupation by median earnings in the past 12 months ($)
150,374Legal occupations
119,366Community and social service occupations
108,503Architecture and engineering occupations
89,379Business and financial operations occupations
82,718Computer and mathematical occupations
70,264Management occupations
Companies with biggest federal contracts located in this zip code (BALTIMORE, MD):
NORTHEAST MARYLAND WASTE DISPO (100 SOUTH CHARLES STREET,) : $34,021,410 in 14 contractsfrom 1999 to 2005
Contracts for Other Utilities, Facilities Operations Support Services by Army Signed by year:2000: $7,200,000; 2001: $500,000; 2002: $5,592,328; 2003: $5,000,000; 2004: $5,096,890; 2005: $5,467,117; 2006: $0.
Biggest contracts:
$5,537,800 with Army for Other Utilities. Signed on 2002-11-14. Completion date: 2001-09-30.
$5,198,859 with Army for Facilities Operations Support Services. Signed on 2005-10-27. Completion date: 2001-09-30.
$5,096,890, same as above.Signed on 2004-11-01. Completion date: 2001-09-30.
$5,000,000 with Army for Other Utilities. Signed on 2003-11-25. Completion date: 2001-09-30.
UNIVERSITY SYSTEM OF MARYLAND (0000) (511 W LUMBER ST) : $32,398,108 in 78 contractsfrom 1999 to 2006
Contracts for Biomedical -- Basic Research (R&D), Orthopedic Services, Services -- Basic Research (R&D), General Health Care Services, and moreby National Institutes of Health, Department of Veterans Affairs, Department of State, Army, and others Signed by year:2000: $4,352,500; 2001: $4,389,000; 2002: $6,787,964; 2003: $4,780,825; 2004: $4,292,550; 2005: $3,937,193; 2006: $1,416,576.
Biggest contracts:
$2,766,000 with National Institutes of Health for Biomedical -- Basic Research (R&D). Signed on 2000-09-15. Completion date: 2003-09-15.
$1,869,129 with Department of Veterans Affairs for Orthopedic Services. Signed on 2002-10-15. Completion date: 2003-09-15.
$1,646,015 with National Institutes of Health for Services -- Basic Research (R&D). Signed on 2005-07-05. Completion date: 2006-04-30.
$1,587,000 with Department of Veterans Affairs for General Health Care Services. Signed on 1999-10-15. Completion date: 2000-09-15.
UNIVERSITY OF MARYLAND BALT PR (NOT AVAILABLE) : $20,544,280 in 67 contractsfrom 1999 to 2006
Contracts for Biomedical -- Basic Research (R&D), Other Medical Services, Services -- Management and Support (R&D), Operation of Government-Owned Facilities -- Miscellaneous Buildings, and moreby National Institutes of Health, Department of Veterans Affairs, Centers for Disease Control and Prevention Signed by year:2000: $7,525,000; 2001: $5,968,000; 2002: $2,234,000; 2003: $2,223,364; 2004: $1,413,545; 2005: $131,412; 2006: -$5,041.
Biggest contracts:
$1,645,000 with National Institutes of Health for Biomedical -- Basic Research (R&D). Signed on 2001-03-15. Completion date: 2002-03-15.
$1,645,000 with Department of Veterans Affairs for Other Medical Services. Signed on 2000-10-15. Completion date: 2001-09-15.
$1,245,000, same as above.Signed on 2000-09-15. Completion date: 2000-09-15.
$1,188,000, same as above.Signed on 2000-10-15. Completion date: 2001-10-15.
TRIGEN DEVELOPMENT CORPORATION (ONE NORTH CHARLES STREET) : $7,129,943 in 19 contractsfrom 2000 to 2005
Contracts for Other Utilities, Utilities, Gas Services, Maintenance, Repair or Alteration of Real Property -- Recreational Buildings, and moreby Air Force, Public Buildings Service, ENERGY, Department of Signed by year:2000: $139,247; 2001: $1,867,079; 2002: $995,588; 2003: $3,994,437; 2004: $50,000; 2005: $83,592; 2006: $0.
Biggest contracts:
$3,500,000 with Air Force for Other Utilities. Taking place in IN. Signed on 2003-07-31. Completion date: 2003-08-30.
$917,795, same as above.Signed on 2002-10-01. Completion date: 2003-09-30.
$913,258, same as above.Signed on 2001-10-01. Completion date: 2002-09-30.
$908,809 with Air Force for Utilities. Taking place in IN. Signed on 2001-09-30. Completion date: 2002-09-30.
UNIVERSITY OF MARYLAND AT BALT (511 W. LOMBARD) : $2,951,491 in 4 contractsfrom 2004 to 2006
$988,860 with National Institutes of Health for Biomedical -- Applied Research and Exploratory Development (R&D). Signed on 2005-07-19. Completion date: 2009-05-14.
$951,596, same as above.Signed on 2006-06-30. Effective on 2006-07-15. Completion date: 2009-05-14.
$923,529, same as above.Signed on 2004-09-29. Completion date: 2009-05-14.
$87,506 with Army for Educational Services. Signed on 2006-02-07. Completion date: 2006-09-29.
JACOBS CIVIL INC (100 SOUTH CHARLES STREET) : $1,785,496 in 5 contractsfrom 2001 to 2003
Contracts for Other Architect and Engineering Services, Architect - Engineer Services (including landscaping, interior layout, and designing) by Army Signed by year:2000: $0; 2001: $1,815,068; 2002: $0; 2003: -$29,572; 2004: $0; 2005: $0; 2006: $0.
Biggest contracts:
$993,949 with Army for Other Architect and Engineering Services. Taking place in DC. Signed on 2001-01-23. Completion date: 2002-05-10.
$333,340 with Army for Architect - Engineer Services (including landscaping, interior layout, and designing). Taking place in DC. Signed on 2001-06-14. Completion date: 2002-07-05.
$310,108, same as above.Signed on 2001-03-06. Completion date: 2002-05-10.
$177,671, same as above.Signed on 2001-03-01. Completion date: 2002-05-10.
BALTIMORE, CITY OF (1 W PRATT ST) : $1,507,064 in 17 contractsfrom 2000 to 2006
Contracts for Lease or Rental of Facilities -- Conference Space and Facilities, Other Professional Services, Lease or Rental of Facilities -- Museums and Exhibition Buildings, Lease or Rental of Facilities -- Other Administrative Facilities and Service Buildings, and moreby Office of Personnel Management, Army, National Institute of Standards and Technology, U.S. Army Corps of Engineers - civil program financing only, and others Signed by year:2000: $76,160; 2001: $0; 2002: $56,255; 2003: $16,836; 2004: $559,227; 2005: $2,522; 2006: $796,064.
Biggest contracts:
$650,000 with Office of Personnel Management for Lease or Rental of Facilities -- Conference Space and Facilities. Signed on 2006-02-24. Completion date: 2006-03-02.
$500,000 with Office of Personnel Management for Other Professional Services. Signed on 2004-09-01. Completion date: 2004-09-30.
$82,488 with Office of Personnel Management for Lease or Rental of Facilities -- Conference Space and Facilities. Signed on 2006-06-09. Completion date: 2006-06-09.
$59,125 with Office of Personnel Management for Lease or Rental of Facilities -- Museums and Exhibition Buildings. Signed on 2004-04-01. Completion date: 2004-09-30.
JOHNS HOPKINS UNIVERSITY (201 N CHARLES ST STE 310) : $969,630 in 11 contractsfrom 2000 to 2005
Contracts for Education Services, Other Medical Services, Tuition, Registration, and Membership Fees by U.S. Secret Service (disused code: now 7009), U.S. Secret Service Signed by year:2000: $120,000; 2001: $143,000; 2002: $281,000; 2003: $324,100; 2004: $49,480; 2005: $52,050; 2006: $0.
Biggest contracts:
$281,000 with U.S. Secret Service (disused code: now 7009) for Education Services. Taking place in DC. Signed on 2002-09-15. Completion date: 2004-06-15.
$246,400 with U.S. Secret Service for Education Services. Taking place in DC. Signed on 2003-06-15. Completion date: 2003-07-15.
$77,700, same as above.Signed on 2003-04-15. Completion date: 2007-09-15.
$75,000 with U.S. Secret Service (disused code: now 7009) for Other Medical Services. Signed on 2001-09-15. Completion date: 2002-09-15.
LOUDEN ASSOCIATES, INC (351 WEST CAMDEN STREET; small business) : $783,559 in 4 contractsfrom 2000 to 2001
$446,826 with Navy for Engineering and Technical Services. Signed on 2000-06-01. Completion date: 2000-10-31.
$393,915, same as above.Signed on 2000-06-29. Completion date: 2001-03-31.
$94,117, same as above.Signed on 2001-01-17. Completion date: 2001-01-31.
-$151,299, same as above.Signed on 2000-09-28. Completion date: 2000-12-31.
HEALTH & MENTAL HYGIENE, MARYL (201 W PRESTON ST) : $682,290 in 19 contractsfrom 2003 to 2006
Contracts for Books and Pamphlets, Other Quality Control, Testing and Inspection Services -- Miscellaneous, Laboratory Testing Services by Centers for Medicare & Medicaid Services, Food and Drug Administration, Army Signed by year:2000: $0; 2001: $0; 2002: $0; 2003: $222,454; 2004: $259,878; 2005: $151,853; 2006: $48,105.
Biggest contracts:
$222,454 with Centers for Medicare & Medicaid Services for Books and Pamphlets. Signed on 2003-08-15. Completion date: 2005-10-15.
$135,378 with Food and Drug Administration for Other Quality Control, Testing and Inspection Services -- Miscellaneous. Signed on 2005-06-28. Effective on 2005-07-01. Completion date: 2006-06-30.
$133,878, same as above.Signed on 2004-08-03. Completion date: 2005-06-30.
$81,000 with Army for Laboratory Testing Services. Signed on 2004-10-01. Completion date: 2005-09-30.
Top industries in this zip code by the number of employees in 2005:
Health Care and Social Assistance: General Medical and Surgical Hospitals (over 1000 employees: 3 establishments)
Other Services (except Public Administration): Religious Organizations (250-499: 1, 100-249: 1, 50-99: 5, 20-49: 6, 10-19: 10, 5-9: 22, 1-4: 11)
Health Care and Social Assistance: Offices of Physicians (except Mental Health Specialists) (500-999: 1, 50-99: 2, 20-49: 4, 10-19: 7, 5-9: 10, 1-4: 33)
Utilities: Electric Power Distribution (500-999: 1, 100-249: 2)
Professional, Scientific, and Technical Services: Offices of Certified Public Accountants (100-249: 3, 50-99: 3, 20-49: 4, 10-19: 4, 5-9: 4, 1-4: 5)
Administrative and Support and Waste Management and Remediation Services: Temporary Help Services (100-249: 4, 50-99: 1, 20-49: 5, 10-19: 2, 5-9: 1, 1-4: 3)
Accommodation and Food Services: Food Service Contractors (250-499: 2, 50-99: 1, 10-19: 4, 5-9: 3, 1-4: 7)
People in group quarters in 2010:
386 people in college/university student housing
95 people in other noninstitutional facilities
33 people in emergency and transitional shelters (with sleeping facilities) for people experiencing homelessness
18 people in group homes intended for adults
17 people in in-patient hospice facilities
14 people in correctional residential facilities
6 people in group homes for juveniles (non-correctional)
People in group quarters in 2000:
758 people in college dormitories (includes college quarters off campus)
453 people in other noninstitutional group quarters
270 people in nursing homes
97 people in other group homes
79 people in wards in general hospitals for patients who have no usual home elsewhere
70 people in hospitals/wards and hospices for chronically ill
62 people in mental (psychiatric) hospitals or wards
48 people in military hospitals or wards for chronically ill
29 people in schools, hospitals, or wards for the intellectually disabled
22 people in hospices or homes for chronically ill
11 people in religious group quarters
10 people in halfway houses
6 people in homes or halfway houses for drug/alcohol abuse
Fatal accident statistics in 2013:
Fatal accident count: 1
Vehicles involved in fatal accidents: 2
Fatal accidents caused by drunken drivers: 0
Fatalities: 1
Persons involved in fatal accidents: 3
Pedestrians involved in fatal accidents: 0
Fatal accident statistics in 2012:
Fatal accident count: 4
Vehicles involved in fatal accidents: 5
Fatal accidents caused by drunken drivers: 1
Fatalities: 4
Persons involved in fatal accidents: 6
Pedestrians involved in fatal accidents: 1
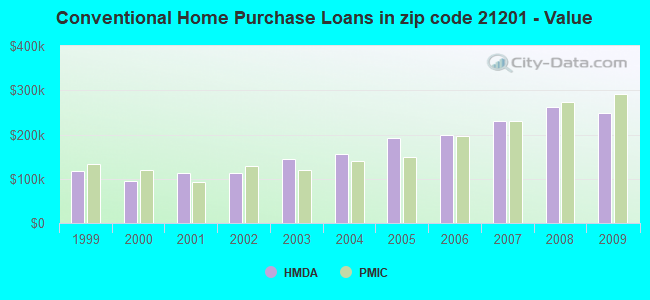
Home Mortgage Disclosure Act Aggregated Statistics For Year 2009 (Based on 2 full and 18 partial tracts)
A) FHA, FSA/RHS & VA Home Purchase Loans
B) Conventional Home Purchase Loans
C) Refinancings
D) Home Improvement Loans
E) Loans on Dwellings For 5+ Families
F) Non-occupant Loans on < 5 Family Dwellings (A B C & D)
Number
Average Value
Number
Average Value
Number
Average Value
Number
Average Value
Number
Average Value
Number
Average Value
LOANS ORIGINATED
62
$223,916
70
$248,985
227
$232,409
11
$159,927
9
$738,692
51
$177,143
APPLICATIONS APPROVED, NOT ACCEPTED
3
$219,037
10
$257,730
30
$217,854
1
$155,270
0
$0
4
$266,910
APPLICATIONS DENIED
12
$203,840
16
$183,479
108
$247,042
12
$173,479
3
$4,995,770
22
$182,640
APPLICATIONS WITHDRAWN
6
$224,243
9
$356,419
56
$236,126
1
$24,980
1
$6,018,080
13
$190,828
FILES CLOSED FOR INCOMPLETENESS
5
$168,922
2
$458,330
23
$214,809
1
$36,320
1
$138,740
4
$234,302
Aggregated Statistics For Year 2008 (Based on 2 full and 18 partial tracts)
A) FHA, FSA/RHS & VA Home Purchase Loans
B) Conventional Home Purchase Loans
C) Refinancings
D) Home Improvement Loans
E) Loans on Dwellings For 5+ Families
F) Non-occupant Loans on < 5 Family Dwellings (A B C & D)
G) Loans On Manufactured Home Dwelling (A B C & D)
Number
Average Value
Number
Average Value
Number
Average Value
Number
Average Value
Number
Average Value
Number
Average Value
Number
Average Value
LOANS ORIGINATED
31
$239,105
235
$262,462
165
$213,347
18
$122,432
19
$776,002
104
$226,415
0
$0
APPLICATIONS APPROVED, NOT ACCEPTED
2
$315,095
40
$346,157
41
$198,327
5
$104,278
0
$0
26
$213,938
0
$0
APPLICATIONS DENIED
8
$189,160
104
$258,789
140
$211,070
29
$72,364
4
$3,584,205
73
$228,583
1
$234,640
APPLICATIONS WITHDRAWN
6
$274,307
77
$301,992
59
$209,504
4
$190,015
1
$155,640
36
$231,720
0
$0
FILES CLOSED FOR INCOMPLETENESS
0
$0
21
$211,818
18
$218,006
4
$124,100
1
$1,308,380
16
$221,976
0
$0
Aggregated Statistics For Year 2007 (Based on 2 full and 18 partial tracts)
A) FHA, FSA/RHS & VA Home Purchase Loans
B) Conventional Home Purchase Loans
C) Refinancings
D) Home Improvement Loans
E) Loans on Dwellings For 5+ Families
F) Non-occupant Loans on < 5 Family Dwellings (A B C & D)
G) Loans On Manufactured Home Dwelling (A B C & D)
Number
Average Value
Number
Average Value
Number
Average Value
Number
Average Value
Number
Average Value
Number
Average Value
Number
Average Value
LOANS ORIGINATED
10
$256,739
272
$230,120
226
$193,691
41
$128,636
48
$2,869,819
147
$193,907
0
$0
APPLICATIONS APPROVED, NOT ACCEPTED
1
$481,720
56
$211,052
49
$169,566
8
$194,734
3
$351,193
25
$197,980
2
$71,735
APPLICATIONS DENIED
1
$206,500
114
$217,832
205
$177,396
19
$102,626
5
$376,350
98
$173,045
0
$0
APPLICATIONS WITHDRAWN
2
$273,335
43
$234,272
95
$179,041
14
$114,483
4
$2,112,000
33
$200,308
0
$0
FILES CLOSED FOR INCOMPLETENESS
0
$0
16
$325,284
17
$172,685
6
$102,990
0
$0
11
$340,893
0
$0
Aggregated Statistics For Year 2006 (Based on 2 full and 18 partial tracts)
A) FHA, FSA/RHS & VA Home Purchase Loans
B) Conventional Home Purchase Loans
C) Refinancings
D) Home Improvement Loans
E) Loans on Dwellings For 5+ Families
F) Non-occupant Loans on < 5 Family Dwellings (A B C & D)
G) Loans On Manufactured Home Dwelling (A B C & D)
Number
Average Value
Number
Average Value
Number
Average Value
Number
Average Value
Number
Average Value
Number
Average Value
Number
Average Value
LOANS ORIGINATED
13
$197,084
394
$198,630
314
$177,914
39
$106,672
33
$1,597,231
208
$178,357
0
$0
APPLICATIONS APPROVED, NOT ACCEPTED
0
$0
55
$185,564
54
$138,368
14
$89,800
3
$580,383
34
$118,806
0
$0
APPLICATIONS DENIED
5
$175,768
161
$150,361
205
$162,835
30
$74,225
4
$596,300
97
$121,787
2
$78,930
APPLICATIONS WITHDRAWN
1
$252,420
73
$197,049
123
$151,408
8
$142,741
2
$869,880
36
$210,094
0
$0
FILES CLOSED FOR INCOMPLETENESS
1
$147,590
16
$154,027
33
$160,690
5
$46,034
0
$0
8
$117,045
0
$0
Aggregated Statistics For Year 2005 (Based on 2 full and 18 partial tracts)
A) FHA, FSA/RHS & VA Home Purchase Loans
B) Conventional Home Purchase Loans
C) Refinancings
D) Home Improvement Loans
E) Loans on Dwellings For 5+ Families
F) Non-occupant Loans on < 5 Family Dwellings (A B C & D)
G) Loans On Manufactured Home Dwelling (A B C & D)
Number
Average Value
Number
Average Value
Number
Average Value
Number
Average Value
Number
Average Value
Number
Average Value
Number
Average Value
LOANS ORIGINATED
7
$118,457
327
$191,262
310
$171,896
41
$140,623
31
$988,116
189
$152,776
0
$0
APPLICATIONS APPROVED, NOT ACCEPTED
3
$110,860
55
$150,380
70
$154,622
11
$36,034
1
$439,530
30
$158,693
1
$54,000
APPLICATIONS DENIED
5
$192,568
96
$180,991
173
$154,188
27
$97,540
3
$745,383
67
$203,991
4
$42,700
APPLICATIONS WITHDRAWN
1
$103,910
60
$163,497
158
$141,769
13
$129,842
3
$1,086,253
31
$157,494
0
$0
FILES CLOSED FOR INCOMPLETENESS
0
$0
16
$149,192
32
$241,680
2
$240,970
0
$0
9
$167,994
1
$294,390
Aggregated Statistics For Year 2004 (Based on 2 full and 18 partial tracts)
A) FHA, FSA/RHS & VA Home Purchase Loans
B) Conventional Home Purchase Loans
C) Refinancings
D) Home Improvement Loans
E) Loans on Dwellings For 5+ Families
F) Non-occupant Loans on < 5 Family Dwellings (A B C & D)
G) Loans On Manufactured Home Dwelling (A B C & D)
Number
Average Value
Number
Average Value
Number
Average Value
Number
Average Value
Number
Average Value
Number
Average Value
Number
Average Value
LOANS ORIGINATED
19
$161,229
272
$156,824
339
$162,221
32
$95,750
23
$1,014,473
159
$129,791
0
$0
APPLICATIONS APPROVED, NOT ACCEPTED
5
$109,484
45
$179,462
73
$109,251
9
$54,847
3
$1,016,593
17
$114,456
1
$74,340
APPLICATIONS DENIED
6
$156,137
91
$148,099
181
$124,911
49
$40,767
3
$1,476,530
61
$143,622
3
$48,310
APPLICATIONS WITHDRAWN
4
$94,050
38
$138,928
115
$138,492
12
$86,184
7
$566,381
23
$136,808
0
$0
FILES CLOSED FOR INCOMPLETENESS
2
$244,695
14
$168,529
29
$154,127
1
$100,000
0
$0
4
$111,215
0
$0
Aggregated Statistics For Year 2003 (Based on 2 full and 18 partial tracts)
A) FHA, FSA/RHS & VA Home Purchase Loans
B) Conventional Home Purchase Loans
C) Refinancings
D) Home Improvement Loans
E) Loans on Dwellings For 5+ Families
F) Non-occupant Loans on < 5 Family Dwellings (A B C & D)
Number
Average Value
Number
Average Value
Number
Average Value
Number
Average Value
Number
Average Value
Number
Average Value
LOANS ORIGINATED
113
$100,176
229
$144,864
509
$148,193
16
$38,697
21
$369,779
124
$121,863
APPLICATIONS APPROVED, NOT ACCEPTED
6
$106,890
27
$156,959
80
$133,319
9
$39,088
1
$27,140
19
$156,272
APPLICATIONS DENIED
7
$84,349
52
$90,815
152
$124,849
15
$15,463
3
$193,403
40
$115,568
APPLICATIONS WITHDRAWN
12
$89,754
29
$131,017
83
$115,520
1
$84,290
1
$800,000
22
$80,650
FILES CLOSED FOR INCOMPLETENESS
3
$70,773
5
$154,712
26
$139,231
1
$15,060
0
$0
10
$88,827
Aggregated Statistics For Year 2002 (Based on 2 full and 16 partial tracts)
A) FHA, FSA/RHS & VA Home Purchase Loans
B) Conventional Home Purchase Loans
C) Refinancings
D) Home Improvement Loans
E) Loans on Dwellings For 5+ Families
F) Non-occupant Loans on < 5 Family Dwellings (A B C & D)
Number
Average Value
Number
Average Value
Number
Average Value
Number
Average Value
Number
Average Value
Number
Average Value
LOANS ORIGINATED
109
$93,030
116
$112,364
157
$127,864
10
$88,484
15
$442,939
48
$121,626
APPLICATIONS APPROVED, NOT ACCEPTED
15
$80,166
20
$118,913
32
$78,972
5
$30,880
4
$235,915
12
$112,437
APPLICATIONS DENIED
8
$107,742
34
$108,976
102
$76,778
12
$48,261
0
$0
34
$96,702
APPLICATIONS WITHDRAWN
29
$97,378
23
$158,199
48
$90,713
3
$9,237
3
$265,763
9
$129,034
FILES CLOSED FOR INCOMPLETENESS
0
$0
5
$156,464
10
$77,985
1
$29,050
0
$0
5
$103,526
Aggregated Statistics For Year 2001 (Based on 2 full and 16 partial tracts)
A) FHA, FSA/RHS & VA Home Purchase Loans
B) Conventional Home Purchase Loans
C) Refinancings
D) Home Improvement Loans
E) Loans on Dwellings For 5+ Families
F) Non-occupant Loans on < 5 Family Dwellings (A B C & D)
Number
Average Value
Number
Average Value
Number
Average Value
Number
Average Value
Number
Average Value
Number
Average Value
LOANS ORIGINATED
31
$99,110
104
$111,962
106
$110,962
19
$23,178
13
$1,452,873
58
$101,591
APPLICATIONS APPROVED, NOT ACCEPTED
2
$79,090
17
$112,878
32
$85,688
5
$12,278
3
$132,473
14
$71,028
APPLICATIONS DENIED
3
$99,803
51
$61,806
111
$84,426
22
$21,393
3
$412,533
38
$63,675
APPLICATIONS WITHDRAWN
6
$74,820
25
$110,774
43
$84,417
6
$18,372
4
$788,085
14
$85,511
FILES CLOSED FOR INCOMPLETENESS
1
$54,220
5
$111,614
12
$67,805
3
$34,693
0
$0
3
$130,770
Aggregated Statistics For Year 2000 (Based on 2 full and 16 partial tracts)
A) FHA, FSA/RHS & VA Home Purchase Loans
B) Conventional Home Purchase Loans
C) Refinancings
D) Home Improvement Loans
E) Loans on Dwellings For 5+ Families
F) Non-occupant Loans on < 5 Family Dwellings (A B C & D)
Number
Average Value
Number
Average Value
Number
Average Value
Number
Average Value
Number
Average Value
Number
Average Value
LOANS ORIGINATED
30
$77,451
96
$95,596
67
$71,893
11
$23,295
15
$1,236,446
50
$76,899
APPLICATIONS APPROVED, NOT ACCEPTED
3
$111,163
25
$97,498
20
$69,224
9
$16,647
3
$2,985,990
7
$112,750
APPLICATIONS DENIED
9
$89,407
60
$75,835
128
$72,285
26
$17,241
0
$0
43
$73,640
APPLICATIONS WITHDRAWN
4
$67,035
37
$87,968
46
$103,218
8
$7,901
1
$42,220
20
$63,155
FILES CLOSED FOR INCOMPLETENESS
1
$209,800
8
$69,550
9
$61,181
1
$14,870
0
$0
1
$120,000
Aggregated Statistics For Year 1999 (Based on 2 full and 9 partial tracts)
A) FHA, FSA/RHS & VA Home Purchase Loans
B) Conventional Home Purchase Loans
C) Refinancings
D) Home Improvement Loans
E) Loans on Dwellings For 5+ Families
F) Non-occupant Loans on < 5 Family Dwellings (A B C & D)
2002 - 2018 National Fire Incident Reporting System (NFIRS) incidents
Based on the data from the years 2002 - 2018 the average number of fire incidents per year is 89. The highest number of reported fires - 176 took place in 2002, and the least - 0 in 2003. The data has a decreasing trend.
When looking into fire subcategories, the most incidents belonged to: Structure Fires (40.1%), and Outside Fires (40.1%).
Fire incident types reported to NFIRS in Zip Code 21201


 Nearest zip codes: 21202, 21217, 21230, 21231, 21223, 21211.


 Based on the data from the years 2002 - 2018 the average number of fire incidents per year is 89. The highest number of reported fires - 176 took place in 2002, and the least - 0 in 2003. The data has a decreasing trend.
 When looking into fire subcategories, the most incidents belonged to: Structure Fires (40.1%), and Outside Fires (40.1%).