Estimated zip code population in 2022: 8,984 Zip code population in 2010: 11,088 Zip code population in 2000: 10,223
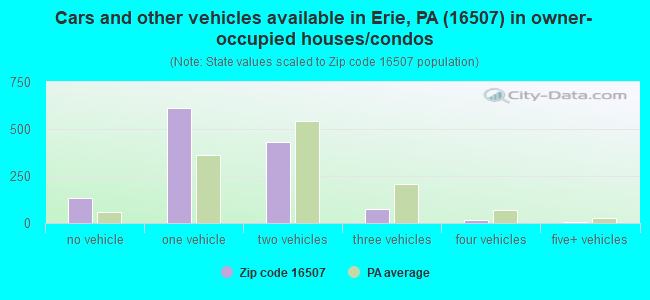
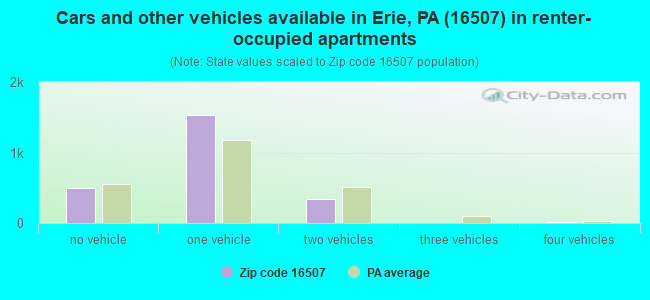
Houses and condos: 4,217 Renter-occupied apartments: 2,379
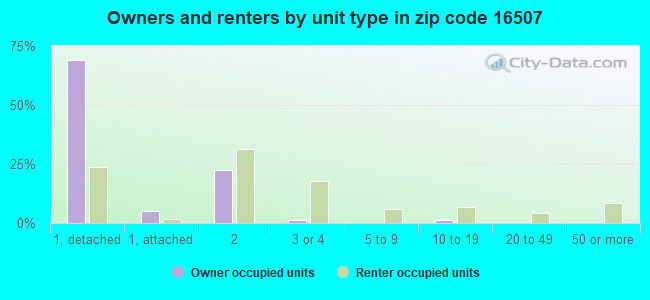
% of renters here:
65%
State:
31%
March 2022 cost of living index in zip code 16507: 90.6 (less than average, U.S. average is 100)
Land area: 2.1 sq. mi. Water area: 0.9 sq. mi.
Population density: 4,192 people per square mile
(average).
OSM Map
General Map
Google Map
MSN Map
OSM Map
General Map
Google Map
MSN Map
OSM Map
General Map
Google Map
MSN Map
OSM Map
General Map
Google Map
MSN Map
Please wait while loading the map...
Real estate property taxes paid for housing units in 2022:
This zip code:
1.6% ($1,256)
Pennsylvania:
1.3% ($3,094)
Median real estate property taxes paid for housing units with mortgages in 2022: $1,775 (2.1%) Median real estate property taxes paid for housing units with no mortgage in 2022: $1,133 (1.8%)
Business Search- 14 Million verified businesses
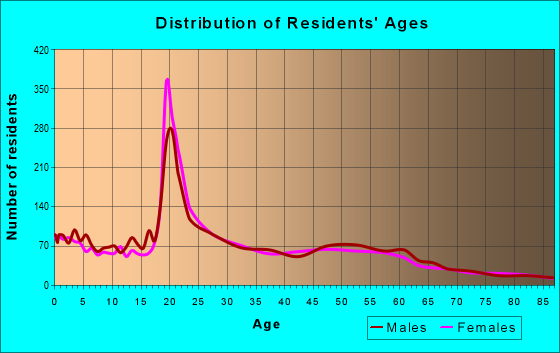
Males: 4,365
(48.6%)
Females: 4,618
(51.4%)
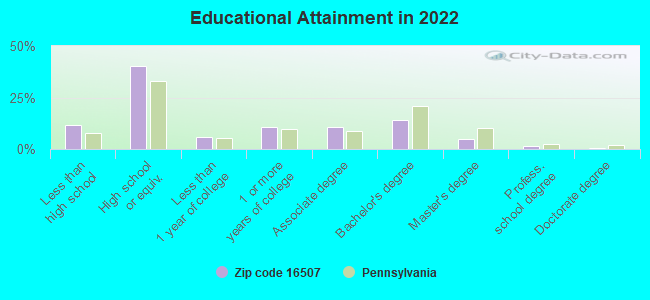
For population 25 years and over in 16507:
High school or higher: 88.1%
Bachelor's degree or higher: 20.8%
Graduate or professional degree: 7.0%
Unemployed: 2.6%
Mean travel time to work (commute): 19.4 minutes
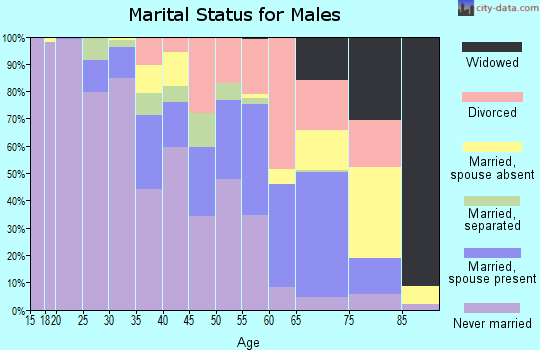
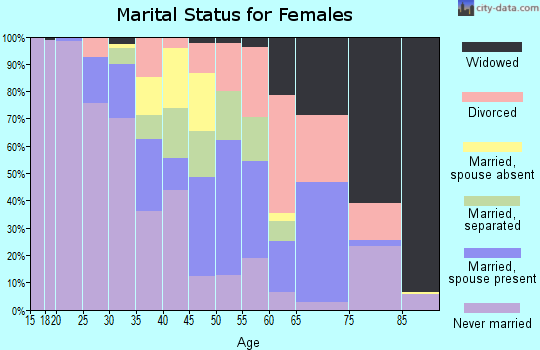
For population 15 years and over in 16507:
Never married: 55.9%
Now married: 25.3%
Separated: 1.4%
Widowed: 4.6%
Divorced: 12.8%
Zip code 16507 compared to state average:
Median household income below state average.
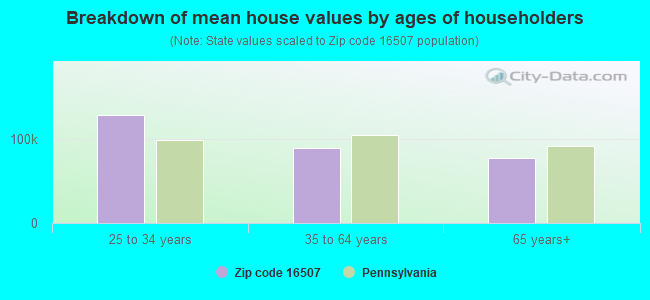
Median house value significantly below state average.
Median age significantly below state average.
Foreign-born population percentage below state average.
Renting percentage above state average.
Length of stay since moving in significantly above state average.
Number of college students above state average.
Percentage of population with a bachelor's degree or higher below state average.
Averages for the 2020 tax year for zip code 16507, filed in 2021:
Average Adjusted Gross Income (AGI) in 2020: $36,334 (Individual Income Tax Returns)
Here:
$36,334
State:
$75,707
Salary/wage: $30,215 (reported on 85.5% of returns)
Here:
$30,215
State:
$62,806
(% of AGI for various income ranges: 1132.5% for AGIs below $25k, 3188.2% for AGIs $25k-50k, 6440.8% for AGIs $50k-75k, 9287.5% for AGIs $75k-100k, 13380.0% for AGIs $100k-200k)
Taxable interest for individuals: $764 (reported on 13.6% of returns)
This zip code:
$764
Pennsylvania:
$1,633
(% of AGI for various income ranges: 3.2% for AGIs below $25k, 3.3% for AGIs $25k-50k, 33.3% for AGIs $50k-75k, 42.5% for AGIs $75k-100k, 78.6% for AGIs $100k-200k)
Ordinary dividends: $6,023 (reported on 7.5% of returns)
Here:
$6,023
State:
$7,382
(% of AGI for various income ranges: 11.6% for AGIs below $25k, 16.6% for AGIs $25k-50k, 53.8% for AGIs $50k-75k, 130.0% for AGIs $75k-100k, 567.1% for AGIs $100k-200k)
Net capital gain/loss in AGI: +$6,945 (reported on 6.4% of returns)
Here:
+$6,945
State:
+$23,522
(% of AGI for various income ranges: 2.9% for AGIs below $25k, 6.7% for AGIs $25k-50k, 36.7% for AGIs $50k-75k, 242.5% for AGIs $75k-100k, 520.0% for AGIs $100k-200k)
Profit/loss from business: +$10,559 (reported on 7.8% of returns)
Here:
+$10,559
State:
+$16,274
(% of AGI for various income ranges: 59.4% for AGIs below $25k, 42.5% for AGIs $25k-50k, 78.3% for AGIs $50k-75k, 2017.1% for AGIs $100k-200k)
Taxable individual retirement arrangement distribution: $13,560 (reported on 4.3% of returns)
16507:
$13,560
Pennsylvania:
$18,583
(% of AGI for various income ranges: 17.7% for AGIs below $25k, 18.9% for AGIs $25k-50k, 330.4% for AGIs $50k-75k, 1154.3% for AGIs $100k-200k)
Total itemized deductions: $35,600 (reported on 1.7% of returns)
Here:
$35,600
State:
$34,850
(% of AGI for various income ranges: 1580.0% for AGIs $75k-100k)
Charity contributions: $13,625 (reported on 1.2% of returns)
Here:
$13,625
State:
$12,392
(% of AGI for various income ranges: 103.3% for AGIs $50k-75k)
Taxes paid: $7,050 (reported on 1.7% of returns)
16507:
$7,050
State:
$8,200
(% of AGI for various income ranges: 265.0% for AGIs $75k-100k)
Earned income credit: $2,450 (reported on 33.6% of returns)
Here:
$2,450
State:
$2,100
(% of AGI for various income ranges: 133.7% for AGIs below $25k, 98.3% for AGIs $25k-50k)
Percentage of individuals using paid preparers for their 2020 taxes: 95.9%
Here:
96%
State:
92%
(% for various income ranges: 94.9% for AGIs below $25k, 97.2% for AGIs $25k-50k, 96.9% for AGIs $50k-75k, 91.7% for AGIs $75k-100k, 100.0% for AGIs $100k-200k, 100.0% for AGIs over 200k)
Averages for the 2012 tax year for zip code 16507, filed in 2013:
Average Adjusted Gross Income (AGI) in 2012: $32,480 (Individual Income Tax Returns)
Here:
$32,480
State:
$61,346
Salary/wage: $26,043 (reported on 89.1% of returns)
Here:
$26,043
State:
$51,902
(% of AGI for various income ranges: 82.0% for AGIs below $25k, 86.3% for AGIs $25k-50k, 81.5% for AGIs $50k-75k, 78.5% for AGIs $75k-100k, 70.9% for AGIs $100k-200k, 35.5% for AGIs over 200k)
Taxable interest for individuals: $812 (reported on 16.0% of returns)
This zip code:
$812
Pennsylvania:
$1,588
(% of AGI for various income ranges: 0.4% for AGIs below $25k, 0.4% for AGIs $25k-50k, 0.3% for AGIs $50k-75k, 0.1% for AGIs $75k-100k, 0.6% for AGIs $100k-200k, 0.5% for AGIs over 200k)
Ordinary dividends: $4,935 (reported on 8.2% of returns)
Here:
$4,935
State:
$5,827
(% of AGI for various income ranges: 0.6% for AGIs below $25k, 0.5% for AGIs $25k-50k, 1.4% for AGIs $50k-75k, 2.7% for AGIs $100k-200k, 2.6% for AGIs over 200k)
Net capital gain/loss in AGI: +$12,490 (reported on 5.6% of returns)
Here:
+$12,490
State:
+$14,495
(% of AGI for various income ranges: 0.1% for AGIs $50k-75k, 0.7% for AGIs $100k-200k, 9.2% for AGIs over 200k)
Profit/loss from business: +$9,164 (reported on 8.8% of returns)
Here:
+$9,164
State:
+$16,268
(% of AGI for various income ranges: 4.6% for AGIs below $25k, 1.8% for AGIs $25k-50k, 1.8% for AGIs $50k-75k, 8.5% for AGIs $100k-200k)
Taxable individual retirement arrangement distribution: $11,622 (reported on 4.8% of returns)
16507:
$11,622
Pennsylvania:
$14,550
(% of AGI for various income ranges: 1.5% for AGIs below $25k, 1.1% for AGIs $25k-50k, 4.2% for AGIs $50k-75k, 6.3% for AGIs $100k-200k)
Total itemized deductions: $28,941 (19% of AGI, reported on 7.7% of returns)
Here:
$28,941
State:
$23,538
Here:
19.4% of AGI
State:
18.4% of AGI
(% of AGI for various income ranges: 2.1% for AGIs below $25k, 3.4% for AGIs $25k-50k, 4.8% for AGIs $50k-75k, 8.4% for AGIs $75k-100k, 11.5% for AGIs $100k-200k, 14.9% for AGIs over 200k)
Charity contributions: $5,611 (reported on 5.1% of returns)
Here:
$5,611
State:
$4,025
(% of AGI for various income ranges: 0.4% for AGIs $25k-50k, 0.4% for AGIs $50k-75k, 1.1% for AGIs $75k-100k, 2.1% for AGIs $100k-200k, 2.1% for AGIs over 200k)
Taxes paid: $11,045 (reported on 7.7% of returns)
16507:
$11,045
State:
$9,982
(% of AGI for various income ranges: 0.2% for AGIs below $25k, 0.9% for AGIs $25k-50k, 1.4% for AGIs $50k-75k, 2.8% for AGIs $75k-100k, 4.8% for AGIs $100k-200k, 7.0% for AGIs over 200k)
Earned income credit: $2,358 (reported on 39.6% of returns)
Here:
$2,358
State:
$2,106
(% of AGI for various income ranges: 10.5% for AGIs below $25k, 1.7% for AGIs $25k-50k)
Percentage of individuals using paid preparers for their 2012 taxes: 42.8%
Here:
43%
State:
53%
(% for various income ranges: 39.9% for AGIs below $25k, 43.8% for AGIs $25k-50k, 46.4% for AGIs $50k-75k, 55.6% for AGIs $75k-100k, 62.5% for AGIs $100k-200k, 100.0% for AGIs over 200k)
Averages for the 2004 tax year for zip code 16507, filed in 2005:
Average Adjusted Gross Income (AGI) in 2004: $27,080 (Individual Income Tax Returns)
Here:
$27,080
State:
$48,049
Salary/wage: $23,581 (reported on 88.4% of returns)
Here:
$23,581
State:
$42,646
(% of AGI for various income ranges: 87.6% for AGIs below $10k, 84.7% for AGIs $10k-25k, 88.4% for AGIs $25k-50k, 81.0% for AGIs $50k-75k, 75.1% for AGIs $75k-100k, 50.3% for AGIs over 100k)
Taxable interest for individuals: $1,453 (reported on 27.9% of returns)
This zip code:
$1,453
Pennsylvania:
$1,657
(% of AGI for various income ranges: 2.2% for AGIs below $10k, 1.1% for AGIs $10k-25k, 1.0% for AGIs $25k-50k, 1.9% for AGIs $50k-75k, 1.4% for AGIs $75k-100k, 2.2% for AGIs over 100k)
Taxable dividends: $3,256 (reported on 11.1% of returns)
Here:
$3,256
State:
$3,566
(% of AGI for various income ranges: 1.1% for AGIs below $10k, 0.7% for AGIs $10k-25k, 0.9% for AGIs $25k-50k, 1.9% for AGIs $50k-75k, 0.9% for AGIs $75k-100k, 2.5% for AGIs over 100k)
Net capital gain/loss: +$5,661 (reported on 7.7% of returns)
Here:
+$5,661
State:
+$9,716
(% of AGI for various income ranges: -0.4% for AGIs below $10k, 0.3% for AGIs $10k-25k, 0.5% for AGIs $25k-50k, 1.4% for AGIs $50k-75k, 0.2% for AGIs $75k-100k, 5.3% for AGIs over 100k)
Profit/loss from business: +$5,921 (reported on 7.8% of returns)
Here:
+$5,921
State:
+$14,267
(% of AGI for various income ranges: 5.0% for AGIs below $10k, 3.0% for AGIs $10k-25k, 0.8% for AGIs $25k-50k, 3.0% for AGIs $50k-75k, 0.4% for AGIs over 100k)
IRA payment deduction: $2,036 (reported on 1.4% of returns)
16507:
$2,036
Pennsylvania:
$2,903
Total itemized deductions: $20,374 (21% of AGI, reported on 9.3% of returns)
Here:
$20,374
State:
$18,804
Here:
21.2% of AGI
State:
19.5% of AGI
(% of AGI for various income ranges: 3.4% for AGIs below $10k, 3.6% for AGIs $10k-25k, 3.9% for AGIs $25k-50k, 9.2% for AGIs $50k-75k, 9.5% for AGIs $75k-100k, 13.5% for AGIs over 100k)
Charity contributions deductions: $3,971 (4% of AGI, reported on 7.1% of returns)
Here:
$3,971
State:
$3,337
Here:
3.6% of AGI
State:
3.3% of AGI
(% of AGI for various income ranges: 0.4% for AGIs $10k-25k, 0.5% for AGIs $25k-50k, 1.1% for AGIs $50k-75k, 1.8% for AGIs $75k-100k, 2.3% for AGIs over 100k)
Total tax: $4,655 (reported on 57.2% of returns)
16507:
$4,655
State:
$8,008
(% of AGI for various income ranges: 1.4% for AGIs below $10k, 3.5% for AGIs $10k-25k, 6.9% for AGIs $25k-50k, 10.5% for AGIs $50k-75k, 12.4% for AGIs $75k-100k, 21.0% for AGIs over 100k)
Earned income credit: $1,903 (reported on 33.6% of returns)
Here:
$1,903
State:
$1,643
Percentage of individuals using paid preparers for their 2004 taxes: 54.8%
Here:
55%
State:
56%
(% for various income ranges: 52.6% for AGIs below $10k, 55.5% for AGIs $10k-25k, 53.8% for AGIs $25k-50k, 57.8% for AGIs $50k-75k, 50.0% for AGIs $75k-100k, 75.0% for AGIs over 100k)
Likely homosexual households (counted as self-reported same-sex unmarried-partner households)
Lesbian couples: 0.0% of all households
Gay men: 0.1% of all households
Household received Food Stamps/SNAP in the past 12 months: 1,171 Household did not receive Food Stamps/SNAP in the past 12 months: 2,503
Women who had a birth in the past 12 months: 125 (34 now married, 79 unmarried) Women who did not have a birth in the past 12 months: 2,329 (399 now married, 1,948 unmarried)
Housing units in zip code 16507 with a mortgage: 565 (40 second mortgage, 30 both second mortgage and home equity loan) Median monthly owner costs for units with a mortgage: $893 Median monthly owner costs for units without a mortgage: $363
Residents with income below the poverty level in 2022:
This zip code:
30.4%
Whole state:
11.8%
Residents with income below 50% of the poverty level in 2022:
This zip code:
17.8%
Whole state:
6.1%
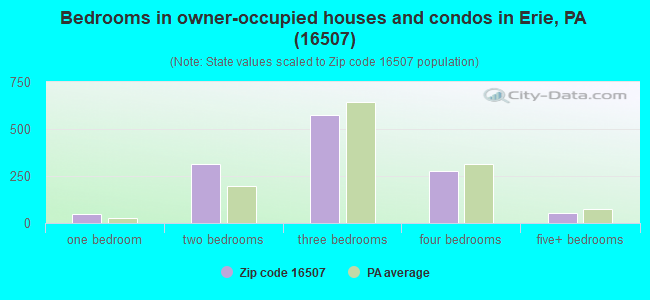
Median number of rooms in houses and condos:
Here:
6.5
State:
6.8
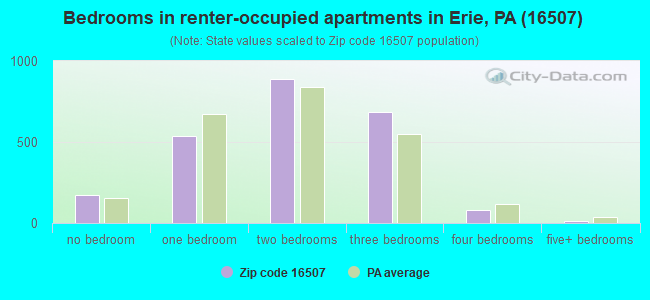
Median number of rooms in apartments:
Here:
4.7
State:
4.3
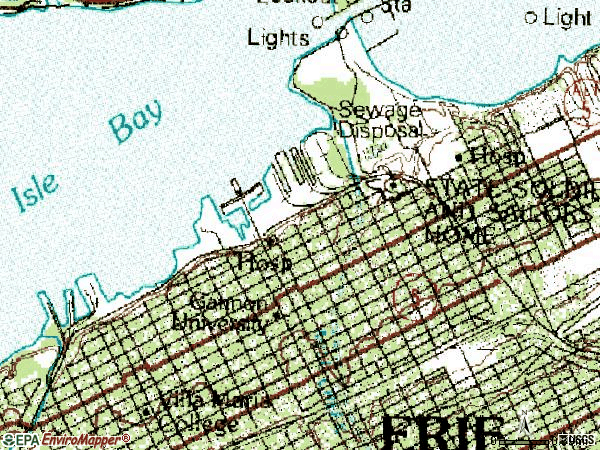
Notable locations in this zip code not listed on our city pages
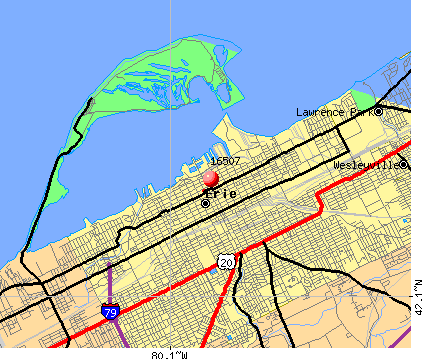
Notable locations in zip code 16507: East Erie Plaza (A), Erie International Main Terminal (B), Lampe Marina (C), Cherry Marina (D), Austin Dock Number Four (E), Bay Harbor Marina (F), Commodore Perry Yacht Club (G), General Wayne Blockhouse (H), Dobbins Landing (I), South Pier (J), Presque Isle Yacht Club (K), Perry Memorial House (L), Wayne Blockhouse (M), Erie County Public Library (N), Pennsylvania Soldiers and Sailors Home (O). Display/hide their locations on the map
Parks in zip code 16507 include: Bayview Park (1), Niagara Park (2), Gridley Park (3), Lakeside Park (4), Lighthouse Park (5). Display/hide their locations on the map
In group quarters: 1,348 (-1 institutionalized population)
Size of family households: 539 2-persons, 445 3-persons, 277 4-persons, 187 5-persons, 17 6-persons, 30 7-or-more-persons
Size of nonfamily households: 1,656 1-person, 504 2-persons, 7 3-persons
560 married couples with children.
742 single-parent households (64 men, 678 women).
90.9% of residents of 16507 zip code speak English at home.
4.9% of residents speak Spanish at home (92% very well, 5% well, 3% not well).
1.5% of residents speak other Indo-European language at home (63% very well, 32% well, 5% not well).
0.8% of residents speak Asian or Pacific Island language at home (23% very well, 12% well, 57% not well, 9% not at all).
1.2% of residents speak other language at home (93% very well, 7% not well).
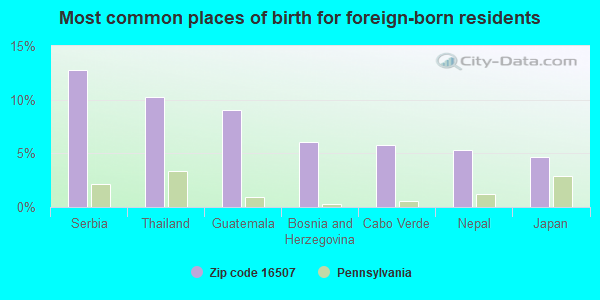
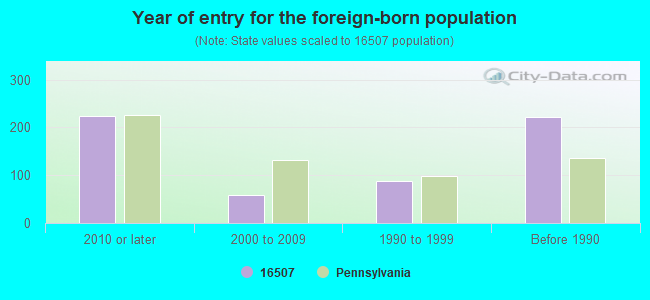
Foreign born population: 432 (4.8%) (66.5% of them are naturalized citizens)
Facilities with environmental interests located in this zip code:
ATLANTIC SVC STA (954 E 6TH ST-TANKS in ERIE, PA)
STATE MASTER (Pennsylvania database) - RCRIS-PAD987341476, HAZARDOUS WASTE PROGRAM Conditionally Exempt Small Quantity Generators, less than 100 kg/month of hazardous waste (Resource Conservation and Recovery Act (tracking hazardous waste)) - notification Organizations: OPERNAME (CONTACT/OPERATOR)
, ATLANTIC REFINING & MARKETING (CONTACT/OWNER)
, ATLANTIC REFINING & MARKETING CORPORATION (CONTACT/OWNER)
Housing units lacking complete plumbing facilities: 4.3% Housing units lacking complete kitchen facilities: 6.0%
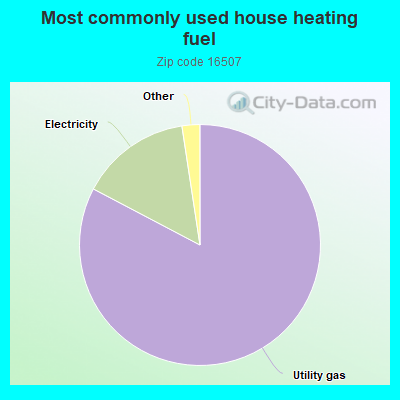
82.8%Utility gas
14.9%Electricity
0.9%Fuel oil, kerosene, etc.
0.8%Bottled, tank, or LP gas
0.7%No fuel used
Population in 1990: 10,936.
Place of birth for U.S.-born residents:
This state: 6,465
Northeast: 668
Midwest: 380
South: 659
West: 208
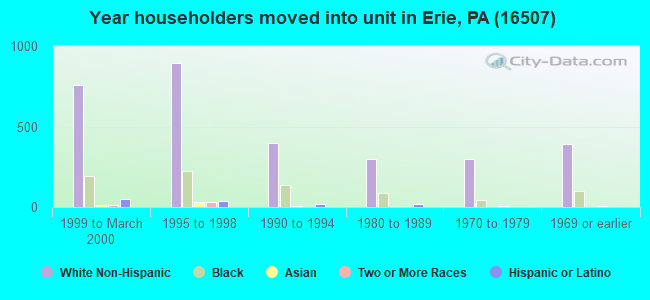
48% of the 16507 zip code residents lived in the same house 5 years ago. Out of people who lived in different houses, 80% lived in this county. Out of people who lived in different counties, 50% lived in Pennsylvania.
86% of the 16507 zip code residents lived in the same house 1 year ago. Out of people who lived in different houses, 66% moved from this county. Out of people who lived in different houses, 13% moved from different county within same state. Out of people who lived in different houses, 17% moved from different state. Out of people who lived in different houses, 1% moved from abroad.
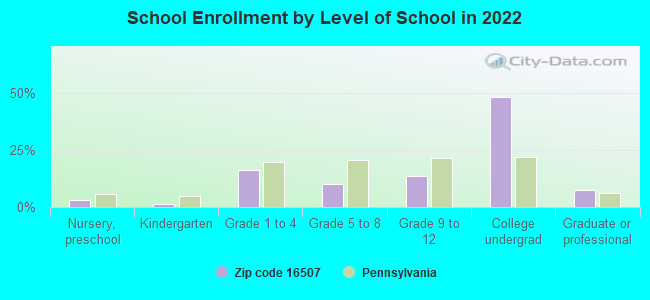
Private vs. public school enrollment:
Students in private schools in grades 1 to 8 (elementary and middle school): 48
Here:
7.0%
Pennsylvania:
15.7%
Students in private schools in grades 9 to 12 (high school): 20
Here:
5.8%
Pennsylvania:
13.4%
Students in private undergraduate colleges: 882
Here:
69.7%
Pennsylvania:
39.8%
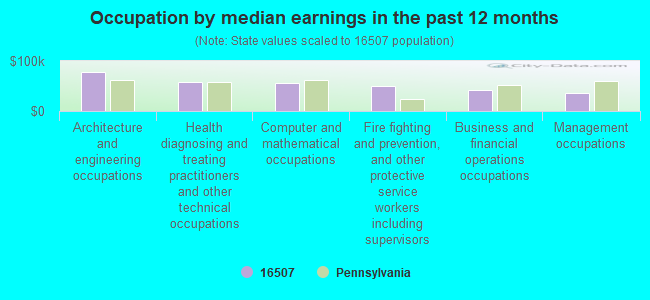
Occupation by median earnings in the past 12 months ($)
77,528Architecture and engineering occupations
57,727Health diagnosing and treating practitioners and other technical occupations
55,502Computer and mathematical occupations
49,096Fire fighting and prevention, and other protective service workers including supervisors
41,992Business and financial operations occupations
36,070Management occupations
Companies with federal contracts located in this zip code:
DR GERTRUDE A BARBER CENTER IN (136 EAST AVENUE in ERIE, PA) : $512,745 in 19 contractsfrom 2000 to 2006
Contracts for Custodial Janitorial Services by Public Buildings Service, Army Signed by year:2000: $80,000; 2001: $80,000; 2002: $17,286; 2003: $152,277; 2004: $160,215; 2005: $11,424; 2006: $11,543.
Biggest contracts:
$154,519 with Public Buildings Service for Custodial Janitorial Services. Signed on 2004-09-17. Effective on 2004-09-16. Completion date: 2006-09-30.
$140,865, same as above.Signed on 2003-10-01. Completion date: 2004-09-30.
$80,000, same as above.Signed on 2001-05-15. Completion date: 2002-05-15.
$80,000, same as above.Signed on 2000-05-15. Completion date: 2001-05-15.
Top industries in this zip code by the number of employees in 2005:
Health Care and Social Assistance: General Medical and Surgical Hospitals (over 1000 employees: 1 establishment)
Health Care and Social Assistance: Offices of Physicians (except Mental Health Specialists) (250-499: 1, 100-249: 1, 50-99: 2, 20-49: 5, 10-19: 12, 5-9: 3, 1-4: 9)
Health Care and Social Assistance: Services for the Elderly and Persons with Disabilities (100-249: 2, 50-99: 1, 20-49: 1, 1-4: 3)
Health Care and Social Assistance: All Other Outpatient Care Centers (250-499: 1, 20-49: 1)
Educational Services: Elementary and Secondary Schools (100-249: 1, 50-99: 1)
Professional, Scientific, and Technical Services: Offices of Lawyers (50-99: 1, 20-49: 2, 10-19: 1, 5-9: 5, 1-4: 22)
Health Care and Social Assistance: Residential Mental Retardation Facilities (100-249: 1, 10-19: 1, 5-9: 2)
Health Care and Social Assistance: Residential Mental Health and Substance Abuse Facilities (50-99: 1, 20-49: 2)
People in group quarters in 2010:
1,032 people in college/university student housing
181 people in nursing facilities/skilled-nursing facilities
126 people in correctional residential facilities
45 people in maritime/merchant vessels
33 people in residential treatment centers for adults
25 people in other noninstitutional facilities
24 people in group homes for juveniles (non-correctional)
24 people in residential treatment centers for juveniles (non-correctional)
12 people in group homes intended for adults
People in group quarters in 2000:
241 people in wards in general hospitals for patients who have no usual home elsewhere
212 people in nursing homes
78 people in orthopedic wards and institutions for the physically handicapped
77 people in homes for the mentally retarded
48 people in college dormitories (includes college quarters off campus)
28 people in other group homes
22 people in other types of correctional institutions
20 people in religious group quarters
18 people in homes or halfway houses for drug/alcohol abuse
14 people in unknown juvenile institutions
7 people in other noninstitutional group quarters
Fatal accident statistics in 2013:
Fatal accident count: 1
Vehicles involved in fatal accidents: 3
Fatal accidents caused by drunken drivers: 2
Fatalities: 1
Persons involved in fatal accidents: 4
Pedestrians involved in fatal accidents: 0
Fatal accident statistics in 2012:
Fatal accident count: 1
Vehicles involved in fatal accidents: 1
Fatal accidents caused by drunken drivers: 1
Fatalities: 1
Persons involved in fatal accidents: 3
Pedestrians involved in fatal accidents: 0
Home Mortgage Disclosure Act Aggregated Statistics For Year 2009 (Based on 14 partial tracts)
A) FHA, FSA/RHS & VA Home Purchase Loans
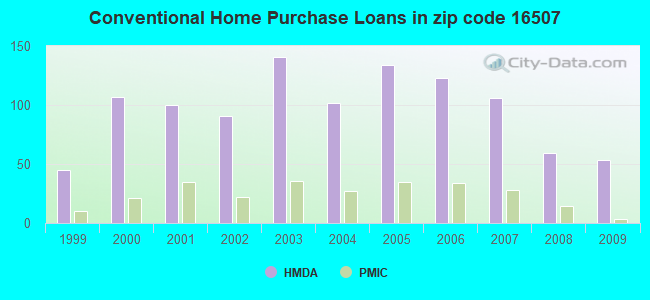
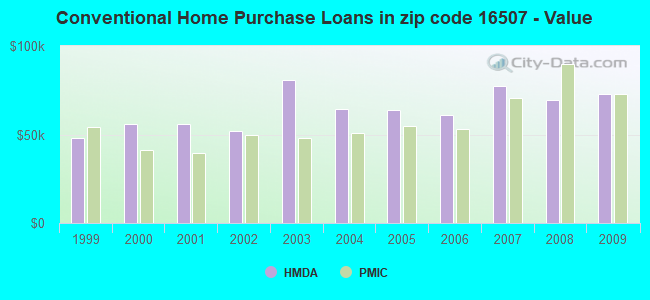
B) Conventional Home Purchase Loans
C) Refinancings
D) Home Improvement Loans
E) Loans on Dwellings For 5+ Families
F) Non-occupant Loans on < 5 Family Dwellings (A B C & D)
G) Loans On Manufactured Home Dwelling (A B C & D)
Number
Average Value
Number
Average Value
Number
Average Value
Number
Average Value
Number
Average Value
Number
Average Value
Number
Average Value
LOANS ORIGINATED
18
$70,811
53
$73,076
80
$81,902
30
$29,685
2
$175,090
51
$68,416
0
$0
APPLICATIONS APPROVED, NOT ACCEPTED
4
$49,200
4
$75,380
4
$92,338
0
$0
0
$0
2
$53,050
0
$0
APPLICATIONS DENIED
3
$44,683
9
$57,636
60
$62,057
21
$15,089
0
$0
6
$49,592
1
$65,630
APPLICATIONS WITHDRAWN
3
$46,747
4
$29,515
24
$73,168
9
$30,251
0
$0
4
$47,340
0
$0
FILES CLOSED FOR INCOMPLETENESS
0
$0
1
$171,540
3
$169,173
1
$19,590
0
$0
0
$0
0
$0
Aggregated Statistics For Year 2008 (Based on 14 partial tracts)
A) FHA, FSA/RHS & VA Home Purchase Loans
B) Conventional Home Purchase Loans
C) Refinancings
D) Home Improvement Loans
E) Loans on Dwellings For 5+ Families
F) Non-occupant Loans on < 5 Family Dwellings (A B C & D)
Number
Average Value
Number
Average Value
Number
Average Value
Number
Average Value
Number
Average Value
Number
Average Value
LOANS ORIGINATED
19
$61,861
59
$69,755
77
$48,068
50
$33,347
5
$523,300
73
$59,746
APPLICATIONS APPROVED, NOT ACCEPTED
0
$0
6
$109,222
9
$45,944
4
$17,785
1
$53,880
5
$61,660
APPLICATIONS DENIED
1
$84,580
15
$51,298
115
$60,508
64
$30,356
0
$0
15
$61,440
APPLICATIONS WITHDRAWN
3
$43,847
3
$72,460
18
$57,281
6
$32,413
0
$0
4
$52,255
FILES CLOSED FOR INCOMPLETENESS
0
$0
0
$0
1
$52,490
0
$0
0
$0
0
$0
Aggregated Statistics For Year 2007 (Based on 14 partial tracts)
A) FHA, FSA/RHS & VA Home Purchase Loans
B) Conventional Home Purchase Loans
C) Refinancings
D) Home Improvement Loans
E) Loans on Dwellings For 5+ Families
F) Non-occupant Loans on < 5 Family Dwellings (A B C & D)
G) Loans On Manufactured Home Dwelling (A B C & D)
Number
Average Value
Number
Average Value
Number
Average Value
Number
Average Value
Number
Average Value
Number
Average Value
Number
Average Value
LOANS ORIGINATED
19
$61,341
106
$77,411
92
$57,963
51
$23,661
2
$496,195
72
$55,803
0
$0
APPLICATIONS APPROVED, NOT ACCEPTED
0
$0
15
$68,629
15
$55,223
1
$19,310
0
$0
6
$56,198
1
$26,100
APPLICATIONS DENIED
1
$78,570
35
$61,066
199
$58,739
79
$30,234
0
$0
33
$50,332
5
$22,392
APPLICATIONS WITHDRAWN
4
$57,638
12
$95,051
43
$60,498
8
$46,346
0
$0
8
$81,434
0
$0
FILES CLOSED FOR INCOMPLETENESS
2
$34,575
7
$53,467
7
$61,334
2
$39,010
0
$0
2
$51,255
0
$0
Aggregated Statistics For Year 2006 (Based on 14 partial tracts)
A) FHA, FSA/RHS & VA Home Purchase Loans
B) Conventional Home Purchase Loans
C) Refinancings
D) Home Improvement Loans
E) Loans on Dwellings For 5+ Families
F) Non-occupant Loans on < 5 Family Dwellings (A B C & D)
G) Loans On Manufactured Home Dwelling (A B C & D)
Number
Average Value
Number
Average Value
Number
Average Value
Number
Average Value
Number
Average Value
Number
Average Value
Number
Average Value
LOANS ORIGINATED
15
$64,893
123
$61,155
103
$49,991
73
$30,709
2
$110,930
89
$52,260
0
$0
APPLICATIONS APPROVED, NOT ACCEPTED
0
$0
19
$59,631
37
$51,903
10
$27,131
0
$0
15
$55,174
0
$0
APPLICATIONS DENIED
1
$80,980
41
$48,470
219
$58,448
85
$16,464
3
$210,743
39
$57,175
2
$33,990
APPLICATIONS WITHDRAWN
2
$83,105
19
$63,376
61
$69,651
7
$33,484
0
$0
12
$46,556
0
$0
FILES CLOSED FOR INCOMPLETENESS
0
$0
4
$47,090
15
$69,400
1
$8,410
0
$0
3
$25,193
0
$0
Aggregated Statistics For Year 2005 (Based on 14 partial tracts)
A) FHA, FSA/RHS & VA Home Purchase Loans
B) Conventional Home Purchase Loans
C) Refinancings
D) Home Improvement Loans
E) Loans on Dwellings For 5+ Families
F) Non-occupant Loans on < 5 Family Dwellings (A B C & D)
G) Loans On Manufactured Home Dwelling (A B C & D)
Number
Average Value
Number
Average Value
Number
Average Value
Number
Average Value
Number
Average Value
Number
Average Value
Number
Average Value
LOANS ORIGINATED
17
$57,566
134
$63,938
147
$50,636
79
$39,357
3
$88,423
124
$46,418
1
$11,000
APPLICATIONS APPROVED, NOT ACCEPTED
0
$0
13
$76,195
39
$47,250
12
$20,671
0
$0
7
$52,597
0
$0
APPLICATIONS DENIED
4
$41,102
31
$44,865
252
$53,685
108
$16,775
0
$0
71
$22,187
7
$32,589
APPLICATIONS WITHDRAWN
3
$53,403
14
$121,845
77
$62,558
11
$190,185
0
$0
13
$153,442
0
$0
FILES CLOSED FOR INCOMPLETENESS
0
$0
4
$56,960
12
$76,090
5
$34,160
0
$0
4
$44,660
0
$0
Aggregated Statistics For Year 2004 (Based on 14 partial tracts)
A) FHA, FSA/RHS & VA Home Purchase Loans
B) Conventional Home Purchase Loans
C) Refinancings
D) Home Improvement Loans
E) Loans on Dwellings For 5+ Families
F) Non-occupant Loans on < 5 Family Dwellings (A B C & D)
G) Loans On Manufactured Home Dwelling (A B C & D)
Number
Average Value
Number
Average Value
Number
Average Value
Number
Average Value
Number
Average Value
Number
Average Value
Number
Average Value
LOANS ORIGINATED
23
$52,318
102
$64,436
209
$48,170
87
$21,750
2
$797,095
111
$42,042
1
$50,580
APPLICATIONS APPROVED, NOT ACCEPTED
0
$0
8
$34,885
56
$51,023
13
$29,941
0
$0
12
$44,549
4
$29,598
APPLICATIONS DENIED
3
$31,567
34
$49,594
261
$51,335
103
$18,325
0
$0
62
$27,195
4
$32,632
APPLICATIONS WITHDRAWN
0
$0
13
$71,331
160
$57,333
11
$27,740
0
$0
12
$38,900
4
$63,250
FILES CLOSED FOR INCOMPLETENESS
0
$0
2
$46,590
43
$68,774
4
$28,900
0
$0
3
$71,773
0
$0
Aggregated Statistics For Year 2003 (Based on 14 partial tracts)
A) FHA, FSA/RHS & VA Home Purchase Loans
B) Conventional Home Purchase Loans
C) Refinancings
D) Home Improvement Loans
F) Non-occupant Loans on < 5 Family Dwellings (A B C & D)
Number
Average Value
Number
Average Value
Number
Average Value
Number
Average Value
Number
Average Value
LOANS ORIGINATED
25
$54,098
141
$81,009
285
$50,361
68
$23,274
135
$47,446
APPLICATIONS APPROVED, NOT ACCEPTED
3
$44,793
13
$98,008
83
$56,458
13
$42,573
15
$32,657
APPLICATIONS DENIED
4
$43,578
34
$54,637
233
$51,537
84
$11,029
34
$23,376
APPLICATIONS WITHDRAWN
0
$0
14
$60,399
98
$55,513
6
$28,810
11
$36,564
FILES CLOSED FOR INCOMPLETENESS
0
$0
5
$90,016
10
$46,785
2
$65,575
6
$48,517
Aggregated Statistics For Year 2002 (Based on 14 partial tracts)
A) FHA, FSA/RHS & VA Home Purchase Loans
B) Conventional Home Purchase Loans
C) Refinancings
D) Home Improvement Loans
E) Loans on Dwellings For 5+ Families
F) Non-occupant Loans on < 5 Family Dwellings (A B C & D)
Number
Average Value
Number
Average Value
Number
Average Value
Number
Average Value
Number
Average Value
Number
Average Value
LOANS ORIGINATED
47
$49,625
91
$52,206
220
$68,302
46
$14,307
2
$70,430
71
$39,499
APPLICATIONS APPROVED, NOT ACCEPTED
4
$47,758
15
$39,721
58
$52,197
5
$21,490
0
$0
8
$46,474
APPLICATIONS DENIED
3
$64,333
39
$42,441
223
$47,566
49
$11,191
0
$0
24
$51,445
APPLICATIONS WITHDRAWN
4
$35,840
7
$135,710
91
$53,507
14
$14,004
0
$0
5
$26,538
FILES CLOSED FOR INCOMPLETENESS
0
$0
2
$36,750
17
$74,475
0
$0
0
$0
0
$0
Aggregated Statistics For Year 2001 (Based on 14 partial tracts)
A) FHA, FSA/RHS & VA Home Purchase Loans
B) Conventional Home Purchase Loans
C) Refinancings
D) Home Improvement Loans
F) Non-occupant Loans on < 5 Family Dwellings (A B C & D)
Number
Average Value
Number
Average Value
Number
Average Value
Number
Average Value
Number
Average Value
LOANS ORIGINATED
36
$47,895
100
$55,668
192
$50,541
74
$15,144
67
$36,737
APPLICATIONS APPROVED, NOT ACCEPTED
2
$45,455
18
$42,853
63
$36,186
18
$12,690
4
$60,312
APPLICATIONS DENIED
3
$58,300
50
$39,643
273
$43,994
115
$16,692
27
$42,122
APPLICATIONS WITHDRAWN
6
$36,712
26
$47,228
87
$51,008
12
$13,007
10
$35,302
FILES CLOSED FOR INCOMPLETENESS
0
$0
2
$41,420
29
$46,825
1
$7,350
2
$60,285
Aggregated Statistics For Year 2000 (Based on 14 partial tracts)
A) FHA, FSA/RHS & VA Home Purchase Loans
B) Conventional Home Purchase Loans
C) Refinancings
D) Home Improvement Loans
E) Loans on Dwellings For 5+ Families
F) Non-occupant Loans on < 5 Family Dwellings (A B C & D)
Number
Average Value
Number
Average Value
Number
Average Value
Number
Average Value
Number
Average Value
Number
Average Value
LOANS ORIGINATED
45
$42,331
107
$56,168
135
$38,725
73
$14,982
3
$25,797
69
$38,772
APPLICATIONS APPROVED, NOT ACCEPTED
1
$36,180
21
$29,670
46
$39,948
26
$14,046
0
$0
10
$31,154
APPLICATIONS DENIED
5
$39,350
64
$38,039
171
$37,370
60
$11,909
0
$0
34
$35,809
APPLICATIONS WITHDRAWN
2
$37,235
23
$62,638
75
$42,374
5
$8,990
0
$0
8
$38,860
FILES CLOSED FOR INCOMPLETENESS
1
$47,530
3
$43,097
12
$45,788
2
$25,715
0
$0
3
$42,967
Aggregated Statistics For Year 1999 (Based on 7 partial tracts)
A) FHA, FSA/RHS & VA Home Purchase Loans
B) Conventional Home Purchase Loans
C) Refinancings
D) Home Improvement Loans
F) Non-occupant Loans on < 5 Family Dwellings (A B C & D)
2014 - 2018 National Fire Incident Reporting System (NFIRS) incidents
Based on the data from the years 2014 - 2018 the average number of fires per year is 64. The highest number of fire incidents - 72 took place in 2015, and the least - 56 in 2018. The data has a declining trend.
When looking into fire subcategories, the most incidents belonged to: Structure Fires (51.4%), and Outside Fires (36.8%).
Fire incident types reported to NFIRS in Zip Code 16507


 Nearest zip codes: 16501, 16503, 16502, 16508, 16546, 16504.
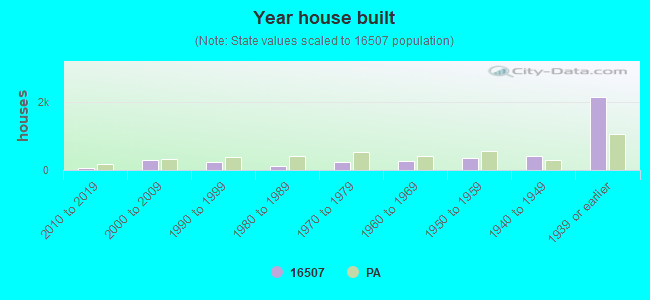


 Based on the data from the years 2014 - 2018 the average number of fires per year is 64. The highest number of fire incidents - 72 took place in 2015, and the least - 56 in 2018. The data has a declining trend.
 When looking into fire subcategories, the most incidents belonged to: Structure Fires (51.4%), and Outside Fires (36.8%).