Estimated zip code population in 2022: 13,311 Zip code population in 2010: 13,406 Zip code population in 2000: 13,660
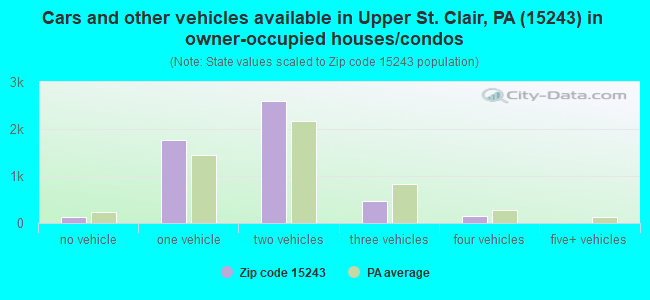
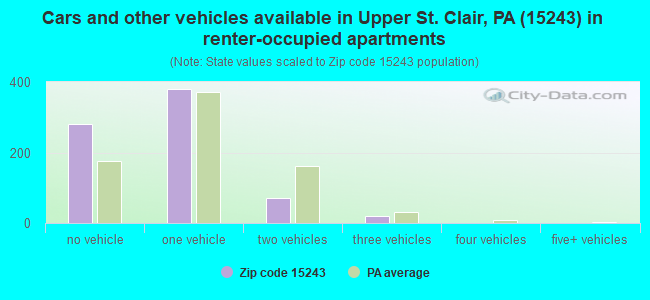
Houses and condos: 6,110 Renter-occupied apartments: 754
% of renters here:
13%
State:
31%
March 2022 cost of living index in zip code 15243: 94.2 (less than average, U.S. average is 100)
Land area: 3.0 sq. mi. Water area: 0.0 sq. mi.
Population density: 4,426 people per square mile
(average).
OSM Map
General Map
Google Map
MSN Map
OSM Map
General Map
Google Map
MSN Map
OSM Map
General Map
Google Map
MSN Map
OSM Map
General Map
Google Map
MSN Map
Please wait while loading the map...
Real estate property taxes paid for housing units in 2022:
This zip code:
1.8% ($4,728)
Pennsylvania:
1.3% ($3,094)
Median real estate property taxes paid for housing units with mortgages in 2022: $4,958 (1.8%) Median real estate property taxes paid for housing units with no mortgage in 2022: $4,470 (1.7%)
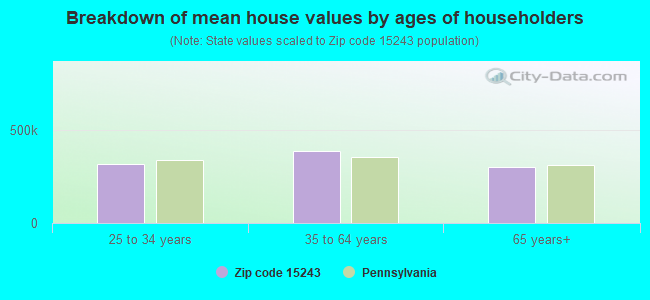
Estimated median house/condo value in 2022: $268,292
15243:
$268,292
Pennsylvania:
$245,500
According to our research of Pennsylvania and other state lists, there were 7 registered sex offenders living in 15243 zip code as of May 31, 2024. The ratio of all residents to sex offenders in zip code 15243 is 1,916 to 1. The ratio of registered sex offenders to all residents in this zip code is much lower than the state average.
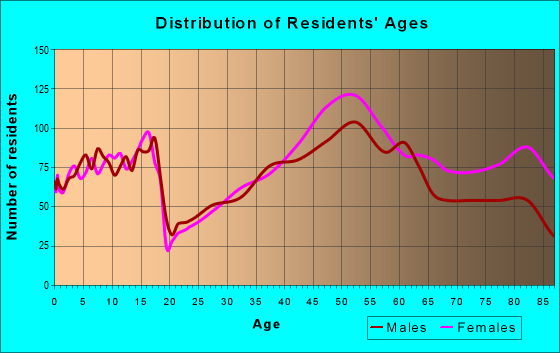
Median resident age:
This zip code:
51.5 years
Pennsylvania median age:
40.9 years
Average household size:
This zip code:
2.2 people
Pennsylvania:
2.4 people
Averages for the 2020 tax year for zip code 15243, filed in 2021:
Average Adjusted Gross Income (AGI) in 2020: $130,588 (Individual Income Tax Returns)
Here:
$130,588
State:
$75,707
Salary/wage: $108,267 (reported on 71.7% of returns)
Here:
$108,267
State:
$62,806
(% of AGI for various income ranges: 969.6% for AGIs below $25k, 2897.6% for AGIs $25k-50k, 5534.6% for AGIs $50k-75k, 8572.1% for AGIs $75k-100k, 17391.5% for AGIs $100k-200k, 85538.1% for AGIs over 200k)
Taxable interest for individuals: $2,202 (reported on 54.5% of returns)
This zip code:
$2,202
Pennsylvania:
$1,633
(% of AGI for various income ranges: 45.4% for AGIs below $25k, 74.3% for AGIs $25k-50k, 76.9% for AGIs $50k-75k, 136.0% for AGIs $75k-100k, 245.1% for AGIs $100k-200k, 1263.1% for AGIs over 200k)
Ordinary dividends: $12,665 (reported on 45.9% of returns)
Here:
$12,665
State:
$7,382
(% of AGI for various income ranges: 131.1% for AGIs below $25k, 187.4% for AGIs $25k-50k, 365.2% for AGIs $50k-75k, 487.7% for AGIs $75k-100k, 881.6% for AGIs $100k-200k, 7931.9% for AGIs over 200k)
Net capital gain/loss in AGI: +$30,375 (reported on 40.8% of returns)
Here:
+$30,375
State:
+$23,522
(% of AGI for various income ranges: 59.4% for AGIs below $25k, 153.1% for AGIs $25k-50k, 215.1% for AGIs $50k-75k, 407.1% for AGIs $75k-100k, 899.9% for AGIs $100k-200k, 23069.4% for AGIs over 200k)
Profit/loss from business: +$23,317 (reported on 15.4% of returns)
Here:
+$23,317
State:
+$16,274
(% of AGI for various income ranges: 122.1% for AGIs below $25k, 205.7% for AGIs $25k-50k, 268.4% for AGIs $50k-75k, 335.2% for AGIs $75k-100k, 716.8% for AGIs $100k-200k, 3960.3% for AGIs over 200k)
Taxable individual retirement arrangement distribution: $28,216 (reported on 20.5% of returns)
15243:
$28,216
Pennsylvania:
$18,583
(% of AGI for various income ranges: 179.5% for AGIs below $25k, 370.4% for AGIs $25k-50k, 625.4% for AGIs $50k-75k, 766.7% for AGIs $75k-100k, 1385.8% for AGIs $100k-200k, 4896.2% for AGIs over 200k)
Self-employed (Keogh) retirement plans: $23,525 (reported on 1.1% of returns)
15243:
$23,525
Pennsylvania:
$25,407
(% of AGI for various income ranges: 58.5% for AGIs $100k-200k, 412.5% for AGIs over 200k)
Total itemized deductions: $41,555 (reported on 12.6% of returns)
Here:
$41,555
State:
$34,850
(% of AGI for various income ranges: 103.0% for AGIs below $25k, 207.6% for AGIs $25k-50k, 510.2% for AGIs $50k-75k, 693.3% for AGIs $75k-100k, 896.8% for AGIs $100k-200k, 6036.9% for AGIs over 200k)
Charity contributions: $15,769 (reported on 11.0% of returns)
Here:
$15,769
State:
$12,392
(% of AGI for various income ranges: 7.8% for AGIs below $25k, 23.5% for AGIs $25k-50k, 49.7% for AGIs $50k-75k, 117.1% for AGIs $75k-100k, 185.3% for AGIs $100k-200k, 2930.0% for AGIs over 200k)
Taxes paid: $8,048 (reported on 12.6% of returns)
15243:
$8,048
State:
$8,200
(% of AGI for various income ranges: 16.1% for AGIs below $25k, 40.7% for AGIs $25k-50k, 79.3% for AGIs $50k-75k, 138.7% for AGIs $75k-100k, 230.6% for AGIs $100k-200k, 1037.2% for AGIs over 200k)
Earned income credit: $1,663 (reported on 3.8% of returns)
Here:
$1,663
State:
$2,100
(% of AGI for various income ranges: 32.4% for AGIs below $25k, 25.4% for AGIs $25k-50k)
Percentage of individuals using paid preparers for their 2020 taxes: 90.4%
Here:
90%
State:
92%
(% for various income ranges: 88.1% for AGIs below $25k, 90.5% for AGIs $25k-50k, 90.2% for AGIs $50k-75k, 91.7% for AGIs $75k-100k, 89.9% for AGIs $100k-200k, 93.8% for AGIs over 200k)
Averages for the 2012 tax year for zip code 15243, filed in 2013:
Average Adjusted Gross Income (AGI) in 2012: $100,712 (Individual Income Tax Returns)
Here:
$100,712
State:
$61,346
Salary/wage: $79,519 (reported on 72.9% of returns)
Here:
$79,519
State:
$51,902
(% of AGI for various income ranges: 54.9% for AGIs below $25k, 58.7% for AGIs $25k-50k, 60.0% for AGIs $50k-75k, 65.7% for AGIs $75k-100k, 68.6% for AGIs $100k-200k, 48.0% for AGIs over 200k)
Taxable interest for individuals: $2,220 (reported on 57.6% of returns)
This zip code:
$2,220
Pennsylvania:
$1,588
(% of AGI for various income ranges: 3.1% for AGIs below $25k, 1.9% for AGIs $25k-50k, 2.0% for AGIs $50k-75k, 1.1% for AGIs $75k-100k, 1.0% for AGIs $100k-200k, 1.1% for AGIs over 200k)
Ordinary dividends: $9,117 (reported on 47.7% of returns)
Here:
$9,117
State:
$5,827
(% of AGI for various income ranges: 7.2% for AGIs below $25k, 4.5% for AGIs $25k-50k, 3.8% for AGIs $50k-75k, 4.2% for AGIs $75k-100k, 3.7% for AGIs $100k-200k, 4.7% for AGIs over 200k)
Net capital gain/loss in AGI: +$28,423 (reported on 37.7% of returns)
Here:
+$28,423
State:
+$14,495
(% of AGI for various income ranges: 0.5% for AGIs $25k-50k, 1.0% for AGIs $50k-75k, 1.7% for AGIs $75k-100k, 1.8% for AGIs $100k-200k, 22.5% for AGIs over 200k)
Profit/loss from business: +$26,278 (reported on 14.5% of returns)
Here:
+$26,278
State:
+$16,268
(% of AGI for various income ranges: 5.8% for AGIs below $25k, 3.8% for AGIs $25k-50k, 2.7% for AGIs $50k-75k, 3.1% for AGIs $75k-100k, 3.9% for AGIs $100k-200k, 3.9% for AGIs over 200k)
Taxable individual retirement arrangement distribution: $23,331 (reported on 23.8% of returns)
15243:
$23,331
Pennsylvania:
$14,550
(% of AGI for various income ranges: 10.0% for AGIs below $25k, 7.4% for AGIs $25k-50k, 6.3% for AGIs $50k-75k, 5.6% for AGIs $75k-100k, 6.2% for AGIs $100k-200k, 4.3% for AGIs over 200k)
Self-employment retirement plans: $18,167 (reported on 1.7% of returns)
15243:
$18,167
Pennsylvania:
$20,922
(% of AGI for various income ranges: 0.4% for AGIs $25k-50k, 0.3% for AGIs $100k-200k, 0.4% for AGIs over 200k)
Total itemized deductions: $26,911 (16% of AGI, reported on 49.7% of returns)
Here:
$26,911
State:
$23,538
Here:
16.5% of AGI
State:
18.4% of AGI
(% of AGI for various income ranges: 24.9% for AGIs below $25k, 15.2% for AGIs $25k-50k, 14.0% for AGIs $50k-75k, 13.9% for AGIs $75k-100k, 14.4% for AGIs $100k-200k, 11.3% for AGIs over 200k)
Charity contributions: $5,189 (reported on 43.9% of returns)
Here:
$5,189
State:
$4,025
(% of AGI for various income ranges: 1.5% for AGIs below $25k, 1.6% for AGIs $25k-50k, 1.5% for AGIs $50k-75k, 1.5% for AGIs $75k-100k, 1.9% for AGIs $100k-200k, 2.9% for AGIs over 200k)
Taxes paid: $12,039 (reported on 49.6% of returns)
15243:
$12,039
State:
$9,982
(% of AGI for various income ranges: 5.5% for AGIs below $25k, 4.6% for AGIs $25k-50k, 5.0% for AGIs $50k-75k, 5.8% for AGIs $75k-100k, 7.0% for AGIs $100k-200k, 5.7% for AGIs over 200k)
Earned income credit: $1,612 (reported on 4.4% of returns)
Here:
$1,612
State:
$2,106
(% of AGI for various income ranges: 1.7% for AGIs below $25k, 0.4% for AGIs $25k-50k)
Percentage of individuals using paid preparers for their 2012 taxes: 54.8%
Here:
55%
State:
53%
(% for various income ranges: 48.1% for AGIs below $25k, 53.8% for AGIs $25k-50k, 56.6% for AGIs $50k-75k, 56.8% for AGIs $75k-100k, 54.2% for AGIs $100k-200k, 74.6% for AGIs over 200k)
Averages for the 2004 tax year for zip code 15243, filed in 2005:
Average Adjusted Gross Income (AGI) in 2004: $73,895 (Individual Income Tax Returns)
Here:
$73,895
State:
$48,049
Salary/wage: $65,750 (reported on 70.7% of returns)
Here:
$65,750
State:
$42,646
(% of AGI for various income ranges: 158.0% for AGIs below $10k, 45.5% for AGIs $10k-25k, 58.2% for AGIs $25k-50k, 65.2% for AGIs $50k-75k, 72.5% for AGIs $75k-100k, 61.1% for AGIs over 100k)
Taxable interest for individuals: $3,104 (reported on 70.8% of returns)
This zip code:
$3,104
Pennsylvania:
$1,657
(% of AGI for various income ranges: 22.9% for AGIs below $10k, 7.5% for AGIs $10k-25k, 4.8% for AGIs $25k-50k, 2.7% for AGIs $50k-75k, 2.5% for AGIs $75k-100k, 2.5% for AGIs over 100k)
Taxable dividends: $5,486 (reported on 54.3% of returns)
Here:
$5,486
State:
$3,566
(% of AGI for various income ranges: 31.2% for AGIs below $10k, 6.4% for AGIs $10k-25k, 4.8% for AGIs $25k-50k, 3.3% for AGIs $50k-75k, 3.3% for AGIs $75k-100k, 3.9% for AGIs over 100k)
Net capital gain/loss: +$12,682 (reported on 44.0% of returns)
Here:
+$12,682
State:
+$9,716
(% of AGI for various income ranges: -2.4% for AGIs below $10k, 1.6% for AGIs $10k-25k, 1.2% for AGIs $25k-50k, 0.8% for AGIs $50k-75k, 1.6% for AGIs $75k-100k, 11.8% for AGIs over 100k)
Profit/loss from business: +$23,144 (reported on 15.2% of returns)
Here:
+$23,144
State:
+$14,267
(% of AGI for various income ranges: 1.3% for AGIs below $10k, 5.6% for AGIs $10k-25k, 4.0% for AGIs $25k-50k, 5.5% for AGIs $50k-75k, 3.7% for AGIs $75k-100k, 5.0% for AGIs over 100k)
IRA payment deduction: $3,340 (reported on 3.6% of returns)
15243:
$3,340
Pennsylvania:
$2,903
(% of AGI for various income ranges: 1.4% for AGIs below $10k, 0.5% for AGIs $10k-25k, 0.3% for AGIs $25k-50k, 0.3% for AGIs $50k-75k, 0.2% for AGIs $75k-100k, 0.1% for AGIs over 100k)
Self-employed pension: $15,291 (reported on 2.2% of returns)
Here:
$15,291
Pennsylvania:
$14,674
(% of AGI for various income ranges: 0.2% for AGIs $25k-50k, 0.4% for AGIs $50k-75k, 0.2% for AGIs $75k-100k, 0.6% for AGIs over 100k)
Total itemized deductions: $20,509 (18% of AGI, reported on 51.2% of returns)
Here:
$20,509
State:
$18,804
Here:
17.6% of AGI
State:
19.5% of AGI
(% of AGI for various income ranges: 49.4% for AGIs below $10k, 20.0% for AGIs $10k-25k, 17.3% for AGIs $25k-50k, 16.0% for AGIs $50k-75k, 15.9% for AGIs $75k-100k, 12.3% for AGIs over 100k)
Charity contributions deductions: $3,952 (3% of AGI, reported on 47.4% of returns)
Here:
$3,952
State:
$3,337
Here:
3.3% of AGI
State:
3.3% of AGI
(% of AGI for various income ranges: 3.0% for AGIs below $10k, 1.9% for AGIs $10k-25k, 2.2% for AGIs $25k-50k, 1.9% for AGIs $50k-75k, 2.2% for AGIs $75k-100k, 2.8% for AGIs over 100k)
Total tax: $14,072 (reported on 81.0% of returns)
15243:
$14,072
State:
$8,008
(% of AGI for various income ranges: 4.8% for AGIs below $10k, 4.3% for AGIs $10k-25k, 7.4% for AGIs $25k-50k, 9.7% for AGIs $50k-75k, 10.8% for AGIs $75k-100k, 19.7% for AGIs over 100k)
Earned income credit: $1,324 (reported on 3.1% of returns)
Here:
$1,324
State:
$1,643
Percentage of individuals using paid preparers for their 2004 taxes: 56.3%
Here:
56%
State:
56%
(% for various income ranges: 51.7% for AGIs below $10k, 58.2% for AGIs $10k-25k, 56.1% for AGIs $25k-50k, 55.0% for AGIs $50k-75k, 53.1% for AGIs $75k-100k, 62.8% for AGIs over 100k)
Household received Food Stamps/SNAP in the past 12 months: 77 Household did not receive Food Stamps/SNAP in the past 12 months: 5,699
Women who had a birth in the past 12 months: 101 (109 now married, 0 unmarried) Women who did not have a birth in the past 12 months: 1,881 (1,187 now married, 678 unmarried)
Housing units in zip code 15243 with a mortgage: 2,836 (461 second mortgage, 4 home equity loan, 414 both second mortgage and home equity loan) Houses without a mortgage: 249
Median monthly owner costs for units with a mortgage: $1,788 Median monthly owner costs for units without a mortgage: $781
Residents with income below the poverty level in 2022:
This zip code:
3.3%
Whole state:
11.8%
Residents with income below 50% of the poverty level in 2022:
This zip code:
0.9%
Whole state:
6.1%
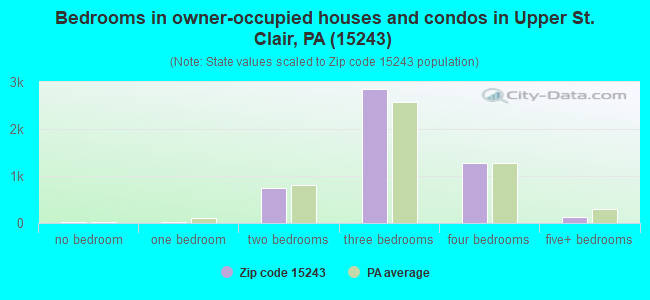
Median number of rooms in houses and condos:
Here:
7.1
State:
6.8
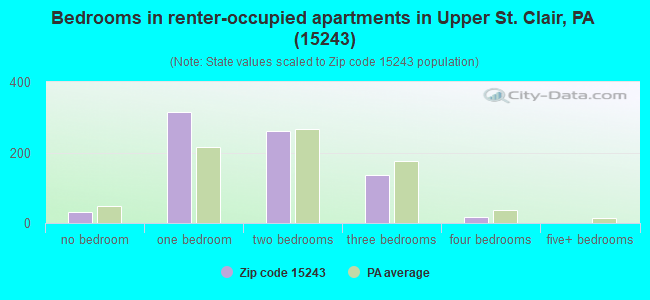
Median number of rooms in apartments:
Here:
3.9
State:
4.3
Notable locations in this zip code not listed on our city pages
Notable locations in zip code 15243: Jefferson Elementary School Library (A), Thomas Jefferson Middle School (B), Thomas Jefferson Middle School Library (C). Display/hide their locations on the map
Churches in zip code 15243 include: Temple Emanuel of South Hills (A), Chabad of the South Hills (B), Bower Hill Community Church (C), Berean Fellowship Church (D). Display/hide their locations on the map
In group quarters: 559 (-1 institutionalized population)
Size of family households: 2,122 2-persons, 632 3-persons, 826 4-persons, 165 5-persons, 55 6-persons
Size of nonfamily households: 1,861 1-person, 148 2-persons
2,121 married couples with children.
398 single-parent households (168 men, 230 women).
90.1% of residents of 15243 zip code speak English at home.
2.6% of residents speak Spanish at home (91% very well, 3% well, 4% not well, 2% not at all).
1.7% of residents speak other Indo-European language at home (77% very well, 16% well, 5% not well, 1% not at all).
4.8% of residents speak Asian or Pacific Island language at home (43% very well, 19% well, 36% not well, 3% not at all).
1.4% of residents speak other language at home (89% very well, 11% well).
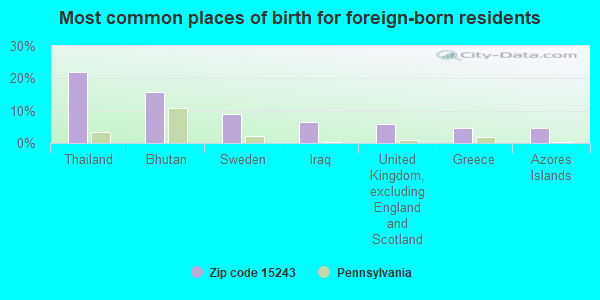
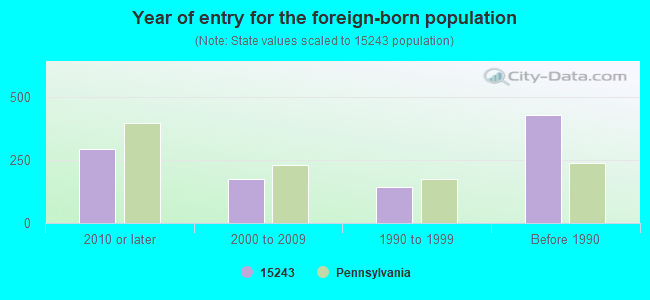
Foreign born population: 890 (6.7%) (76.2% of them are naturalized citizens)
Facilities with environmental interests located in this zip code:
ASBURY HEALTH CENTER (700 BOWER HILL ROAD in PITTSBURGH, PA)
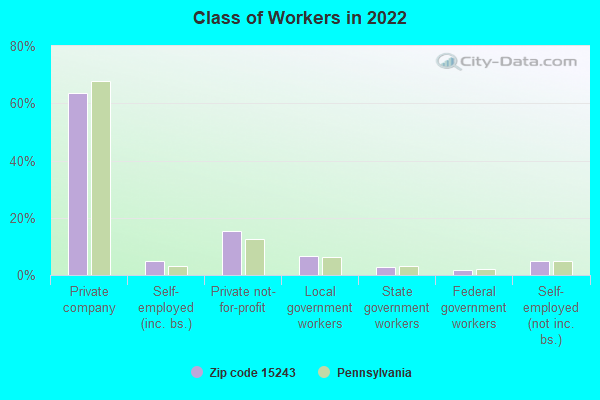
AIR MINOR (AIRS/AFS) Business SIC classification: OPERATORS OF APARTMENT BUILDINGS
Housing units lacking complete plumbing facilities: 1.0% Housing units lacking complete kitchen facilities: 2.3%
85.5%Utility gas
12.2%Electricity
0.9%No fuel used
0.8%Fuel oil, kerosene, etc.
0.6%Bottled, tank, or LP gas
Population in 1990: 14,242.
Place of birth for U.S.-born residents:
This state: 9,384
Northeast: 895
Midwest: 736
South: 899
West: 330
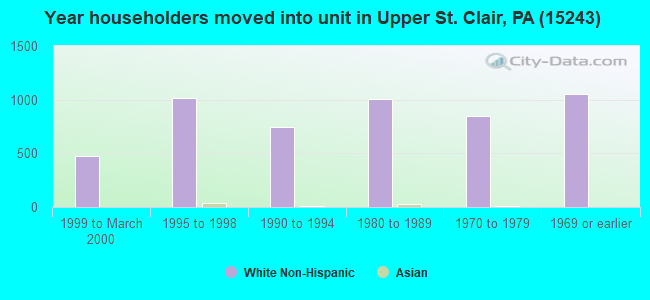
71% of the 15243 zip code residents lived in the same house 5 years ago. Out of people who lived in different houses, 75% lived in this county. Out of people who lived in different counties, 50% lived in Pennsylvania.
92% of the 15243 zip code residents lived in the same house 1 year ago. Out of people who lived in different houses, 51% moved from this county. Out of people who lived in different houses, 22% moved from different county within same state. Out of people who lived in different houses, 12% moved from different state. Out of people who lived in different houses, 16% moved from abroad.
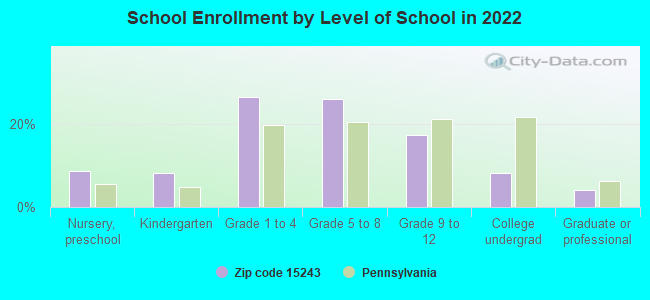
Private vs. public school enrollment:
Students in private schools in grades 1 to 8 (elementary and middle school): 56
Here:
4.4%
Pennsylvania:
15.7%
Students in private schools in grades 9 to 12 (high school): 83
Here:
19.5%
Pennsylvania:
13.4%
Students in private undergraduate colleges: 61
Here:
30.5%
Pennsylvania:
39.8%
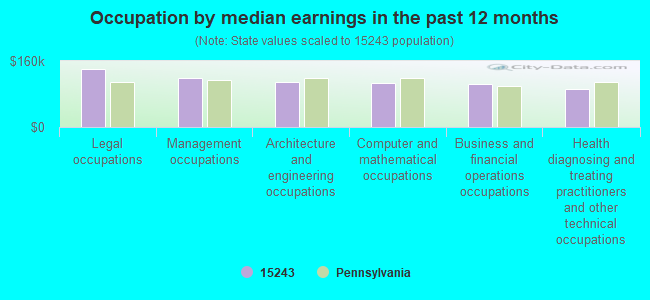
Occupation by median earnings in the past 12 months ($)
140,570Legal occupations
119,682Management occupations
108,322Architecture and engineering occupations
105,824Computer and mathematical occupations
103,258Business and financial operations occupations
93,150Health diagnosing and treating practitioners and other technical occupations
Companies with federal contracts located in this zip code:
JOHN P COLLETTI & ASSOCIATES I (373 VANADIUM ROAD in PITTSBURGH, PA; small business) : $12,960 in 6 contractsfrom 2002 to 2006
Contracts for Expert Witness, A&E Inspection Services (non-construction), Inspection Services (including commercial testing and lab services, except medical/dental) -- Ship and Marine Equipment by Army, U.S. Army Corps of Engineers - civil program financing only Signed by year:2000: $0; 2001: $0; 2002: -$3,333; 2003: $0; 2004: $0; 2005: $20,000; 2006: -$3,707.
Biggest contracts:
$10,000 with Army for Expert Witness. Signed on 2005-04-29. Completion date: 2005-04-30.
$10,000 with U.S. Army Corps of Engineers - civil program financing only for Expert Witness. Signed on 2005-04-29. Completion date: 2005-04-30.
$0 with U.S. Army Corps of Engineers - civil program financing only for A&E Inspection Services (non-construction). Taking place in IN. Signed on 2002-10-04. Completion date: 2002-09-05.
$0 with Army for Inspection Services (including commercial testing and lab services, except medical/dental) -- Ship and Marine Equipment. Taking place in TN. Signed on 2006-04-18. Completion date: 2001-09-24.
Top industries in this zip code by the number of employees in 2005:
Health Care and Social Assistance: General Medical and Surgical Hospitals (over 1000 employees: 1 establishment)
Health Care and Social Assistance: Continuing Care Retirement Communities (250-499: 1, 50-99: 2, 1-4: 1)
Health Care and Social Assistance: Offices of Physicians (except Mental Health Specialists) (20-49: 7, 10-19: 8, 5-9: 9, 1-4: 10)
Other Services (except Public Administration): Religious Organizations (50-99: 2, 10-19: 2, 5-9: 1, 1-4: 4)
Health Care and Social Assistance: Homes for the Elderly (100-249: 1)
Professional, Scientific, and Technical Services: Computer Systems Design Services (50-99: 1, 1-4: 1)
Health Care and Social Assistance: Child Day Care Services (20-49: 1, 1-4: 3)
Health Care and Social Assistance: Nursing Care Facilities (20-49: 1, 1-4: 2)
Accommodation and Food Services: Limited-Service Restaurants (20-49: 1, 1-4: 2)
Health Care and Social Assistance: Child and Youth Services (20-49: 1)
People in group quarters in 2010:
444 people in nursing facilities/skilled-nursing facilities
14 people in group homes intended for adults
People in group quarters in 2000:
658 people in nursing homes
124 people in other noninstitutional group quarters
14 people in homes for the mentally retarded
7 people in other nonhousehold living situations
Home Mortgage Disclosure Act Aggregated Statistics For Year 2009 (Based on 4 full and 6 partial tracts)
A) FHA, FSA/RHS & VA Home Purchase Loans
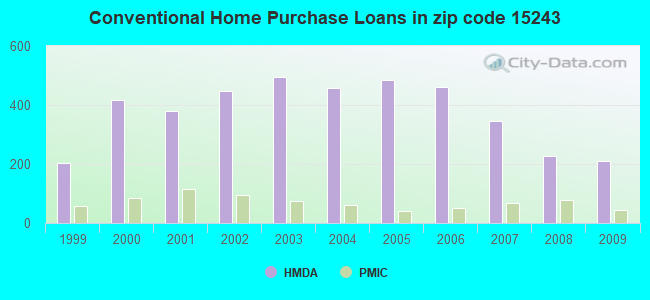
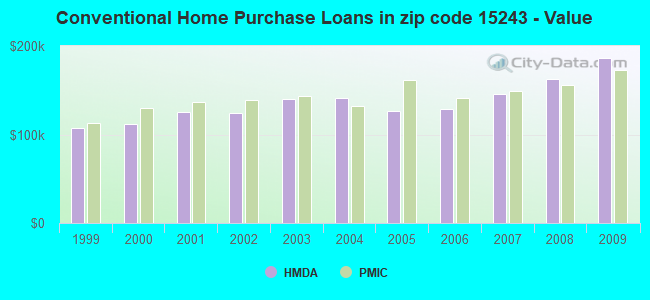
B) Conventional Home Purchase Loans
C) Refinancings
D) Home Improvement Loans
F) Non-occupant Loans on < 5 Family Dwellings (A B C & D)
Number
Average Value
Number
Average Value
Number
Average Value
Number
Average Value
Number
Average Value
LOANS ORIGINATED
123
$160,472
209
$186,158
554
$165,173
49
$56,350
8
$100,065
APPLICATIONS APPROVED, NOT ACCEPTED
2
$149,075
16
$174,268
66
$155,579
9
$157,302
0
$0
APPLICATIONS DENIED
6
$176,983
15
$254,789
141
$178,758
36
$41,073
3
$71,943
APPLICATIONS WITHDRAWN
5
$137,266
17
$251,575
114
$138,904
9
$132,017
0
$0
FILES CLOSED FOR INCOMPLETENESS
2
$115,810
3
$151,283
29
$124,901
6
$70,195
0
$0
Aggregated Statistics For Year 2008 (Based on 4 full and 6 partial tracts)
A) FHA, FSA/RHS & VA Home Purchase Loans
B) Conventional Home Purchase Loans
C) Refinancings
D) Home Improvement Loans
F) Non-occupant Loans on < 5 Family Dwellings (A B C & D)
Number
Average Value
Number
Average Value
Number
Average Value
Number
Average Value
Number
Average Value
LOANS ORIGINATED
74
$145,983
227
$162,564
244
$154,019
69
$43,291
15
$110,721
APPLICATIONS APPROVED, NOT ACCEPTED
8
$173,366
16
$165,296
45
$149,905
7
$130,093
0
$0
APPLICATIONS DENIED
5
$116,052
12
$157,854
154
$174,973
39
$58,038
4
$82,080
APPLICATIONS WITHDRAWN
4
$158,065
11
$201,219
53
$178,787
6
$63,145
1
$42,260
FILES CLOSED FOR INCOMPLETENESS
0
$0
1
$148,870
9
$139,936
4
$98,870
2
$88,980
Aggregated Statistics For Year 2007 (Based on 4 full and 6 partial tracts)
A) FHA, FSA/RHS & VA Home Purchase Loans
B) Conventional Home Purchase Loans
C) Refinancings
D) Home Improvement Loans
F) Non-occupant Loans on < 5 Family Dwellings (A B C & D)
G) Loans On Manufactured Home Dwelling (A B C & D)
Number
Average Value
Number
Average Value
Number
Average Value
Number
Average Value
Number
Average Value
Number
Average Value
LOANS ORIGINATED
31
$129,781
345
$145,554
295
$146,630
136
$55,607
36
$133,663
0
$0
APPLICATIONS APPROVED, NOT ACCEPTED
1
$97,110
34
$162,070
58
$111,829
23
$60,815
2
$80,590
0
$0
APPLICATIONS DENIED
1
$74,910
41
$117,247
197
$160,434
45
$47,835
12
$119,504
2
$29,970
APPLICATIONS WITHDRAWN
0
$0
30
$138,303
68
$138,032
8
$37,054
10
$81,913
0
$0
FILES CLOSED FOR INCOMPLETENESS
0
$0
23
$152,463
28
$197,522
3
$119,243
1
$144,770
0
$0
Aggregated Statistics For Year 2006 (Based on 4 full and 6 partial tracts)
A) FHA, FSA/RHS & VA Home Purchase Loans
B) Conventional Home Purchase Loans
C) Refinancings
D) Home Improvement Loans
F) Non-occupant Loans on < 5 Family Dwellings (A B C & D)
G) Loans On Manufactured Home Dwelling (A B C & D)
Number
Average Value
Number
Average Value
Number
Average Value
Number
Average Value
Number
Average Value
Number
Average Value
LOANS ORIGINATED
21
$130,594
460
$129,216
424
$116,611
137
$50,029
55
$123,262
0
$0
APPLICATIONS APPROVED, NOT ACCEPTED
0
$0
35
$126,080
79
$116,814
15
$42,694
2
$155,655
0
$0
APPLICATIONS DENIED
0
$0
27
$116,740
252
$146,250
69
$50,598
7
$118,924
1
$28,770
APPLICATIONS WITHDRAWN
4
$151,015
18
$89,456
154
$129,219
9
$96,006
10
$108,937
0
$0
FILES CLOSED FOR INCOMPLETENESS
0
$0
6
$211,143
35
$158,307
0
$0
6
$101,730
0
$0
Aggregated Statistics For Year 2005 (Based on 4 full and 6 partial tracts)
A) FHA, FSA/RHS & VA Home Purchase Loans
B) Conventional Home Purchase Loans
C) Refinancings
D) Home Improvement Loans
F) Non-occupant Loans on < 5 Family Dwellings (A B C & D)
G) Loans On Manufactured Home Dwelling (A B C & D)
Number
Average Value
Number
Average Value
Number
Average Value
Number
Average Value
Number
Average Value
Number
Average Value
LOANS ORIGINATED
21
$121,412
485
$127,028
455
$120,171
119
$43,696
39
$90,202
1
$1,800
APPLICATIONS APPROVED, NOT ACCEPTED
0
$0
29
$119,681
77
$96,299
17
$33,936
1
$53,050
0
$0
APPLICATIONS DENIED
0
$0
29
$97,167
268
$146,461
62
$48,829
13
$105,837
0
$0
APPLICATIONS WITHDRAWN
2
$128,040
32
$132,005
162
$151,655
30
$127,236
7
$77,024
0
$0
FILES CLOSED FOR INCOMPLETENESS
0
$0
16
$149,542
44
$140,556
7
$57,966
0
$0
0
$0
Aggregated Statistics For Year 2004 (Based on 4 full and 6 partial tracts)
A) FHA, FSA/RHS & VA Home Purchase Loans
B) Conventional Home Purchase Loans
C) Refinancings
D) Home Improvement Loans
F) Non-occupant Loans on < 5 Family Dwellings (A B C & D)
G) Loans On Manufactured Home Dwelling (A B C & D)
Number
Average Value
Number
Average Value
Number
Average Value
Number
Average Value
Number
Average Value
Number
Average Value
LOANS ORIGINATED
30
$135,380
457
$140,955
604
$121,208
139
$47,851
39
$101,682
6
$43,752
APPLICATIONS APPROVED, NOT ACCEPTED
2
$84,055
54
$173,471
135
$112,667
16
$28,429
2
$206,130
0
$0
APPLICATIONS DENIED
6
$115,118
26
$138,193
286
$128,196
65
$26,720
12
$41,210
0
$0
APPLICATIONS WITHDRAWN
0
$0
53
$118,714
127
$138,726
15
$65,509
4
$77,425
4
$113,600
FILES CLOSED FOR INCOMPLETENESS
0
$0
10
$125,573
67
$148,930
10
$63,501
0
$0
0
$0
Aggregated Statistics For Year 2003 (Based on 4 full and 6 partial tracts)
A) FHA, FSA/RHS & VA Home Purchase Loans
B) Conventional Home Purchase Loans
C) Refinancings
D) Home Improvement Loans
E) Loans on Dwellings For 5+ Families
F) Non-occupant Loans on < 5 Family Dwellings (A B C & D)
Number
Average Value
Number
Average Value
Number
Average Value
Number
Average Value
Number
Average Value
Number
Average Value
LOANS ORIGINATED
48
$121,954
496
$140,367
1,731
$124,918
127
$39,278
1
$404,640
42
$87,502
APPLICATIONS APPROVED, NOT ACCEPTED
2
$101,650
33
$139,246
239
$116,368
28
$39,461
0
$0
3
$92,883
APPLICATIONS DENIED
0
$0
15
$84,651
353
$136,116
33
$52,089
0
$0
16
$84,005
APPLICATIONS WITHDRAWN
2
$123,750
44
$126,569
196
$137,194
16
$30,754
0
$0
4
$126,112
FILES CLOSED FOR INCOMPLETENESS
0
$0
14
$237,198
61
$156,736
8
$35,798
0
$0
2
$96,680
Aggregated Statistics For Year 2002 (Based on 4 full and 6 partial tracts)
A) FHA, FSA/RHS & VA Home Purchase Loans
B) Conventional Home Purchase Loans
C) Refinancings
D) Home Improvement Loans
F) Non-occupant Loans on < 5 Family Dwellings (A B C & D)
Number
Average Value
Number
Average Value
Number
Average Value
Number
Average Value
Number
Average Value
LOANS ORIGINATED
32
$107,087
447
$124,731
1,040
$123,537
101
$36,973
20
$133,586
APPLICATIONS APPROVED, NOT ACCEPTED
0
$0
46
$117,059
165
$111,317
32
$47,268
2
$18,570
APPLICATIONS DENIED
0
$0
24
$113,028
236
$112,728
35
$32,614
5
$123,452
APPLICATIONS WITHDRAWN
4
$112,082
25
$140,523
160
$124,917
18
$41,152
1
$176,050
FILES CLOSED FOR INCOMPLETENESS
2
$132,450
10
$112,746
50
$138,844
4
$21,270
4
$34,852
Aggregated Statistics For Year 2001 (Based on 4 full and 6 partial tracts)
A) FHA, FSA/RHS & VA Home Purchase Loans
B) Conventional Home Purchase Loans
C) Refinancings
D) Home Improvement Loans
F) Non-occupant Loans on < 5 Family Dwellings (A B C & D)
Number
Average Value
Number
Average Value
Number
Average Value
Number
Average Value
Number
Average Value
LOANS ORIGINATED
53
$107,609
380
$125,765
924
$109,210
161
$35,260
17
$85,144
APPLICATIONS APPROVED, NOT ACCEPTED
0
$0
30
$136,749
201
$88,344
45
$45,924
3
$45,880
APPLICATIONS DENIED
0
$0
31
$146,925
230
$97,009
55
$34,629
2
$241,700
APPLICATIONS WITHDRAWN
3
$115,773
39
$147,467
125
$115,448
28
$40,328
7
$114,364
FILES CLOSED FOR INCOMPLETENESS
0
$0
4
$299,855
25
$140,546
4
$13,115
0
$0
Aggregated Statistics For Year 2000 (Based on 4 full and 6 partial tracts)
A) FHA, FSA/RHS & VA Home Purchase Loans
B) Conventional Home Purchase Loans
C) Refinancings
D) Home Improvement Loans
F) Non-occupant Loans on < 5 Family Dwellings (A B C & D)
Number
Average Value
Number
Average Value
Number
Average Value
Number
Average Value
Number
Average Value
LOANS ORIGINATED
47
$95,489
417
$111,341
239
$86,262
118
$24,360
6
$63,993
APPLICATIONS APPROVED, NOT ACCEPTED
0
$0
39
$149,116
52
$90,602
32
$24,048
0
$0
APPLICATIONS DENIED
2
$87,770
21
$124,850
128
$113,678
48
$24,567
2
$35,770
APPLICATIONS WITHDRAWN
0
$0
33
$151,359
57
$83,430
11
$62,604
4
$41,540
FILES CLOSED FOR INCOMPLETENESS
0
$0
5
$104,486
22
$103,885
0
$0
0
$0
Aggregated Statistics For Year 1999 (Based on 2 full and 2 partial tracts)
A) FHA, FSA/RHS & VA Home Purchase Loans
B) Conventional Home Purchase Loans
C) Refinancings
D) Home Improvement Loans
F) Non-occupant Loans on < 5 Family Dwellings (A B C & D)
2005 - 2018 National Fire Incident Reporting System (NFIRS) incidents
Based on the data from the years 2005 - 2018 the average number of fire incidents per year is 18. The highest number of reported fires - 33 took place in 2018, and the least - 7 in 2008. The data has an increasing trend.
When looking into fire subcategories, the most reports belonged to: Structure Fires (64.1%), and Outside Fires (17.6%).
Fire incident types reported to NFIRS in Zip Code 15243
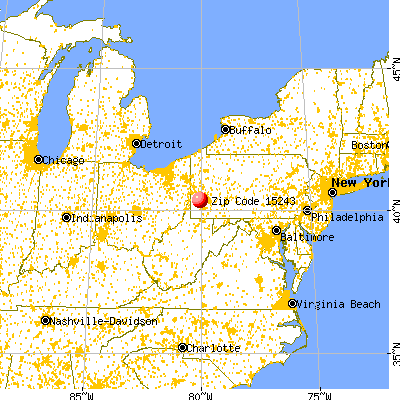


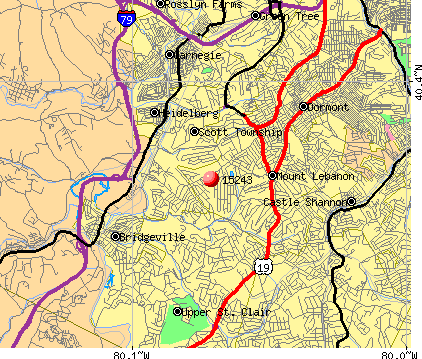 Nearest zip codes: 15228, 15241, 15216, 15142, 15220, 15106.
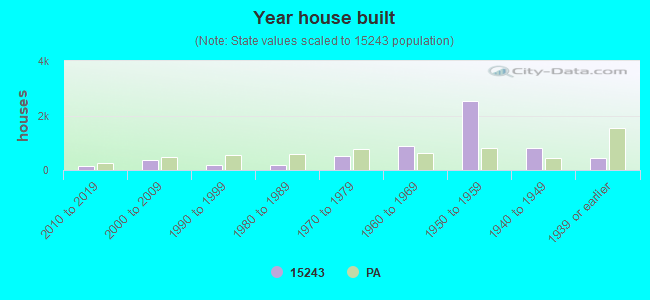


 Based on the data from the years 2005 - 2018 the average number of fire incidents per year is 18. The highest number of reported fires - 33 took place in 2018, and the least - 7 in 2008. The data has an increasing trend.
 When looking into fire subcategories, the most reports belonged to: Structure Fires (64.1%), and Outside Fires (17.6%).